I know that there are many market professionals that have favorite indicators that they swear by. Some are proprietary and take into account many different measures. Some are public like Bollinger Bands®. And many can be adjusted in many ways to gain an edge. But for the vast majority of you these are all worthless. And that is because most of you use these indicators to keep you on the sidelines in cash or to put you back there. Professionals do not use indicators that way.
I do not care if you use 1, 2 or 10 indicators in your work. At some time (and for most of you a lot of the time) they are useless. It is just human nature to focus more on protecting a downside loss that on continuing a winner. That is perfectly fine with me. The more of you that are looking for reasons to leave the market the better I will feel about the market.

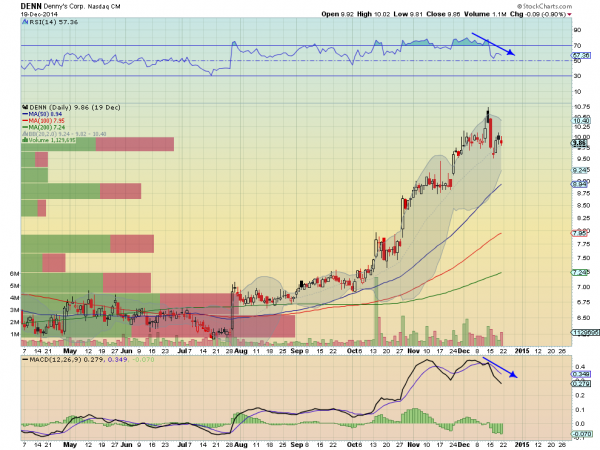
Let me set a scenario for you. Denny's (NASDAQ:DENN) was a hot stock the last quarter of 2014. It moved out of a base from August to early October and rocketed higher nearly 50% by mid December. But then the RSI was overbought and starting to move lower. The MACD also made a double top and started rolling down. If you sold the stock based on these changes to indicators then you locked in probably over 40%. Not bad.

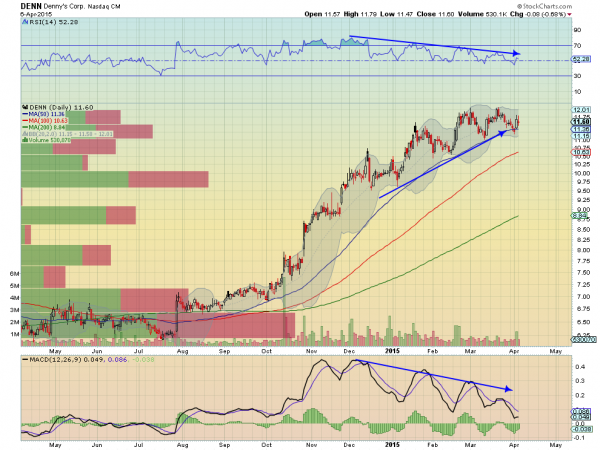
But what if you ignored that divergence? Since the RSI and MACD started lower the price has actually made 5 higher lows and a 3 higher highs, more than 10% above the December top and pullback. Oh, and those indicators still are diverging. It actually looks like they finally be right, in predicting some consolidation at least.
Denny’s is just a simple example but there are countless traders I see everyday that are pointing out their favorite indicator on the S&P 500 as a reason why you should “take some off” now. I can only imagine that the group that started this process of buying and selling on indicators were market strategists or portfolio managers or some other function that does not actually get paid by the execution price in and out.
Using indicators to augment your process is perfectly fine. But you need to remember how that indicator was created. Some genius (I’ll be nice and call them that), took the actual price activity and manipulated it a million different ways until they found a great fit to a back test of data. They may have actually played it forward and tweeked it a bit from there too. Doesn’t that bother you? Do you want to make buy and sell decisions on the creation of a mathematical formula that used some set of price history to come up with a new number that may or may not mean something this time? What was wrong with just using the actual price you thought was a good stop from your original plan?
Now before you all jump down my throat, yes I do use indicators. But to confirm what I am seeing in price, or not. I do not trade off of an extreme indicator reading. I may trade off of an extreme price move and look at the indicator as confirming that idea. Look at price first. Nothing else matters to your account value.
Disclaimer: The information in this blog post represents my own opinions and does not contain a recommendation for any particular security or investment. I or my affiliates may hold positions or other interests in securities mentioned in the Blog, please see my Disclaimer page for my full disclaimer.
