Q3 Earnings Alert! Plan early for this week’s stock reports with all key data in 1 placeSee list

Stocks Verging On Signal Not Seen In Three Years

Published 02/13/2019, 11:27 PM
US500
-

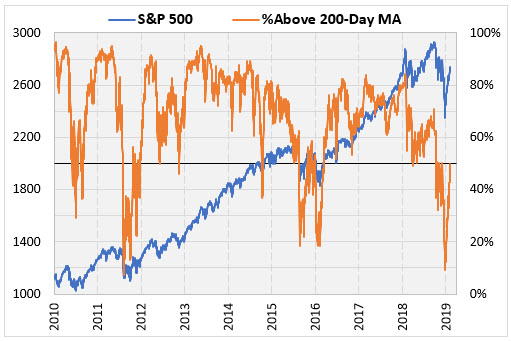
As we noted in this week's Monday Morning Outlook, nearly half of S&P 500 Index (SPX) stocks are above their 200-day moving averages. While we haven't yet crossed the 50%-of-stocks threshold, we're definitely on the cusp. Below, we take a look at SPX performance when the majority of stocks trade above their 200-day trendlines after a lengthy stretch of time -- something we haven't seen since March 2016.

Specifically, Schaeffer's Senior Quantitative Analyst Rocky White looked at SPX performance when the percentage of stocks above their 200-day moving averages hit 50%, following at least a month below this level. White analyzed SPX data since 2000 and only looked at the current S&P 500 members. This amounts to roughly 400 stocks since some current SPX components don't have enough historical returns.

As of Friday's close, 47.1% of S&P 500 stocks were above their 200-day trendlines. As alluded to earlier, the last signal we saw was in March 2016. Prior to that, you'd have to go back to October 2015 for a signal, and to October 2011 before that. It's also noteworthy that this signal flashed in June 2009, three months after the March 2009 bottom.
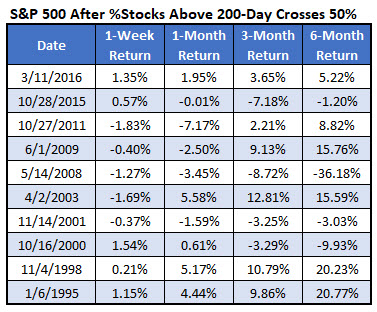
SPX 200day MAs Last Signals

SPX Chart Above 200day MAs

As mentioned in Monday Morning Outlook, when the percentage of S&P 500 stocks crossed above their 200-day moving average after a lengthy stretch, "various rallies from correction territories have stalled." The data below further supports that theory, with the SPX going on to post weaker-than-usual short-term returns after signals, of which there were 10 going back to 1995.

Specifically, the index averaged a one-week loss of 0.07% after signals, and a one-month gain of 0.3%. It was higher just half the time. That's compared to average anytime one-week and one-month gains of 0.18% and 0.74%, respectively, with win rates of 58% and 64%.

Six months after a signal, the SPX was up 3.61% on average, and higher 60% of the time. That's lower than its average anytime six-month return of 4.67%, with a 75% win rate. However, keep in mind that a lot of that is due to the steep drop stocks experienced after the May 2008 signal, with the S&P falling more than 36% during the financial crisis.
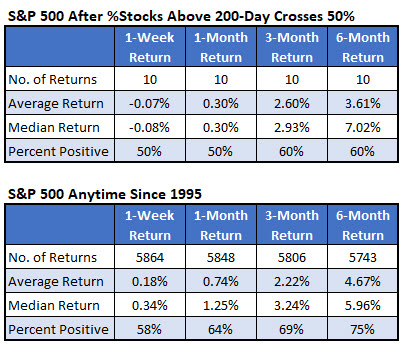
SPX After Signals Vs Anytime

Latest comments

Loading next article…
Risk Disclosure: Trading in financial instruments and/or cryptocurrencies involves high risks including the risk of losing some, or all, of your investment amount, and may not be suitable for all investors. Prices of cryptocurrencies are extremely volatile and may be affected by external factors such as financial, regulatory or political events. Trading on margin increases the financial risks.
Before deciding to trade in financial instrument or cryptocurrencies you should be fully informed of the risks and costs associated with trading the financial markets, carefully consider your investment objectives, level of experience, and risk appetite, and seek professional advice where needed.
Fusion Media would like to remind you that the data contained in this website is not necessarily real-time nor accurate. The data and prices on the website are not necessarily provided by any market or exchange, but may be provided by market makers, and so prices may not be accurate and may differ from the actual price at any given market, meaning prices are indicative and not appropriate for trading purposes. Fusion Media and any provider of the data contained in this website will not accept liability for any loss or damage as a result of your trading, or your reliance on the information contained within this website.
It is prohibited to use, store, reproduce, display, modify, transmit or distribute the data contained in this website without the explicit prior written permission of Fusion Media and/or the data provider. All intellectual property rights are reserved by the providers and/or the exchange providing the data contained in this website.
Fusion Media may be compensated by the advertisers that appear on the website, based on your interaction with the advertisements or advertisers.
© 2007-2024 - Fusion Media Limited. All Rights Reserved.