Stocks finished the day pretty much flat today, with the S&P 500 up about 15 bps, while the Q)s finished the day higher by 30 bps. Right now, we appear to be in a holding pattern. That may change today with jobless claims and durable good order along with a second read on 1Q GDP.
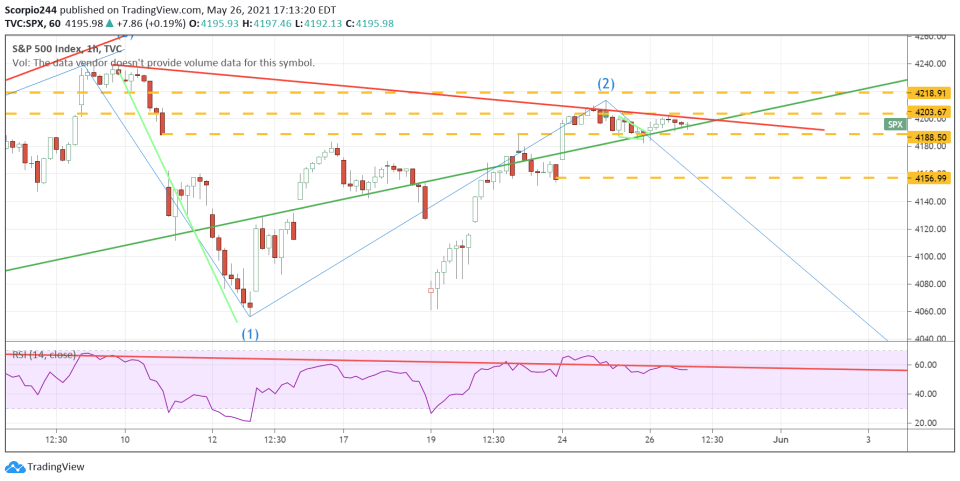
The pattern in the S&P 500 futures suggests that we still see some more downside, with a push to around 4,155. The VIX was down almost 8% today, and there was no lift to the S&P 500; on a day when falling implied volatility should have lifted equities, it didn’t. I would actually view that as negative for stocks overall. It has been very rate over the past year and a half to see a day like today.
The volume also disappeared today, with the SPY ETF seeing its lowest levels since the middle of February. Maybe I was not the only feeling like being on summer vacation.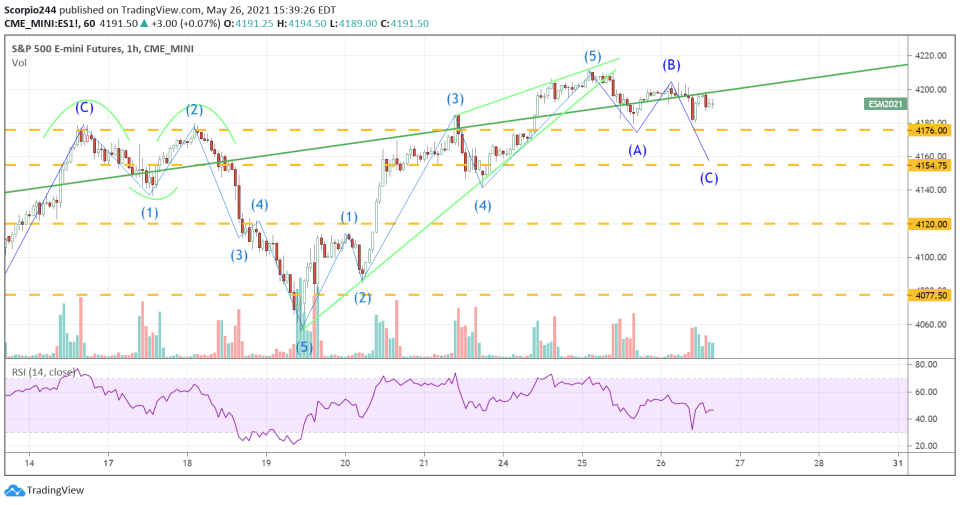
Based on the VIX and low volume day, one would have expected the bulls to be firmly in charge. They clearly weren’t, and this does suggest something.
The S&P 500 continues to hold the March 2020 uptrend. However, I was able to put in a downtrend for the index today for the first time. If this trend is correct, coupled with what I think could be the start of a Wave 3 lower, we could see sharply lower prices in the days ahead. Starting tomorrow, the economic data picks up materially.
Russell 2000
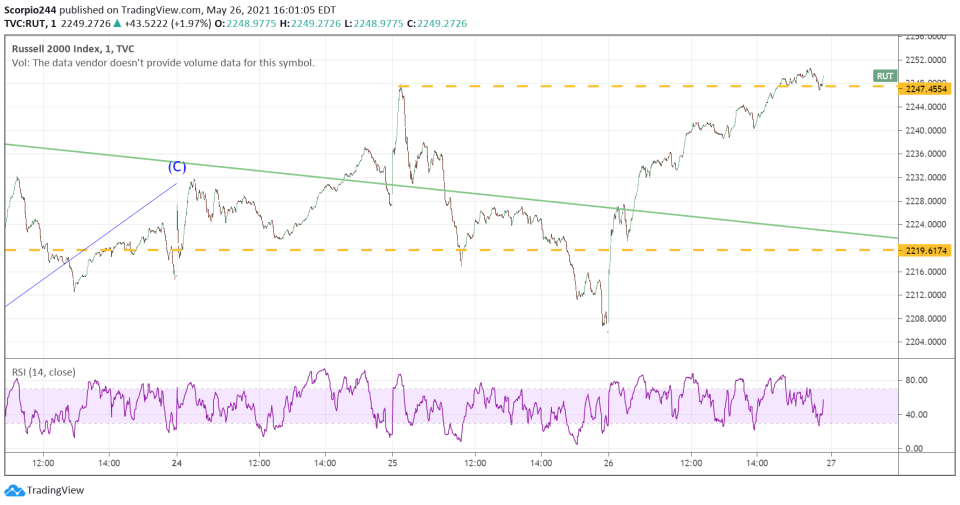
The Russell (NYSE:IWM) surged today by 2%, continuing the confusion that is this index every day. At times it seems to have no sense of direction. I’m going to try to take another look at this tomorrow and see. Right now, the index got stuck at Monday’s highs.
Nvidia
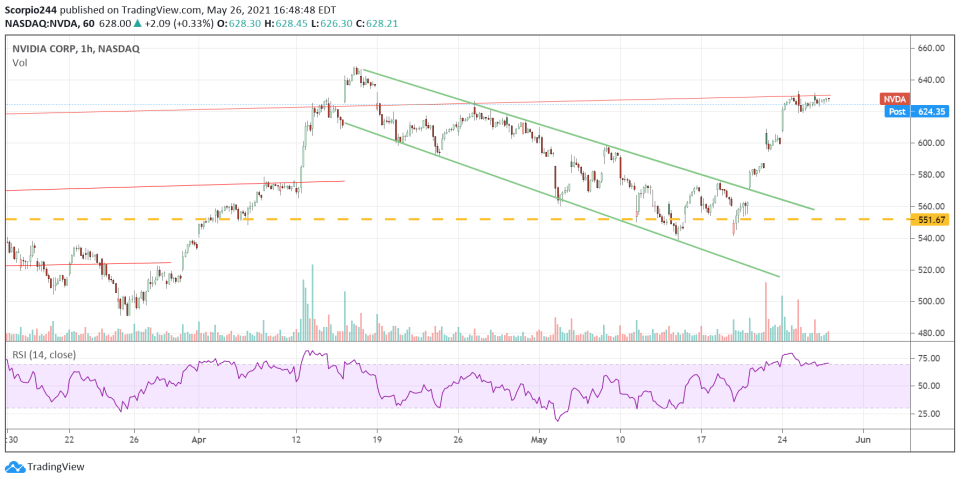
Anyway, NVIDIA (NASDAQ:NVDA) reported better than expected results; no surprise there, it always does. The stock is trading down after the results, though, which would seem surprising, but when you dig into the numbers, while they beat the mean estimates, most of the numbers and guidance missed the street high estimates, which seems to be what investors in this market seem to be looking for. We saw the same thing with Amazon (NASDAQ:AMZN). If that is the case, the stock can trade lower because beating the mean is not good enough these days. Stocks that don’t go up after good earnings because they aren’t good enough, have only one way to go, which is probably lower.
Silver
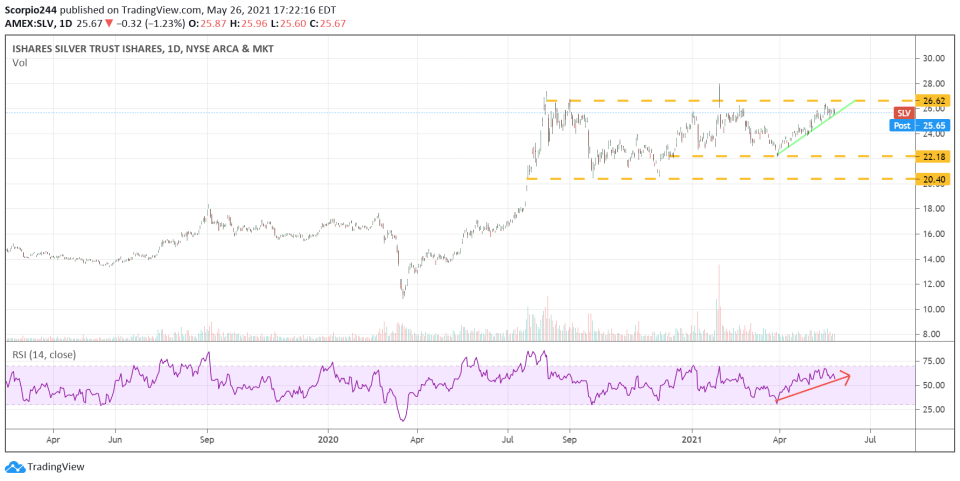
Silver prices could be heading much higher, yeah, I said silver. There were some really big bullish bets in the SLV ETF that showed on this morning’s open interest change reports. The calls for the Sept. 30 for the $32 strike were being bought. The chart certainly suggests a big move could be ahead of the SLV ETF, if it can get over $26.60.
Anyway, I am out of juice today, so that’s it.

