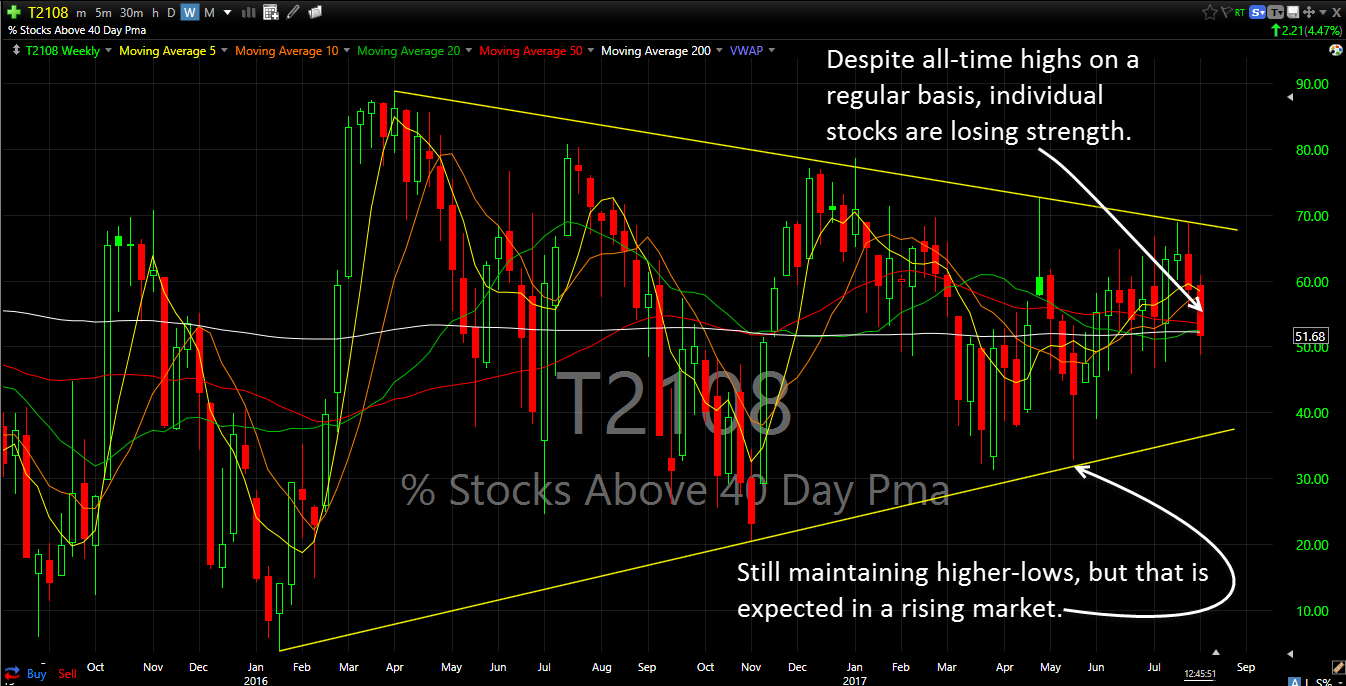
I use the T2108 to gauge the overall market enthusiasm and whether the stocks, as a whole, are really following what the market is telling us.
Just looking at the stock market indices, in particular the Dow Jones Industrial Average. Day after day, it makes new all-time highs. Each day it rides one or two individual stocks higher.
Every day it is a different sector, a different industry or different earnings report that drives the markets to new highs.
But what happens when we look at just the price action of stocks - how are they actually doing?
That is what the T2108 does — it ignores the headlines and just tells you what percentage of stocks are trading above their 40-day moving average.
And guess what?
The T2108 continues to decline.
Continues to weaken.
Continues to diverge.
Which is why I am willing to let the crowd be uber bullish about this market, at this point, but I for one will choose a more neutral holding of stocks.
I want the flexibility.
Sure, if the market can breakout of this boring 12-day trading range to the upside, I'll get more bullish, but if it can't, and breaks down instead, then I maintain the flexibility to get more bearish and more short on this market, as a result.
So check out the T2108 chart below and tell me what you think.

