Stocks opened up on a bullish note yesterday, but the bulls gave up all of their gains and then some. This has happened despite the Fed’s surprise rate cut that intended to calm the markets. As stocks closed the day back below the key support, where does that leave them exactly?
Let’s jump right into the daily chart (charts courtesy of stockcharts.com).

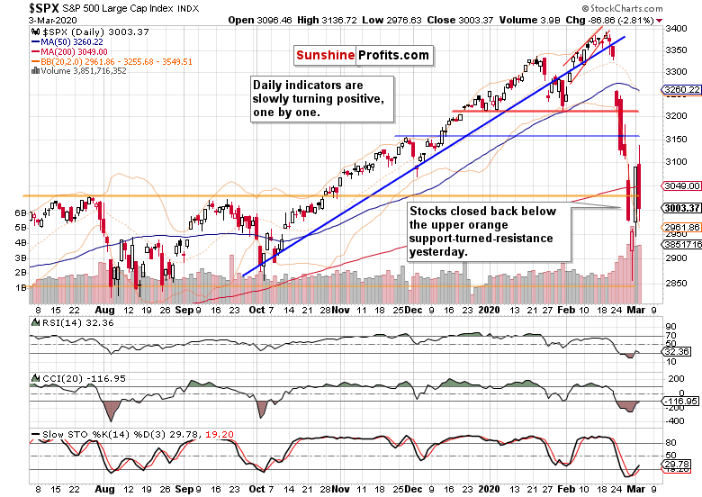
Yesterday’s early gains have evaporated, and stocks broke back below the upper orange support zone. But if it were a lasting reversal lower, the volume could have been higher. As it was in line with the preceding upswing’s one, we can’t read too much into this metric alone.
The daily indicators though, are starting to turn positive. Stochastics with its buy signal left the oversold zone, and so did the RSI despite yesterday’s downswing. And the CCI is on the verge of leaving its extreme territory as well.
It would still seem premature though to declare an end to the sharp correction. It’s because yesterday’s session shows that the Fed move failed to calm the markets. Stocks were questioning the reason to rally further, and the decision’s aftermath smacked of buy the rumor, sell the news.
With the S&P 500 Futures trading at around 3060 as we speak, stocks pared over half of their yesterday’s losses. However, they’re still consolidating around the orange support zone, and the rebound from Friday’s lows looks to have stalled despite the supportive Fed monetary policy announcement. This doesn’t bode well for the bulls in the short-term.
Let’s quote yesterday’s observations:
(…) it appears quite likely that the bears will at some point test the bulls’ resolve. As a result, there would be more short-term risk to the downside rather than to the upside.
Coupled with the scenario of the daily indicators working out their oversold readings while prices goes sideways to marginally higher, it would favor more downside in the coming sessions.
Let’s check how the risk-off trade is doing. Do the Treasuries and Japanese yen support the bearish analysis?

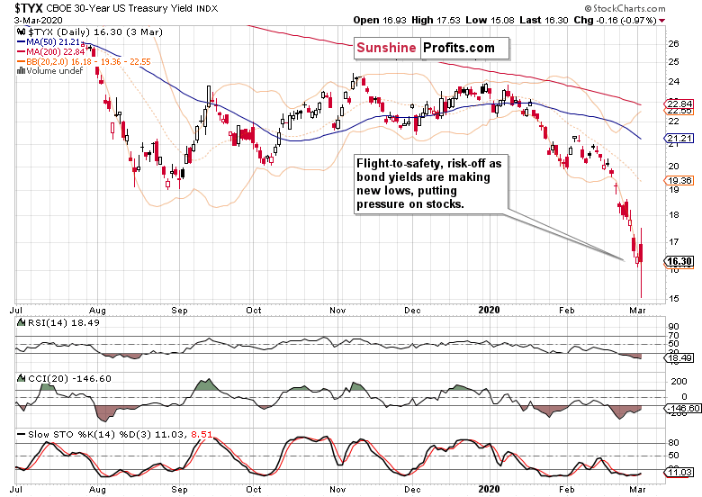
The long end of the curve is represented by the 30-year Treasury note. As the Fed controls the short-term interest rates, this bond represents the long-term views of the market. And despite the partial recovery from yesterday’s plunge, the sliding yields keep flashing red. That is dangerous to the stock market bulls.
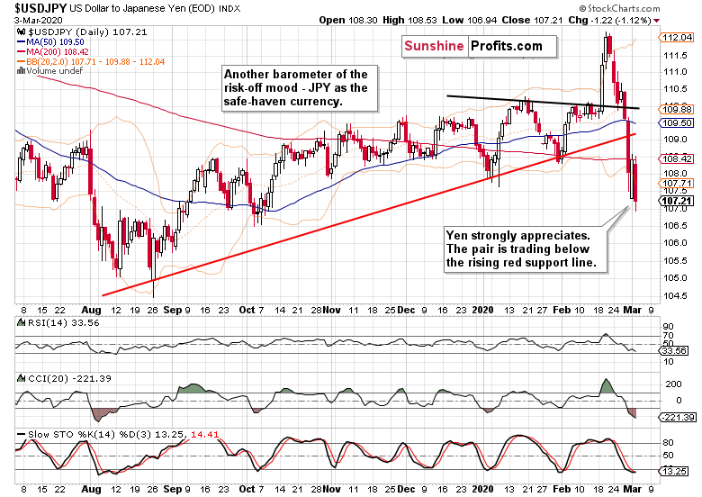
Okay, long-dated bonds aren’t impressed yet. Perhaps the yen would show that a turnaround is approaching?

Nope. Fresh 2020 lows have been made yesterday. The risk-off trade is still doing fine.
Taking all the above into account, opening short positions appears to be justified at the moment of writing these words. The probable downswing offers us a favorable setup from the risk reward point of view regardless of the positively-leaning daily indicators. We expect the market to question yesterday’s remedy offered in short order. Remember, the Fed can’t by fiat cause the supply chains to return to the pre-coronavirus state, or repair the shaken confidence in consumers’ minds. As it’s quite likely that the situation on the ground will still get worse before it gets better, the short position in the currently high volatility is justified. The position details are reserved for our subscribers.
Summing Up
it’s true that the medium-term S&P 500 outlook has improved with yesterday’s price action and that the daily chart is starting to send some bullish signals. It’s however the reaction to the Fed’s accommodation that has us on guard and of the opinion that there remains some more work to do on the downside before a lasting recovery takes place. The very short-term balance of forces thus appears to slightly favor the bears, and is favored also by the risk-off trade performance. Therefore, opening short-positions with a reasonably close take-profit target is justified.
