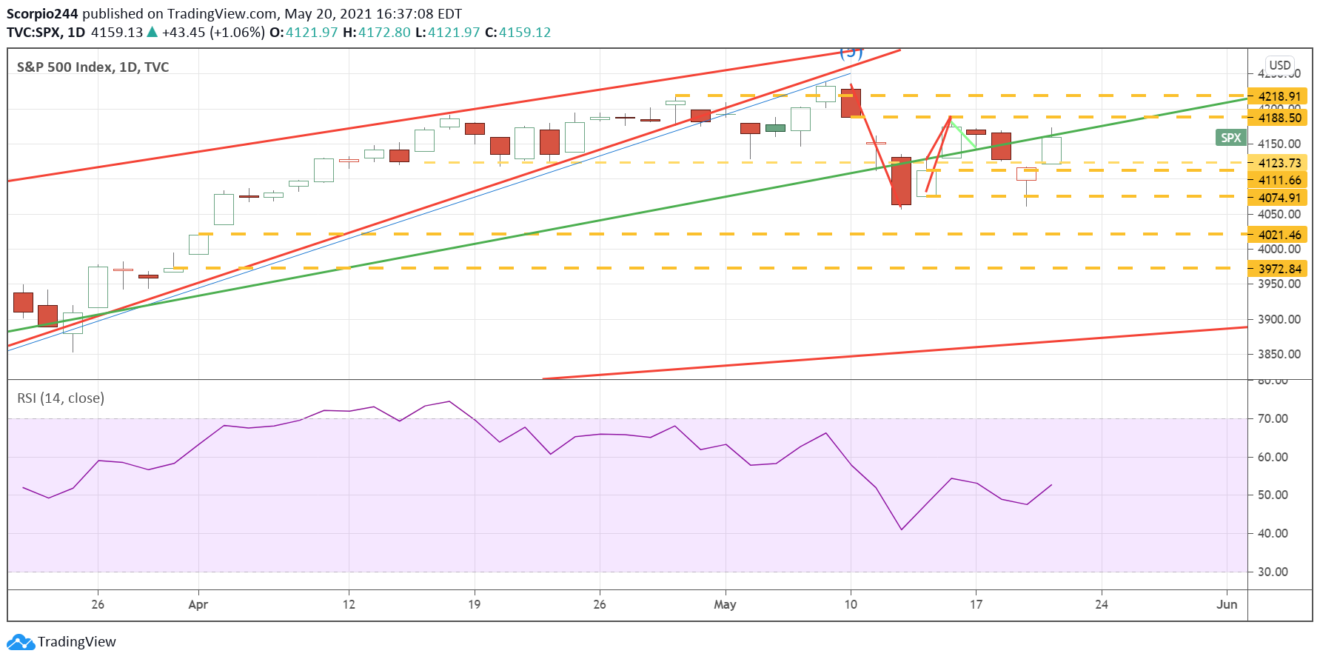
Stocks rallied, but this was one of those options expiration, put selling, and VIX collapsing rallies. I don’t think it was anything more than that, and I think one shouldn’t overthink it. It seemed pretty clear around midday that the plan was to keep the SPX around 4,150 and the Qs below $330; that is pretty much what happened. The S&P 500 closed at 4,159, close enough to the strike price that put owners can move things around overnight in the futures if they want to.
S&P 500
The index closed just below the March 2020 trend line. If this was an attempt to retake the trend line, then it failed, and if it failed, then this rally should reverse course. If today hadn’t been the day before options expiration, it would be an easier call to make, but the VIX collapsed; it was clear traders were closing out put positions, which gave the market its huge boost.
The picture becomes murky because volatility will pick up once we get through option expiration today, possibly after the opening. The opening is when SPX options expire.
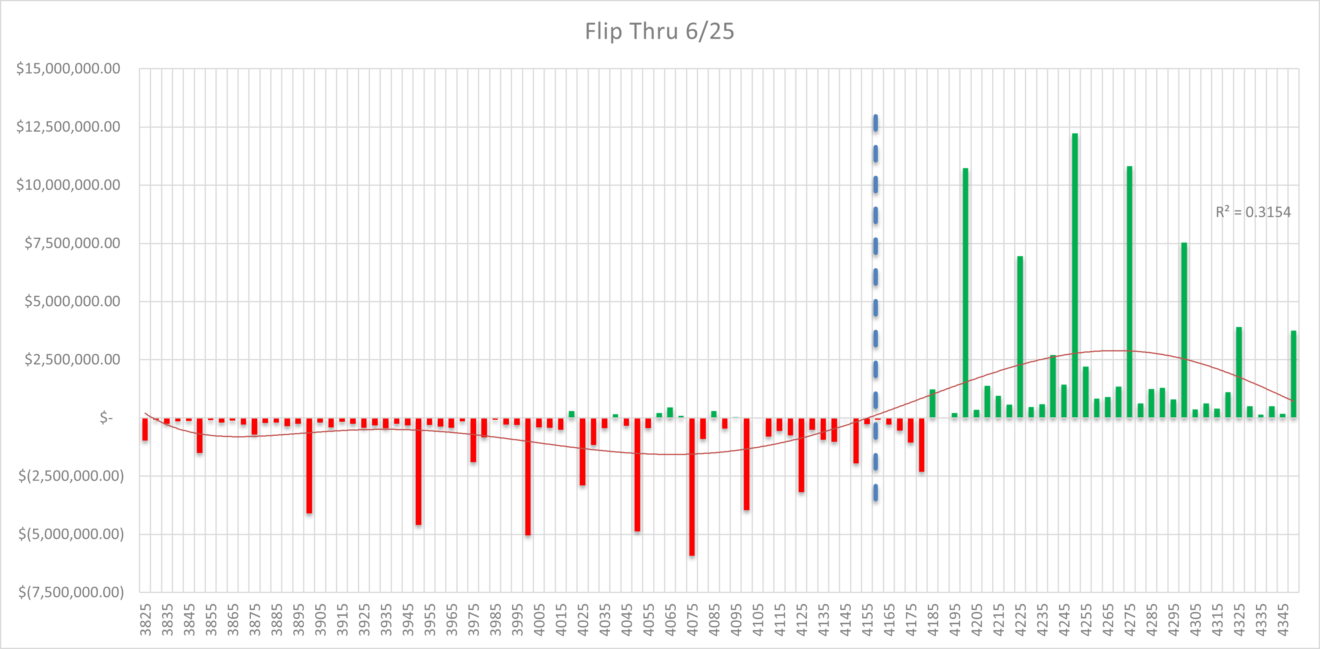
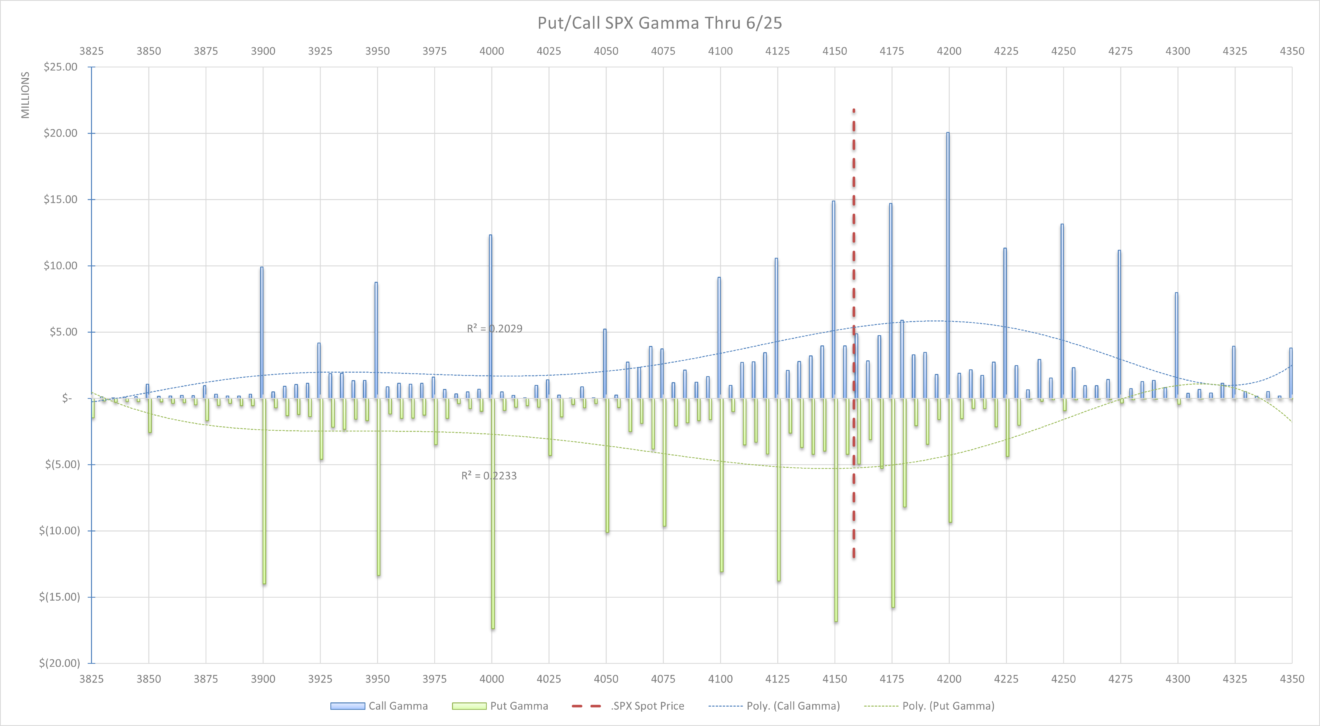
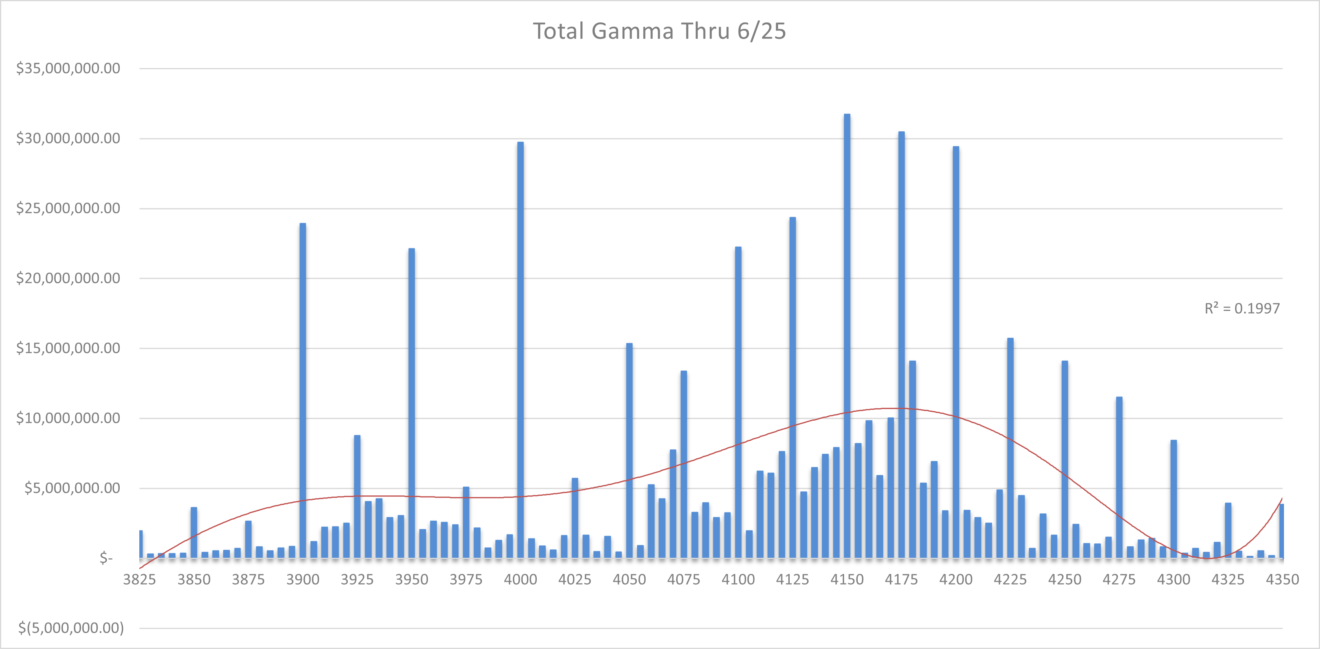
According to my gamma model, the S&P 500 as of yesterday excluding today’s expiration date, is controlled by the put side of the equation. But this may change tomorrow once open interest levels update.
Additionally, gamma will be much more evenly distributed, so I think the market will move around a lot next week.
Bitcoin
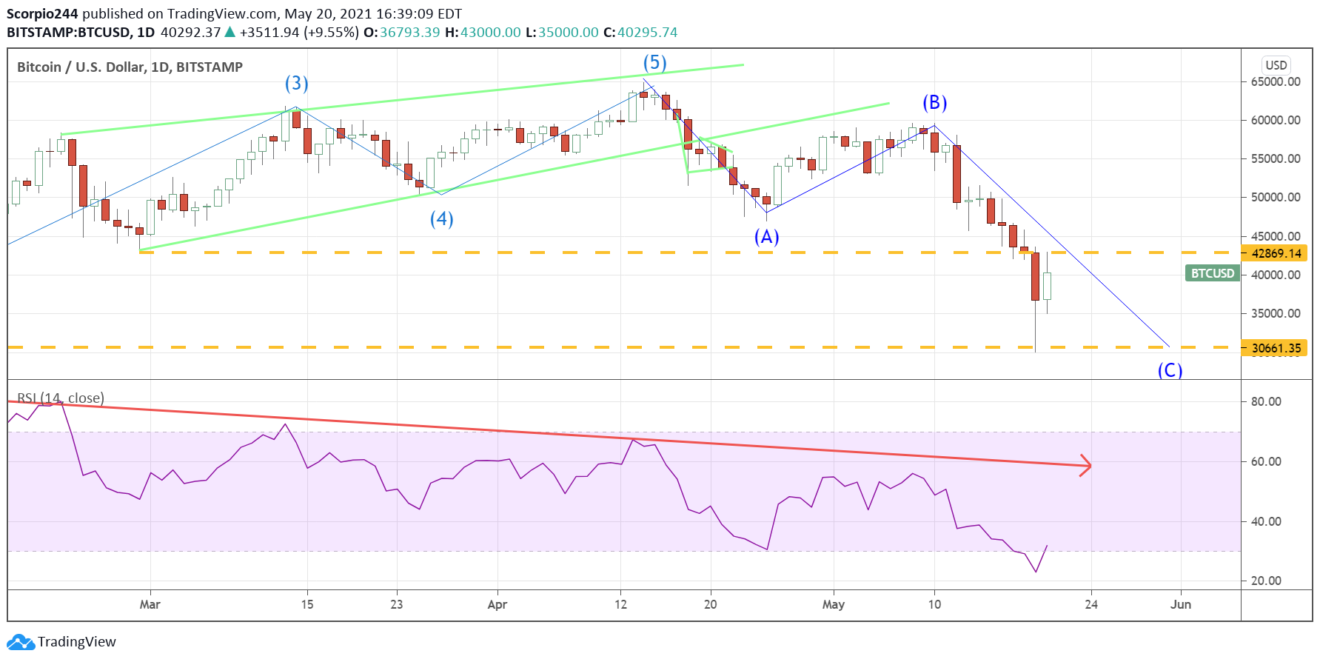
Bitcoin rose right to 42,000 as we thought it might and failed. No surprise. I still think we revisit that 30,000 low again.
Oil
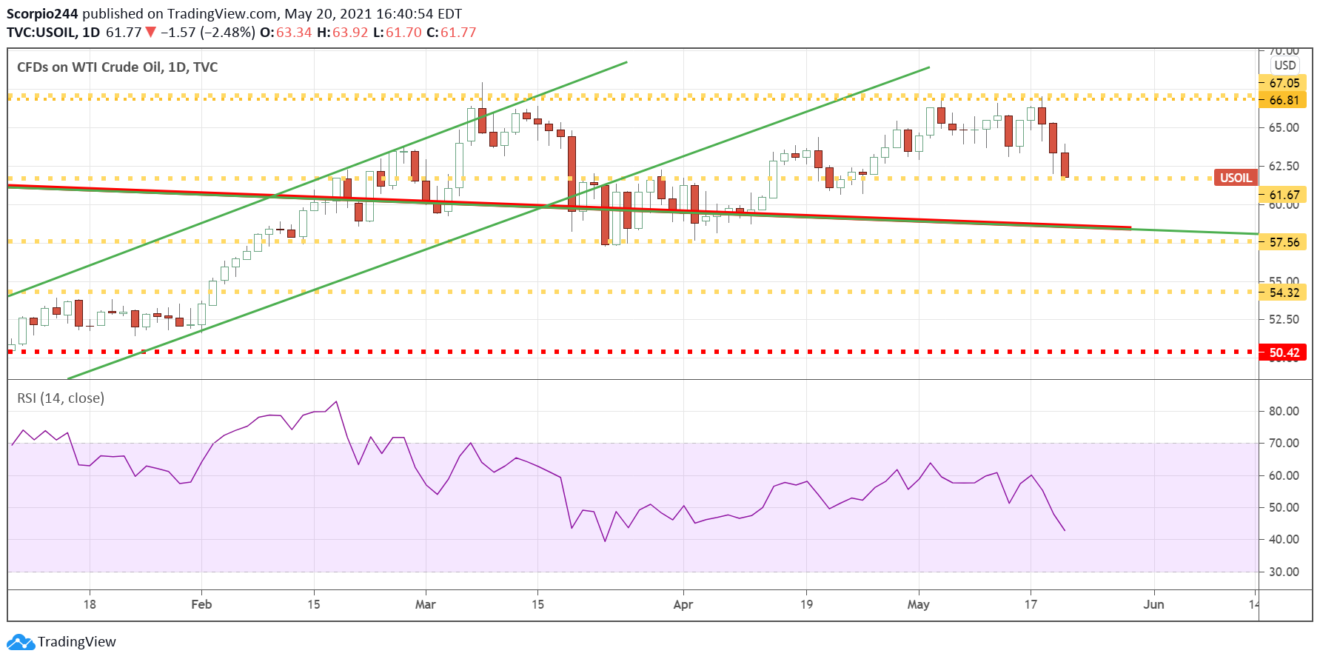
Add oil to the list of sentiment shifting asset classes. Today, it fell by 2.5%, closing at support at $61.70, and a break of that level can send it lower to 57.50.
Copper
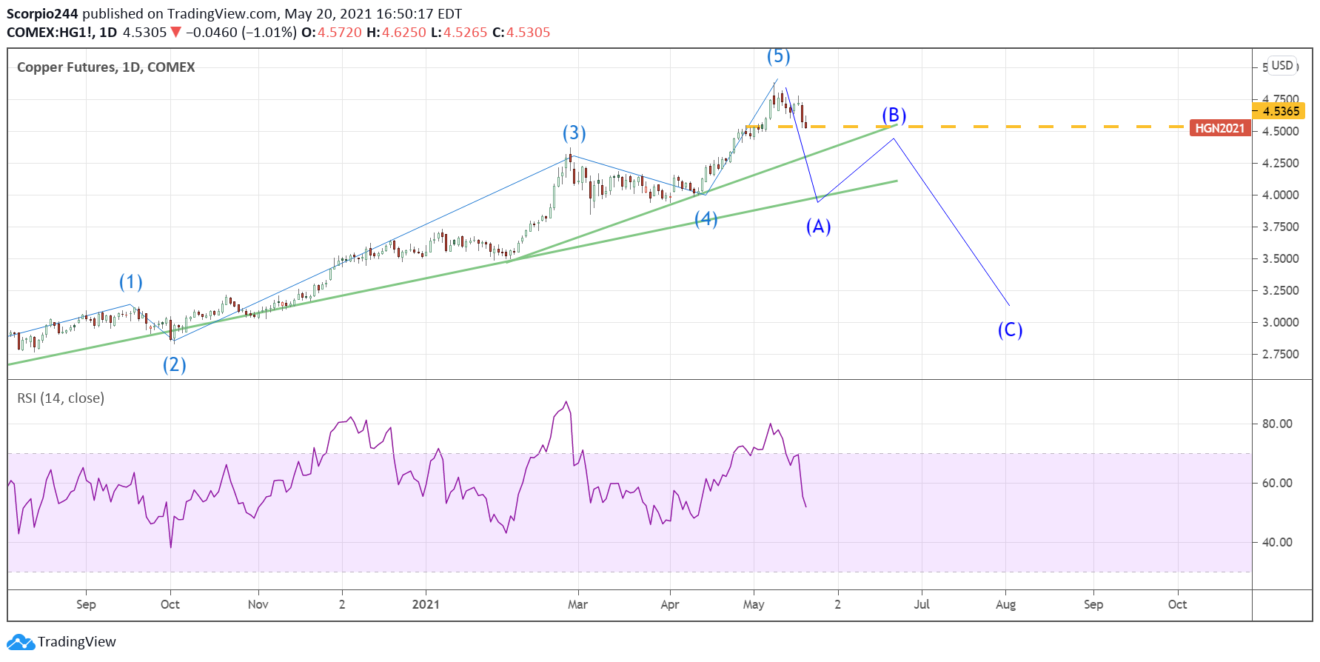
Copper had a weak day too, so couple that with oil and other commodities and the reflation trade may lose two of its most important pillars, in the energy and material sectors. The XLB and XLE are both looking weak, and unless the technology sector is coming back to life, then the S&P 500 will be left with just industrials and financials to lead the charge. Again, it is too early to call this either way, given the distortions in the market today.
Copper can find some support here, around $4.50, but I think it will break. China is going out of its way to try and control commodity prices to keep inflation from getting out of control.
Freeport
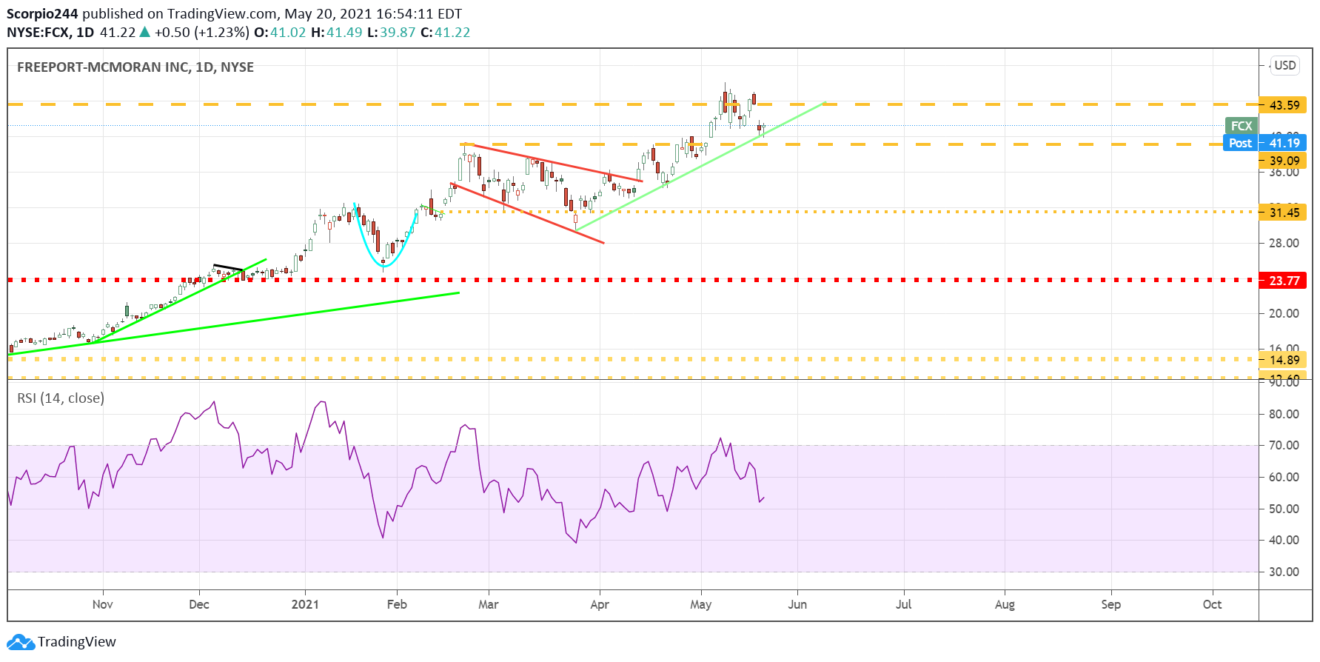
For now, Freeport (NYSE:FCX) is holding the uptrend, but I don’t see how Freeport’s stock doesn’t suffer if copper prices drop. A break of support at $39.30 will set up a steeper decline may be back to $31.50.
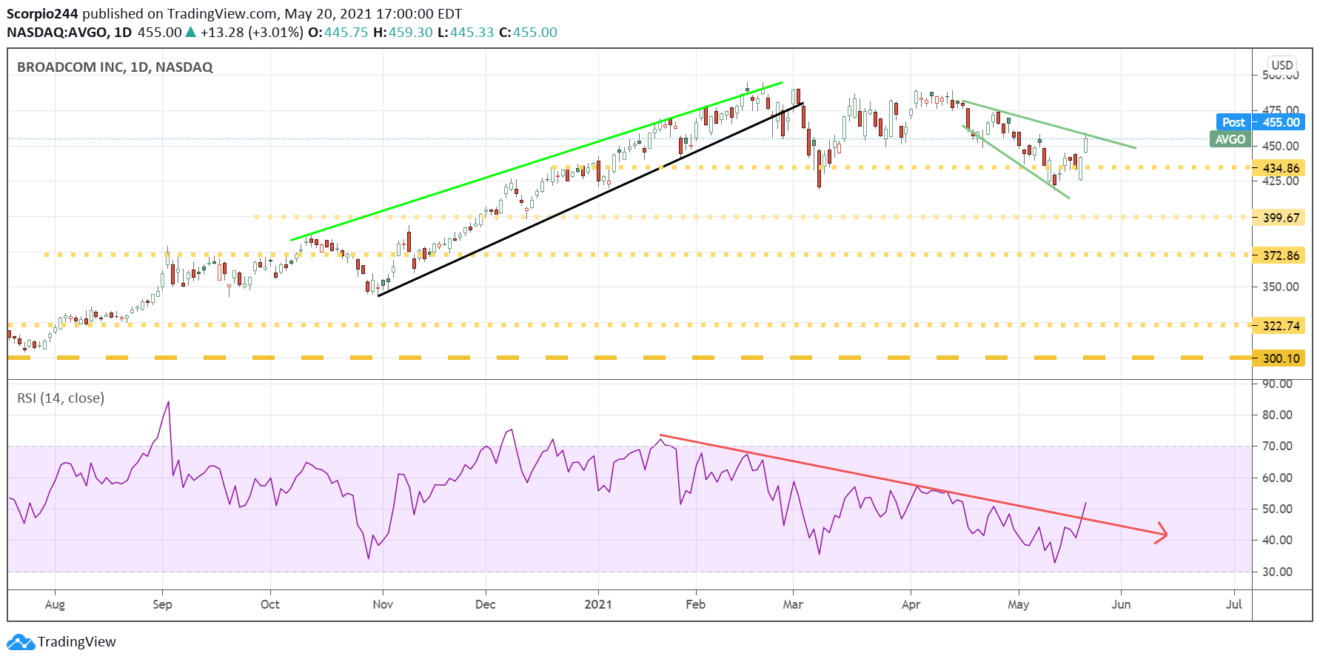
Broadcom
Broadcom (NASDAQ:AVGO) doesn’t look great, but it is possible; it broke the downtrend in its RSI today, which would be a positive. Again, I’d like to see some follow-through here before deciding if the pattern is bullish or not.
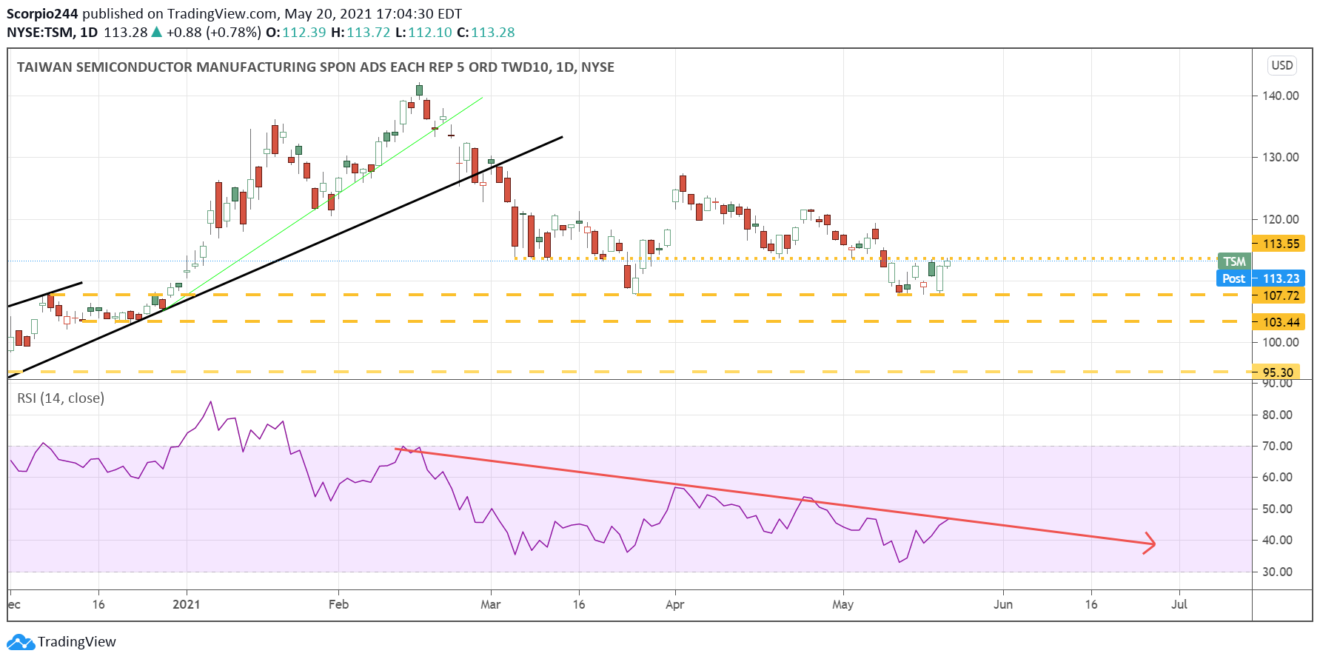
Taiwan Semi
Taiwan Semiconductor (NYSE:TSM) was held just below resistance at $114ish, but the picture doesn’t look much better. The RSI is still telling us that lower prices lie ahead.
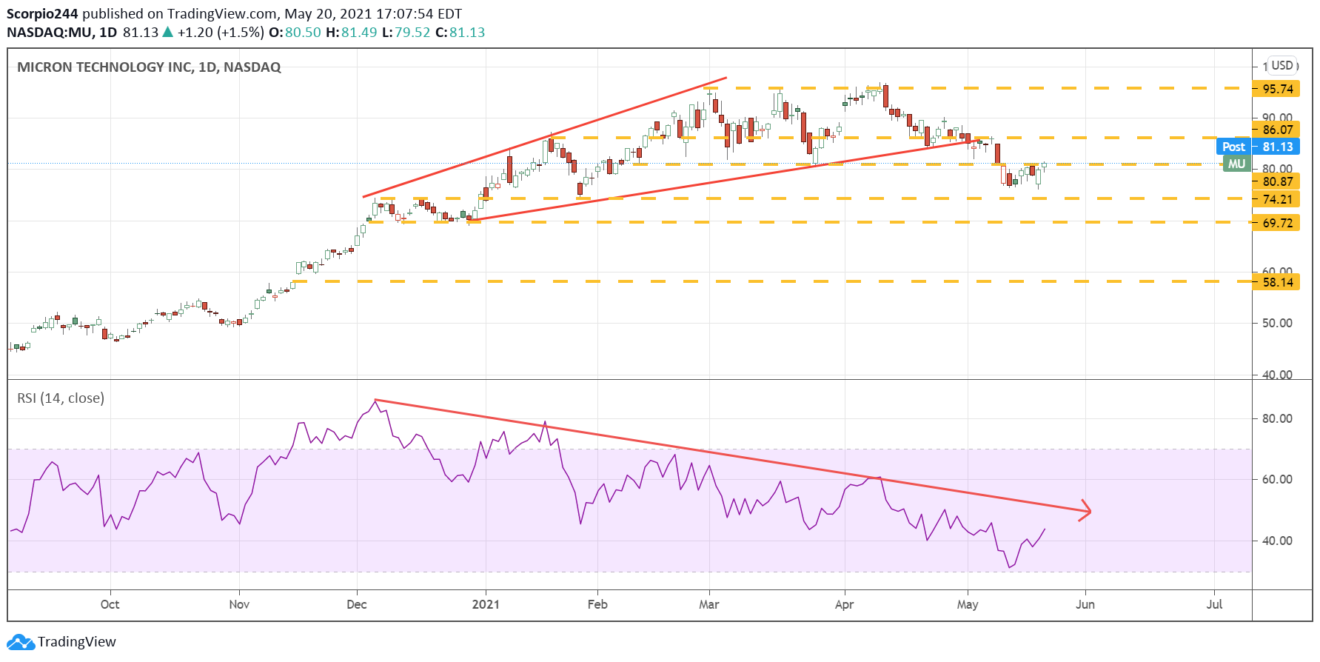
Micron
Micron Technology (NASDAQ:MU) tried, but still can’t get over resistance at $81.50, and the RSI is saying lower prices are coming.

