Stock’s Rise Yesterday, But The Technical Damage Has Been Done

Published 05/05/2020, 01:20 AM

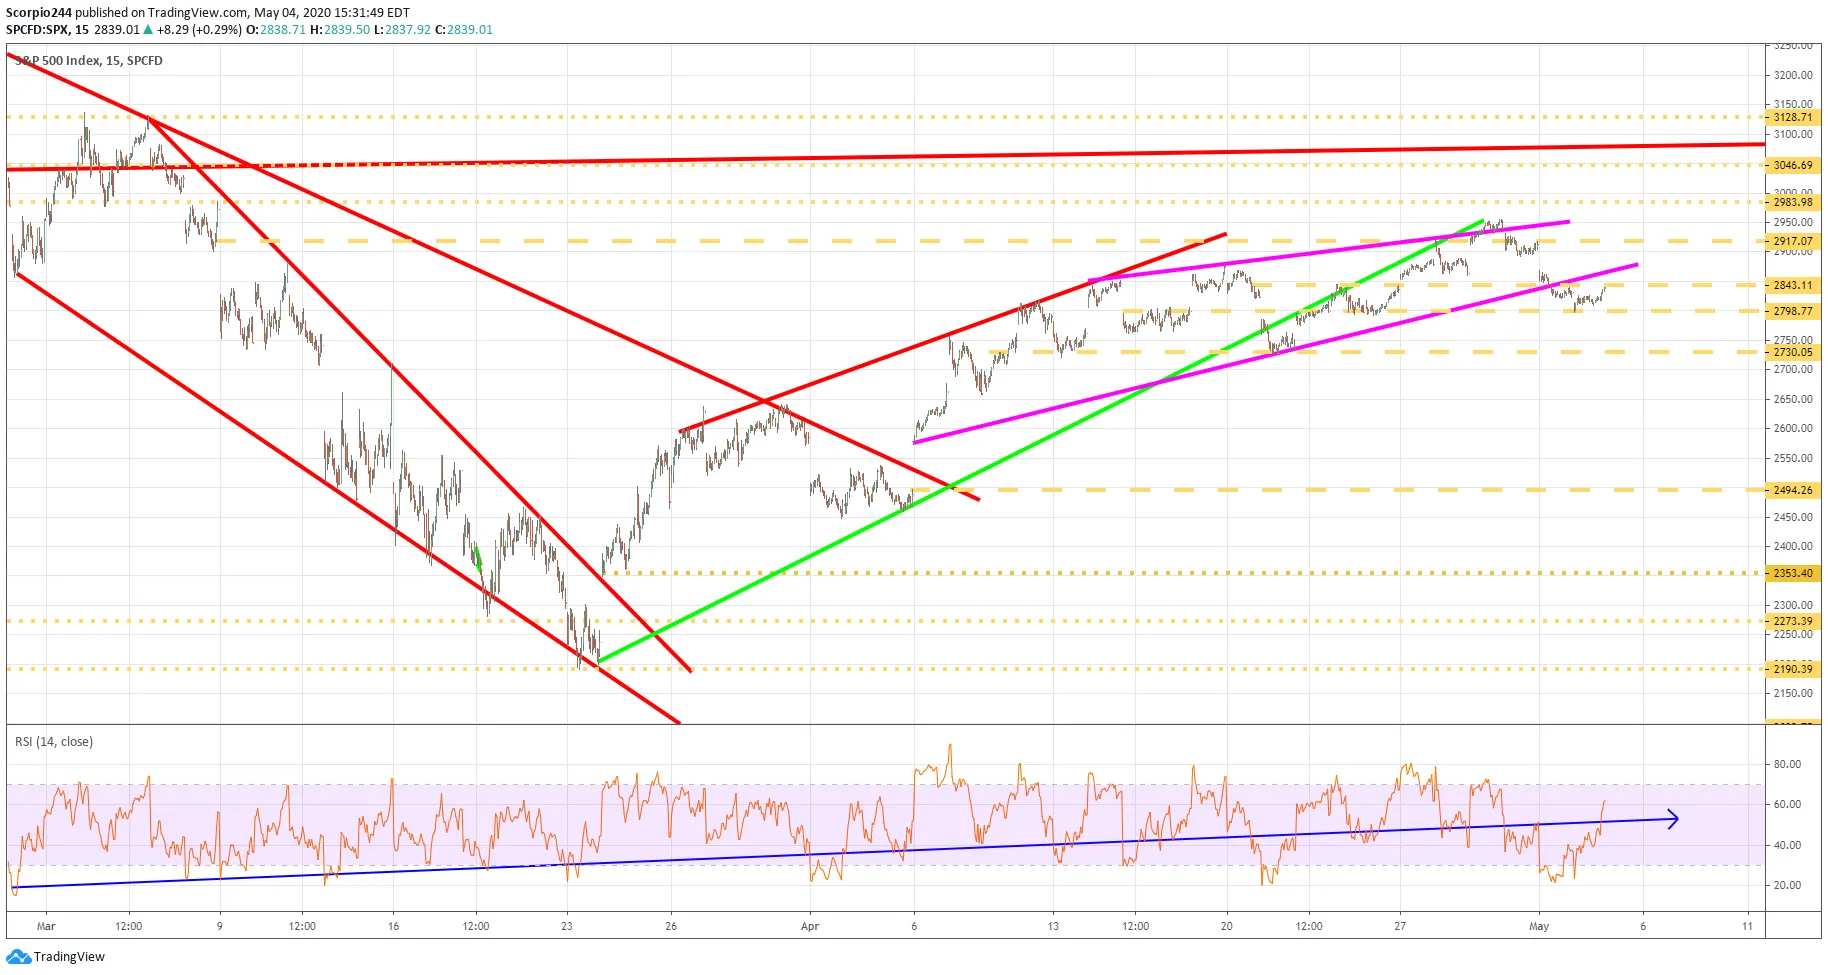
It was an incredibly dull day by the standards of the last two months. We gapped lower, filled the gap by mid-morning, and gradually drift higher to finish about 40 basis points up. The significant level of resistance lies at 2845, approximately where we closed. It doesn’t seem overly surprising to see that very little was accomplished yesterday, with a whole bunch of data on the horizon. There is very little that changed from a technical standpoint, and the charts, in my opinion, still point lower.

S&P 500 (SPY)

The technical damage done to the charts last week remains, and there simply was not enough yesterday to help with that repair. The level of support around 2800 remains the most critical level for this market, with a break starting what could be a cascading move lower.
S&P 500 Index

NASDAQ (QQQ)

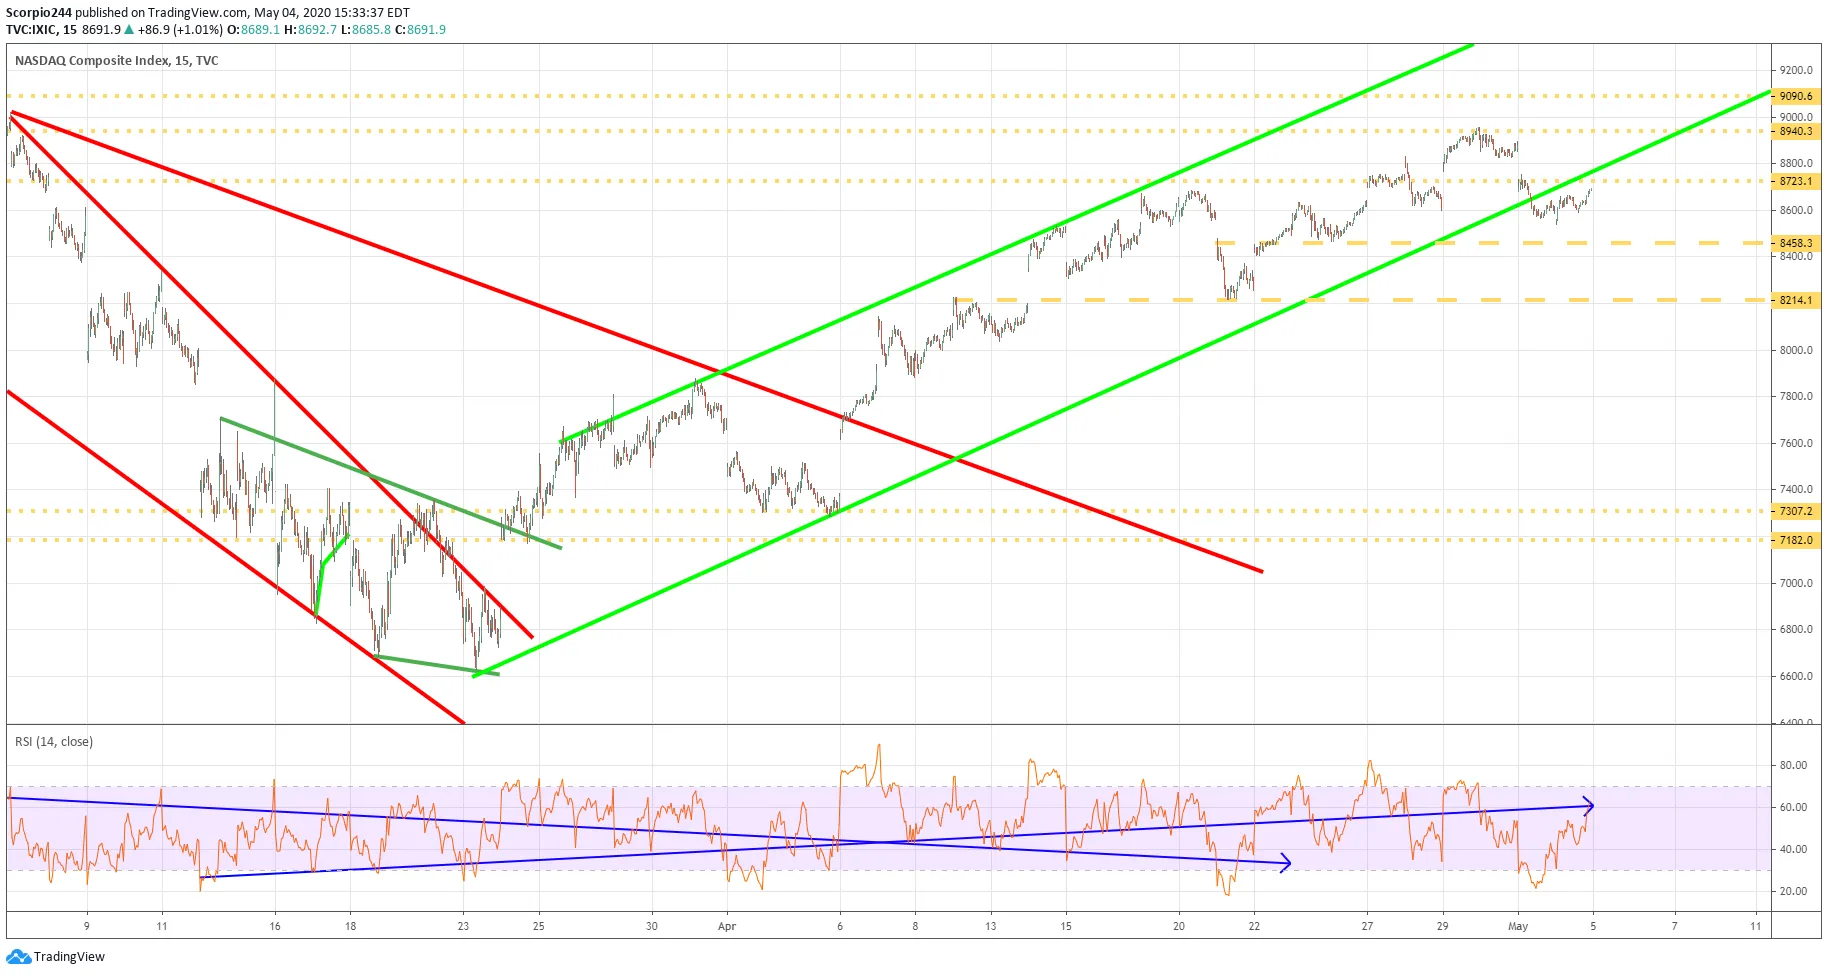
The same holds for the NASDAQ with a significant level of resistance at 8725, and support at 8450.
Nasdaq Corporate Index Chart

Russell (IWM)

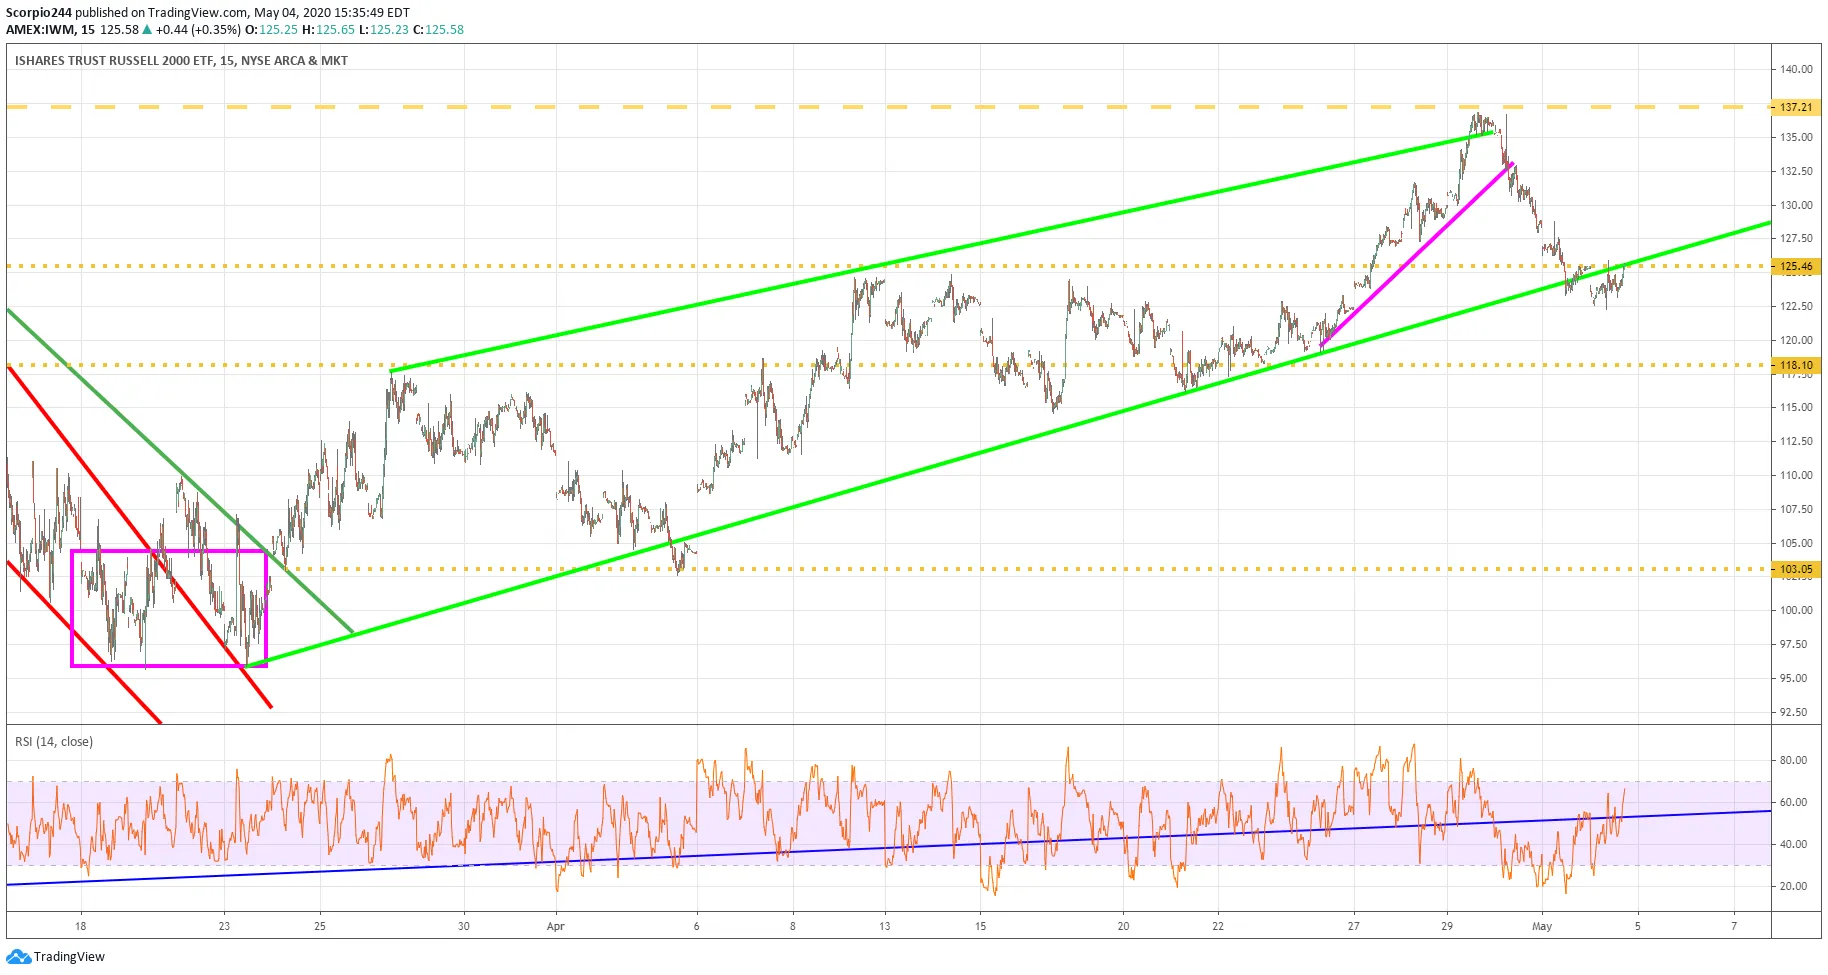
The same damage still holds for the Russell 2000 (NYSE:IWM) ETF, for which I still hold puts. For now, resistance remains at $126 and support at $118.10.
Ishares ETF Chart

AMD (AMD)

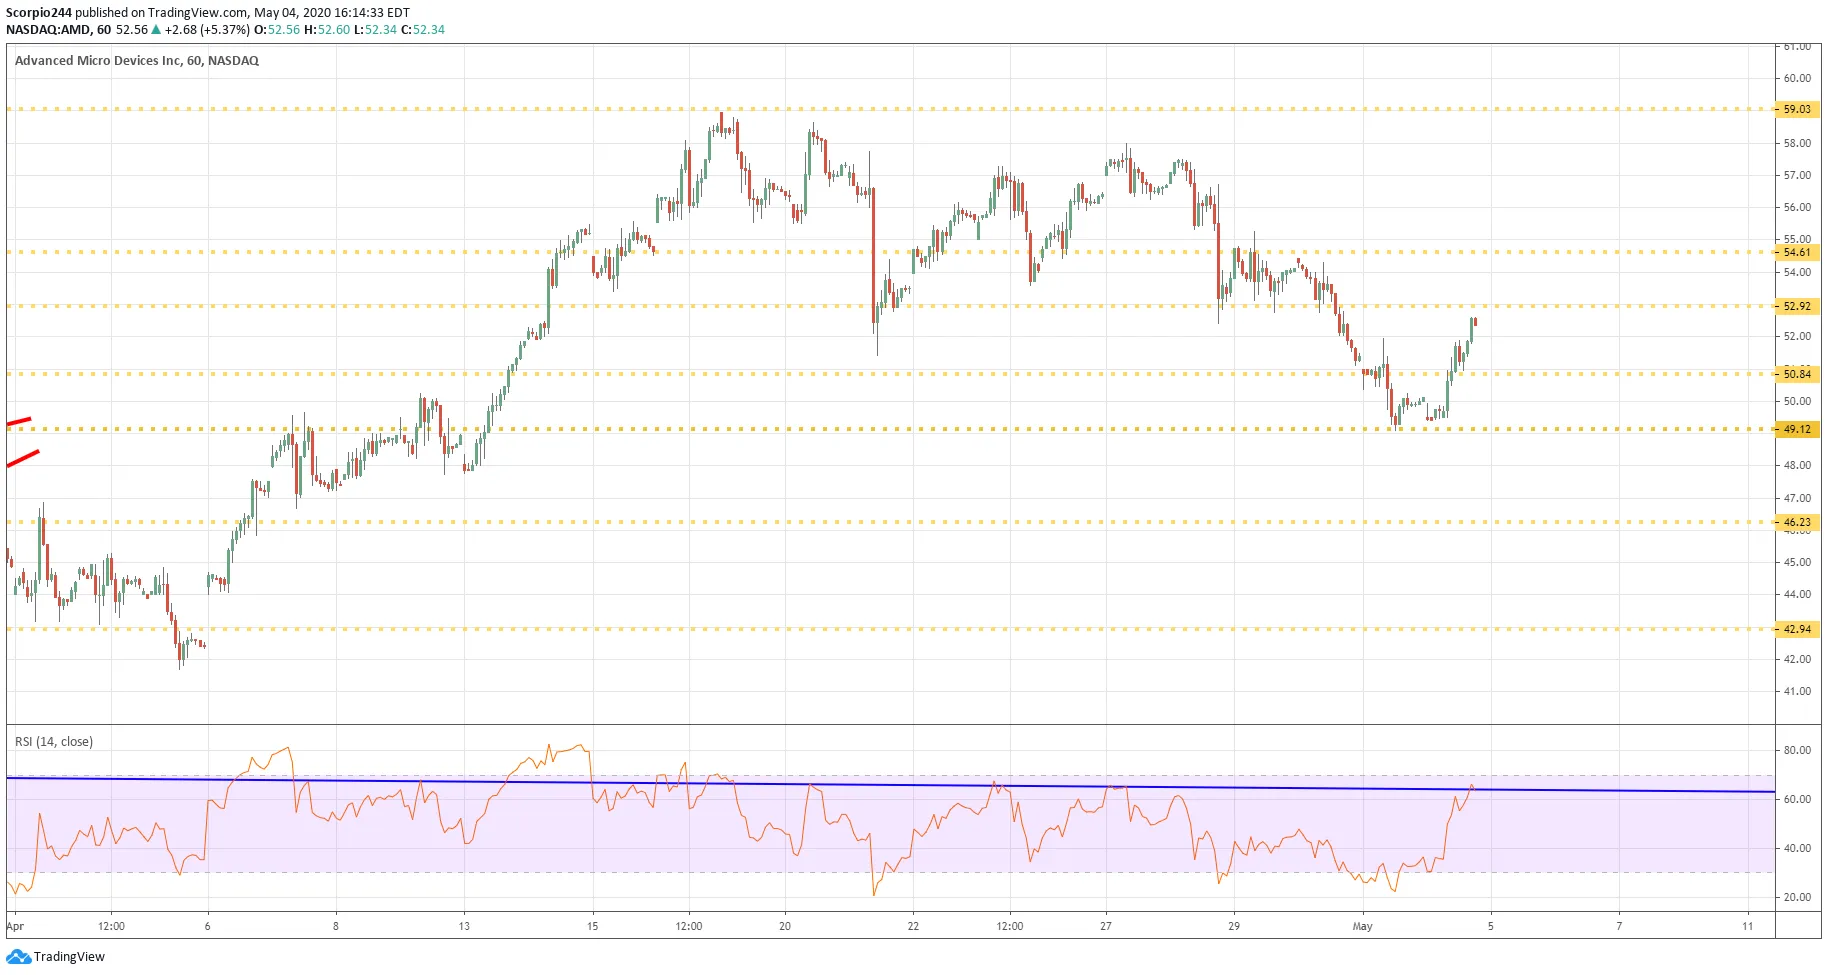
Advanced Micro Devices (NASDAQ:AMD) had a good day, but I think it fails when it reaches resistance at $52.90.
AMD Chart

JPMorgan (JPM)

The chart on JPMorgan Chase (NYSE:JPM) doesn’t precisely look inspiring, and sort of like a bear pennant. That would not be good for anyone if that is the case, with lower prices on the horizon. This one must be watched closely.
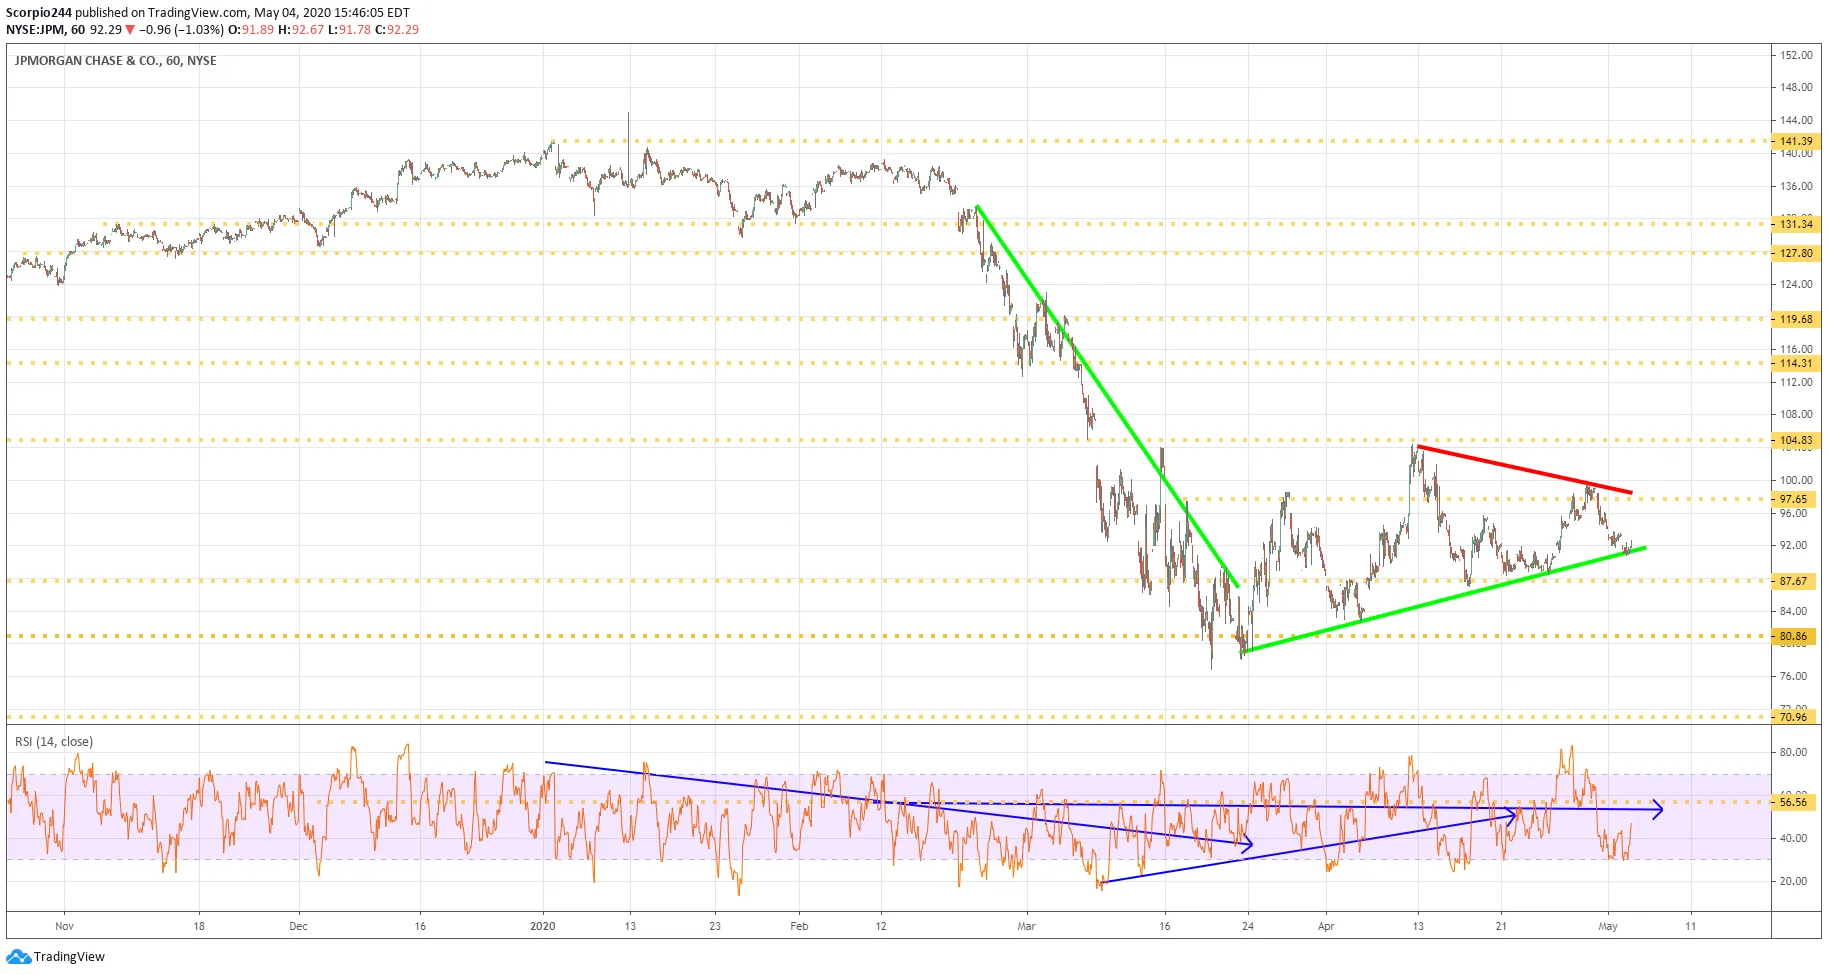
JPMorgan Chase Chart

Citigroup (C)

There is a similar bearish pattern also for Citigroup (NYSE:C).
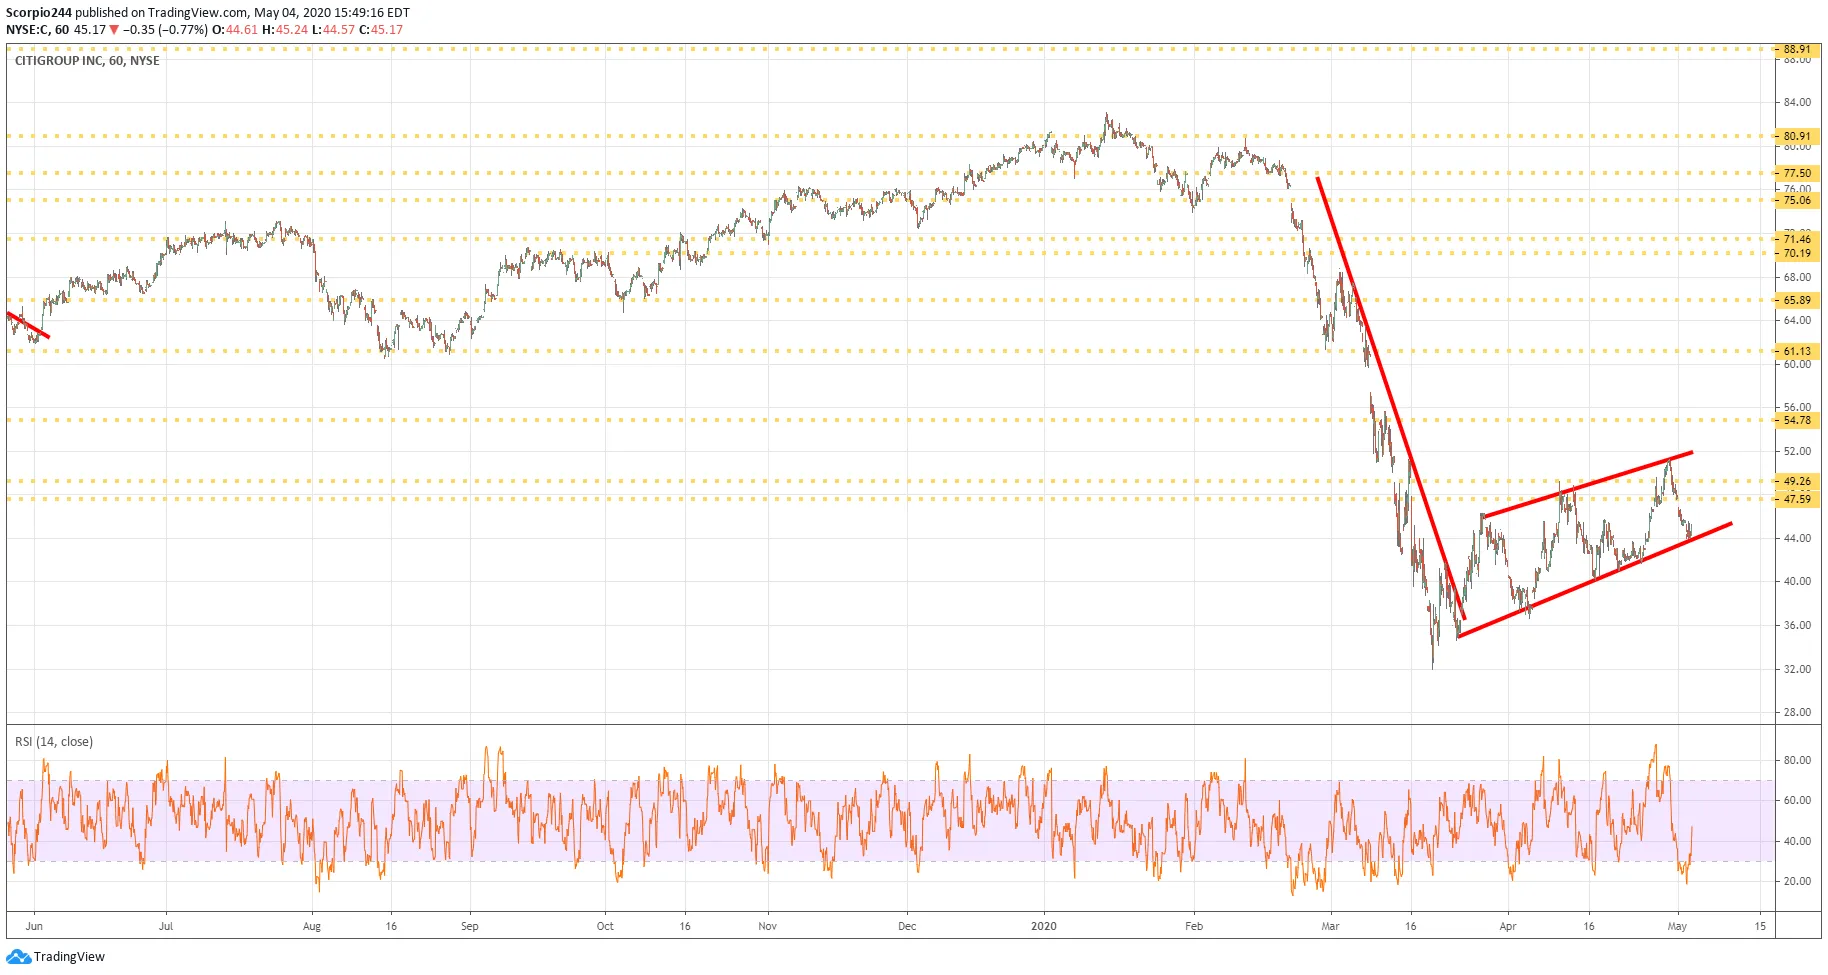
Citigroup Inc Chart

PayPal (PYPL)

I find it interesting how PayPal (NASDAQ:PYPL) is trading right back at its all-time highs, but yet none of the other processors are. I guess we will find out when they report results if the move higher is warranted. For it seems pretty clear where resistance is. You could even say the chart looks bullish.
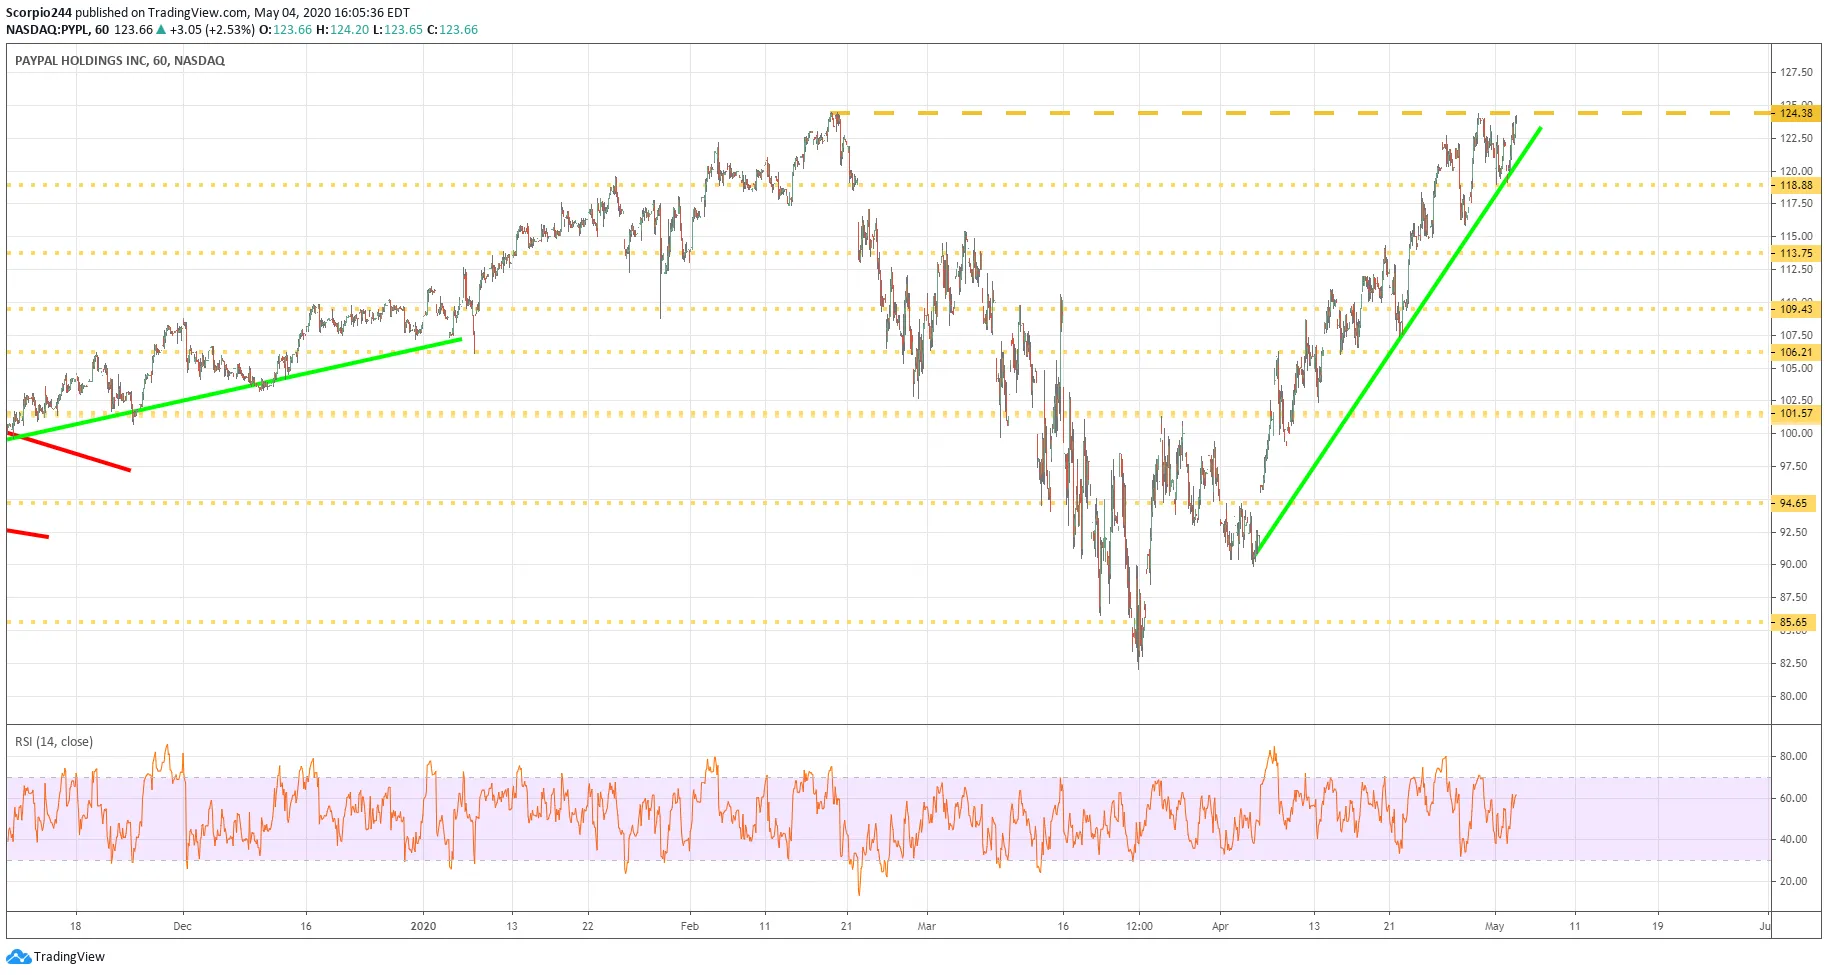
PayPal Chart

Original Post

Latest comments

Loading next article…
Risk Disclosure: Trading in financial instruments and/or cryptocurrencies involves high risks including the risk of losing some, or all, of your investment amount, and may not be suitable for all investors. Prices of cryptocurrencies are extremely volatile and may be affected by external factors such as financial, regulatory or political events. Trading on margin increases the financial risks.
Before deciding to trade in financial instrument or cryptocurrencies you should be fully informed of the risks and costs associated with trading the financial markets, carefully consider your investment objectives, level of experience, and risk appetite, and seek professional advice where needed.
Fusion Media would like to remind you that the data contained in this website is not necessarily real-time nor accurate. The data and prices on the website are not necessarily provided by any market or exchange, but may be provided by market makers, and so prices may not be accurate and may differ from the actual price at any given market, meaning prices are indicative and not appropriate for trading purposes. Fusion Media and any provider of the data contained in this website will not accept liability for any loss or damage as a result of your trading, or your reliance on the information contained within this website.
It is prohibited to use, store, reproduce, display, modify, transmit or distribute the data contained in this website without the explicit prior written permission of Fusion Media and/or the data provider. All intellectual property rights are reserved by the providers and/or the exchange providing the data contained in this website.
Fusion Media may be compensated by the advertisers that appear on the website, based on your interaction with the advertisements or advertisers.
© 2007-2025 - Fusion Media Limited. All Rights Reserved.