S&P 500 (SPY)
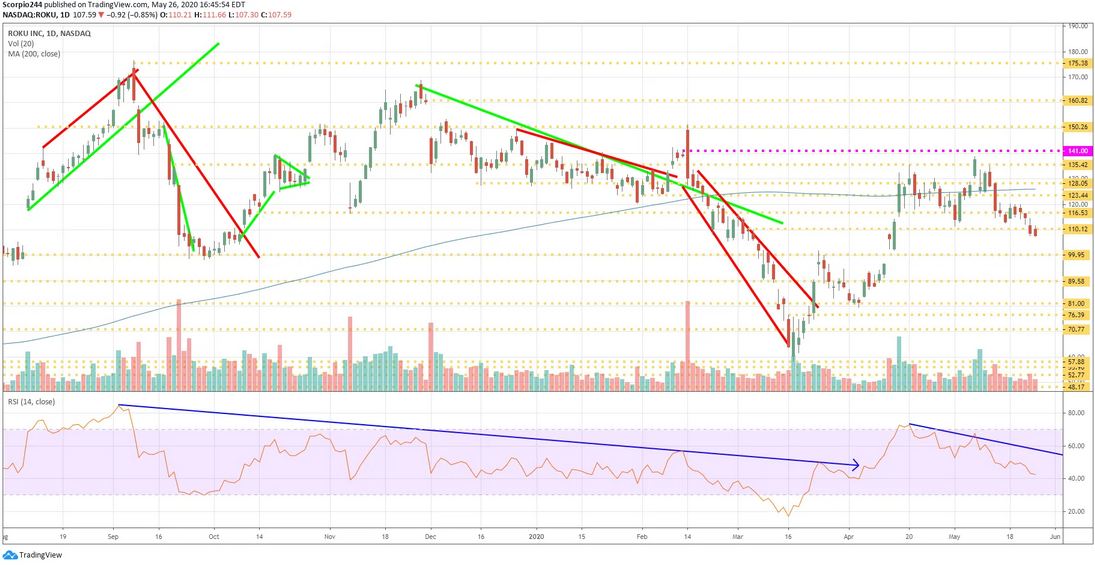
Stocks rallied sharply at least to start yesterday and then by days-end, it was a different story. Oh, the S&P 500 was still higher, but it gave back almost half its gains in the final 30 minutes when headlines on China popped up. It looks like as long as the market is going to allow Trump to be tough on China, he will be. So with the S&P 500 closing in on 3,000 now would be the time to step up the negative newsflow on China. This is the same thing we saw all last year.
The crazy thing is that the S&P 500 could fall 5%, and it would only be back to 2,860, which is where we were on May 15. So not much at stake if you are the President to look tough going into an election year. We could easily even fall to that level, and the uptrend would still also be in place. So really, until the point that uptrend on the S&P 500 is broken, the trend is higher.
Don’t get me wrong, the move higher isn’t justified, because the market is trading at 19.3 times 2021 earnings estimates of $155.29 according to data from Refintiv.
NASDAQ 100 ETF (QQQ)
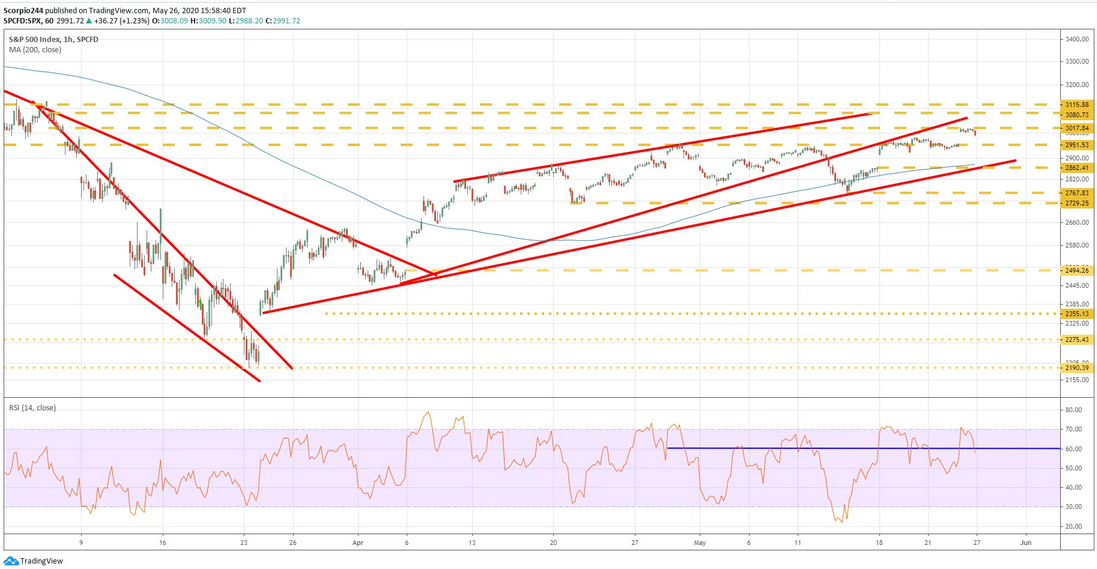
The QQQ finished the day lower by about 20 basis points, and it once again touched the upper end of resistance and failed. As I noted in the midday commentary, as long as the $229 level holds, all should be ok. But a break of $229 likely sends the Qs to the lower end of the trading range at $223.
VIX
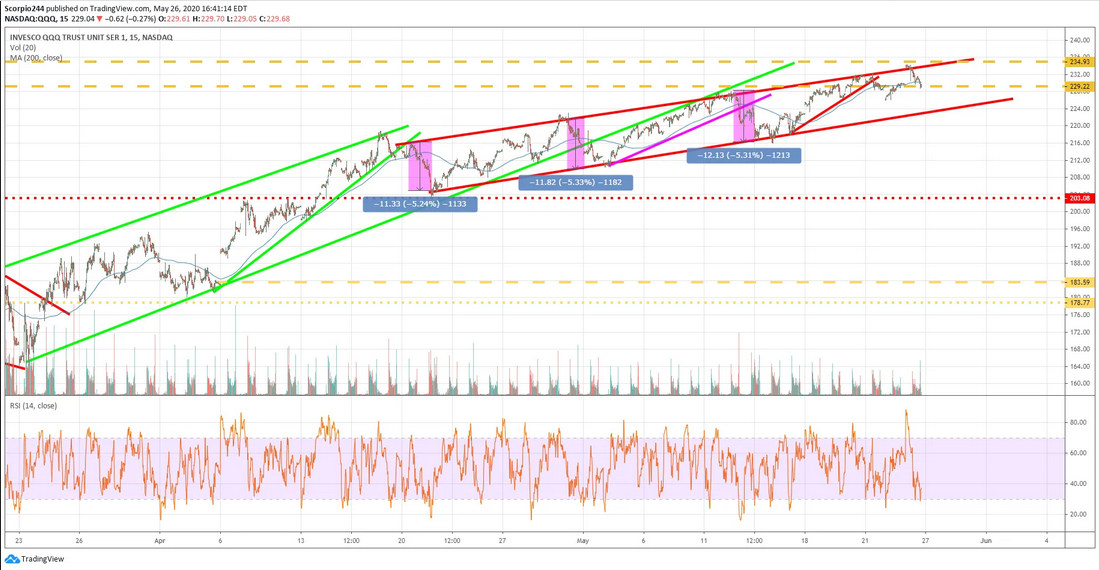
The VIX actually moved higher Tuesday.
Health Care (XLV)
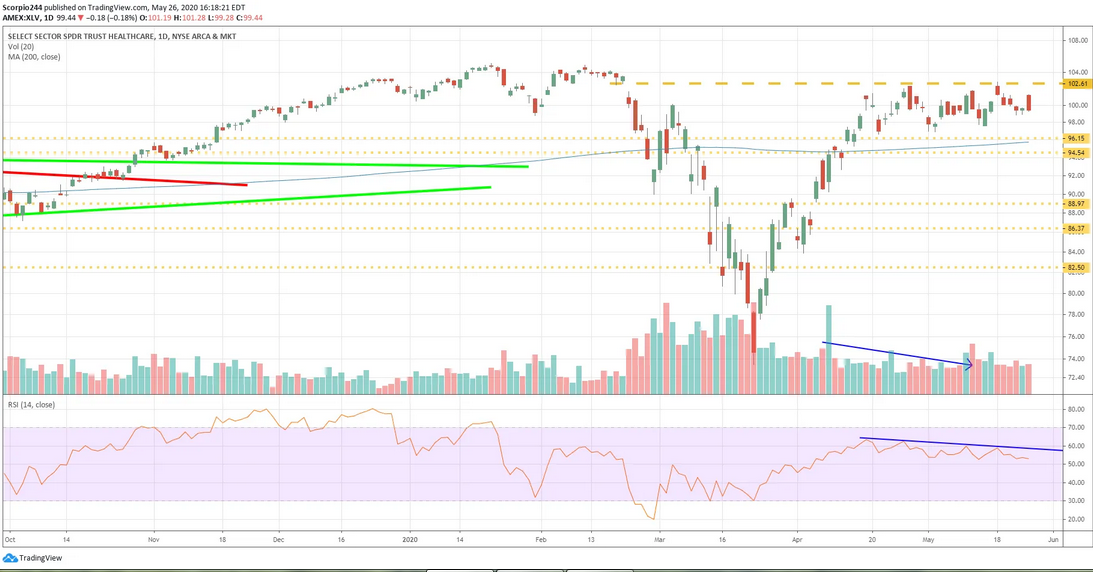
Health Care didn’t have the most fabulous day, falling by about 20 basis points. This group has been dead since April 16. Just look at that sideways price action. The RSI is saying the index still has further to fall. Remember, health care and tech are an enormous part of the S&P 500, 41%.
Financials ETF (XLF)
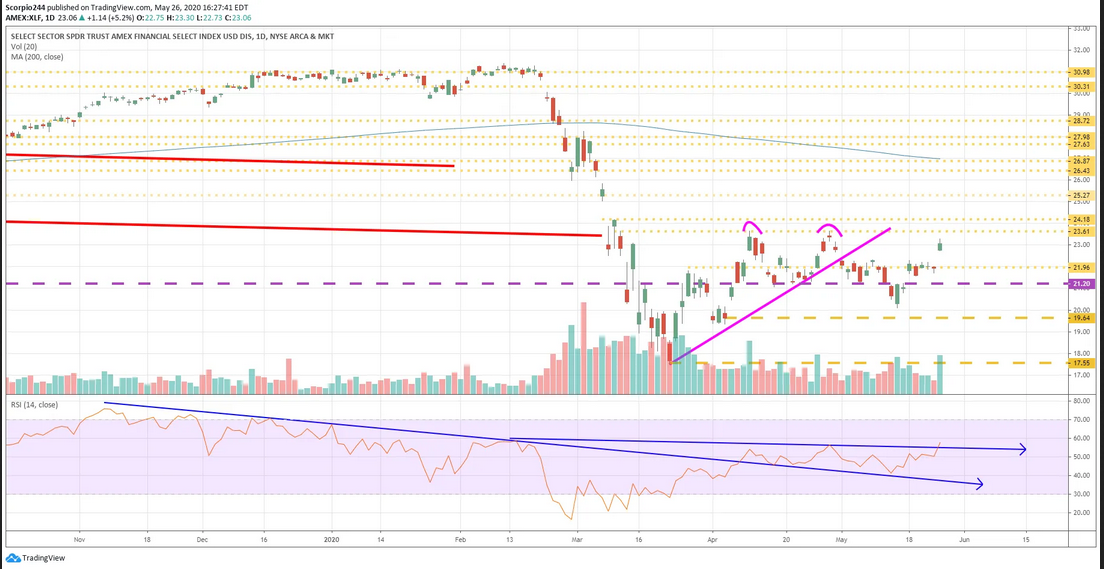
Banks had a great day, with the financial XLF ETF rising by 5.5%. A good portion of this had to be short-covering. Plus, it didn’t hurt that Jamie Dimon was making some positive comments at a conference today. At this point, it looks like the double top is off the table for the XLF, but the XLF still needs to clear resistance at $23.60 to make today’s rally stick.
JPMorgan (JPM)
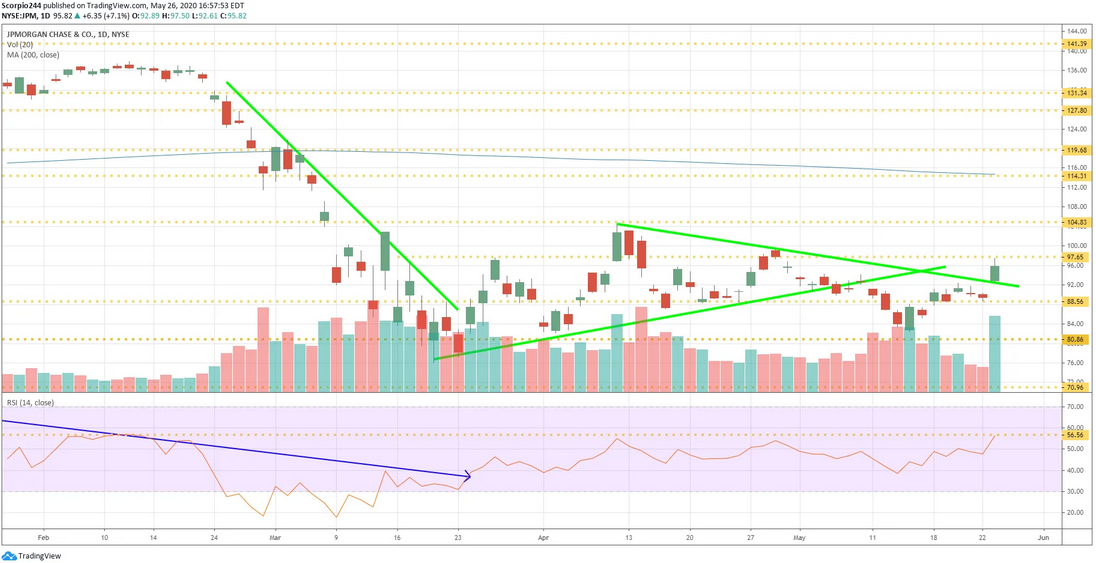
Speaking of JPMorgan (NYSE:JPM), volume was tremendous today; the only problem is that the stock failed at resistance $97.60. So we have to wait until tomorrow to see if it can push even higher and hold the breakout. The RSI also failed at resistance today.
Netflix (NFLX)
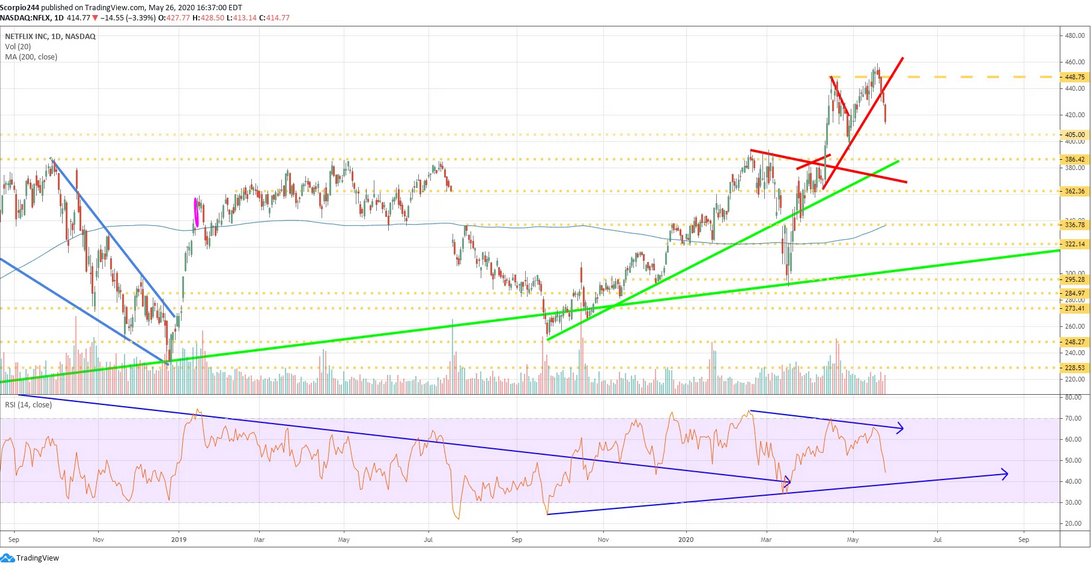
Momentum has shifted in Netflix (NASDAQ:NFLX), with the stock breaking the uptrend, and the RSI starting to fall quickly. The big question will be when the RSI gets to 40, will the stock bounce and resume its uptrend, or will break and start a new downtrend. For now, $405 may prove to be a critical level of support for the stock.
Amazon (AMZN)
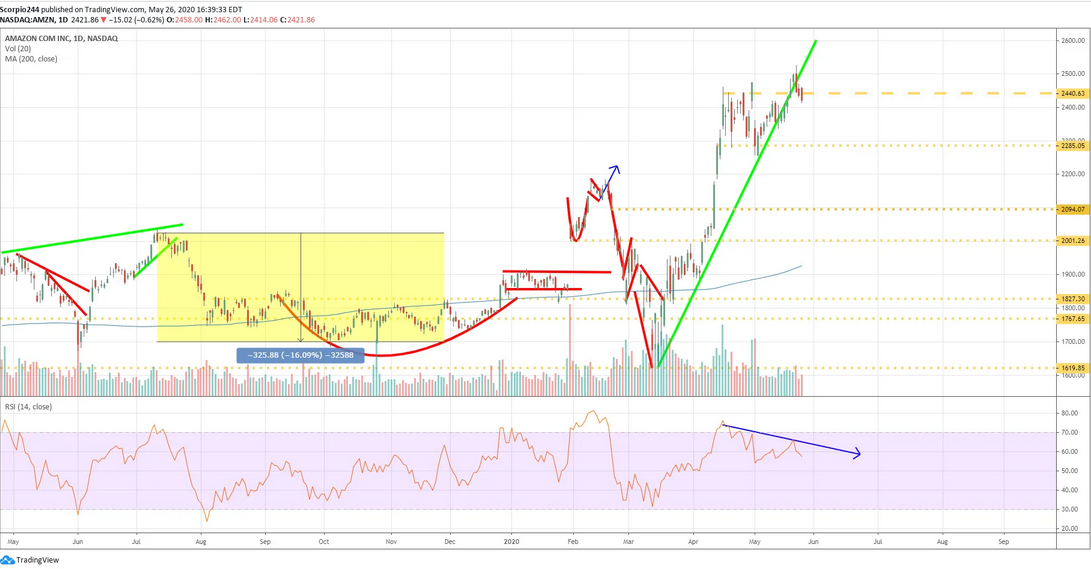
Amazon (NASDAQ:AMZN) may be right behind Netflix, with a very similar setup, again, for now, Amazon could be heading back to $2285.
Facebook (FB)
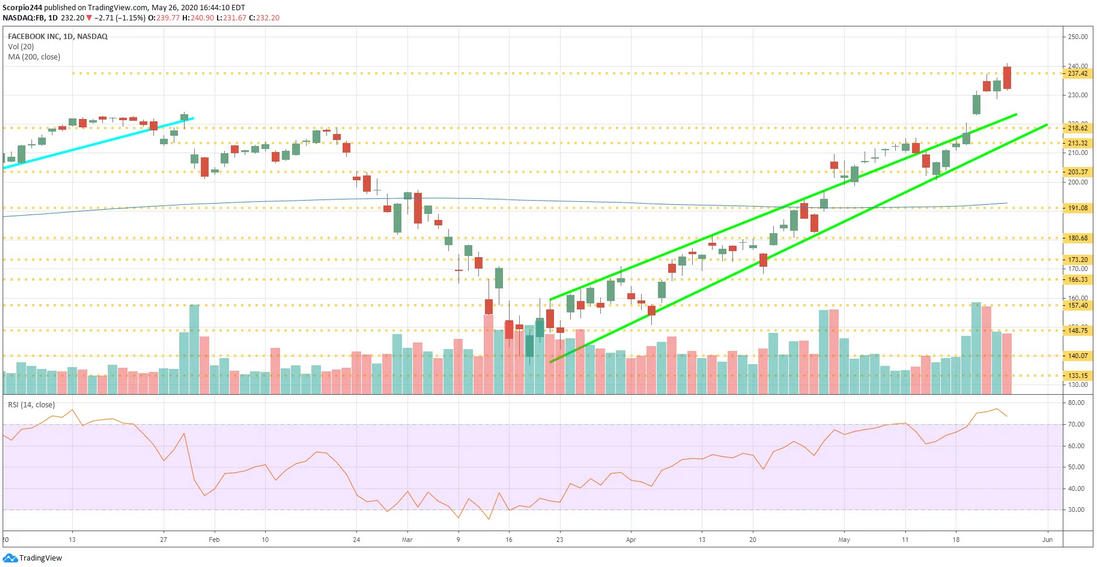
Even with today’s decline, Facebook (NASDAQ:FB) is overbought. I have been thinking this stock could fall to $191; I just think it could first go to $237 on its way to $191. Anyway, such is life.
Roku (ROKU)
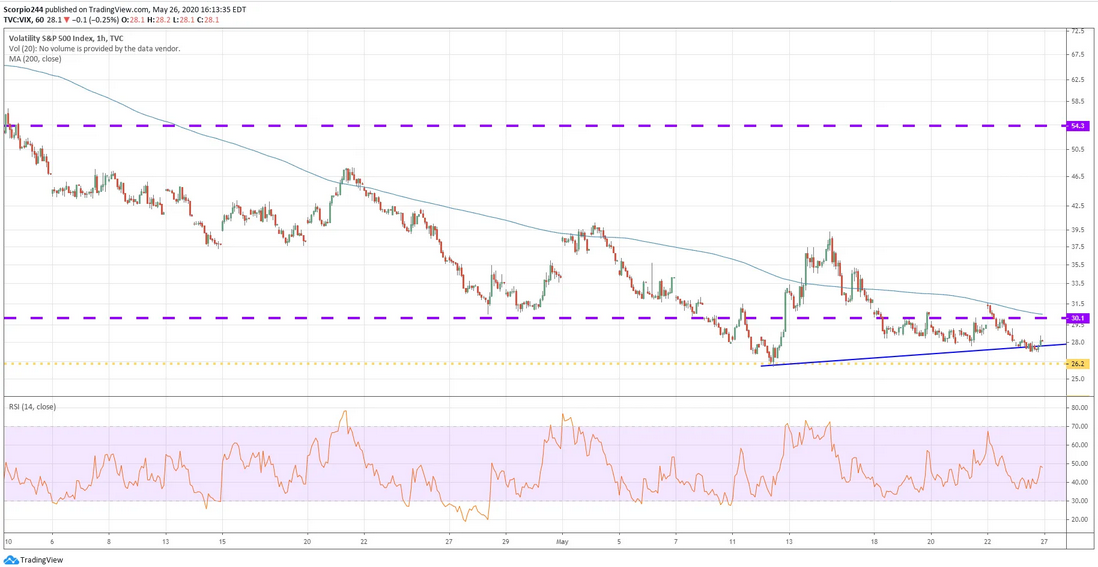
The case for Roku (NASDAQ:ROKU) falling to $99 appears to be picking up steam, just look at the downtrend in that RSI.
