S&P 500 (SPY)
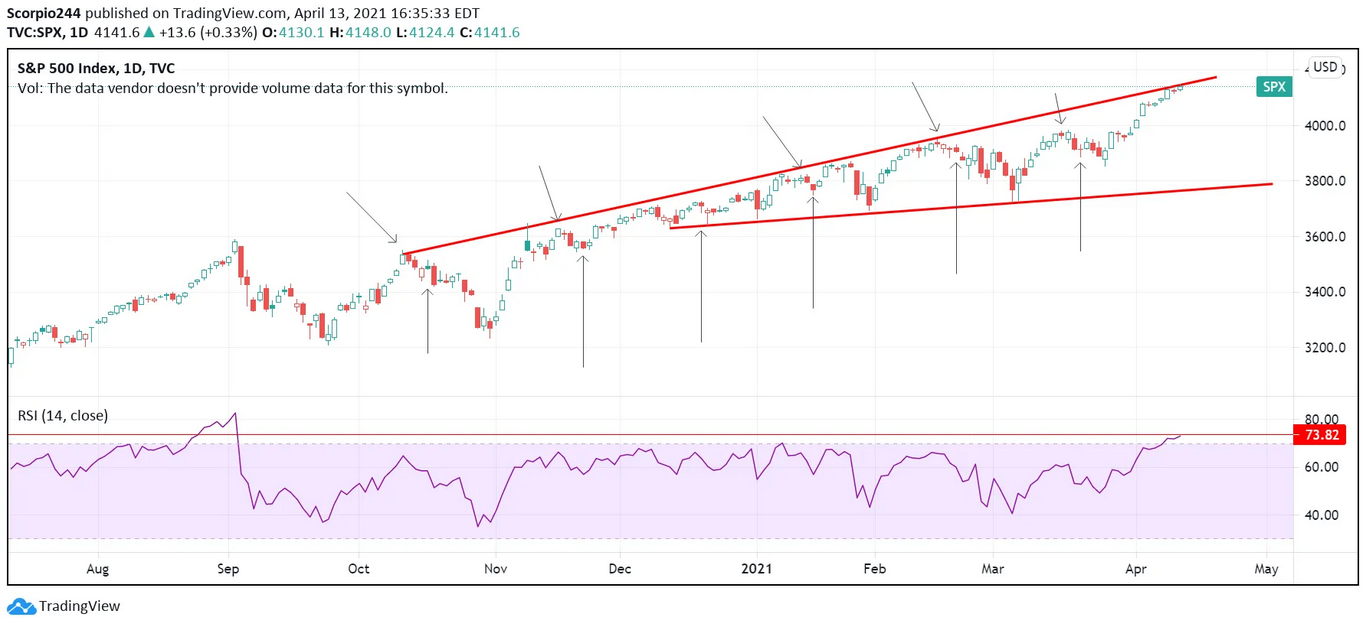
Stocks moved higher Tuesday, mostly thanks to Apple (NASDAQ:AAPL) and Tesla (NASDAQ:TSLA), which accounted for a majority of the broader S&P 500 gain of about 30 bps, to finish around 4,140. Again, this region around 4,130 has a lot of technical resistance, coupled with an RSI that is now at 73, and the S&P 500 is screaming overbought.
What makes this setup worse is that the Options expiration is on Friday. Looking back, since October, the S&P 500 has generally run up into options expiration and peaked 2 to 3 days before the expiration date. That would mean that we should expect to see stocks turn lower, starting today.
The only month this did not happen was in December. We also know that the period after options expiration witnesses increasing amounts of volatility, so one should not get lulled to sleep by the S&P 500 recent hot streak.
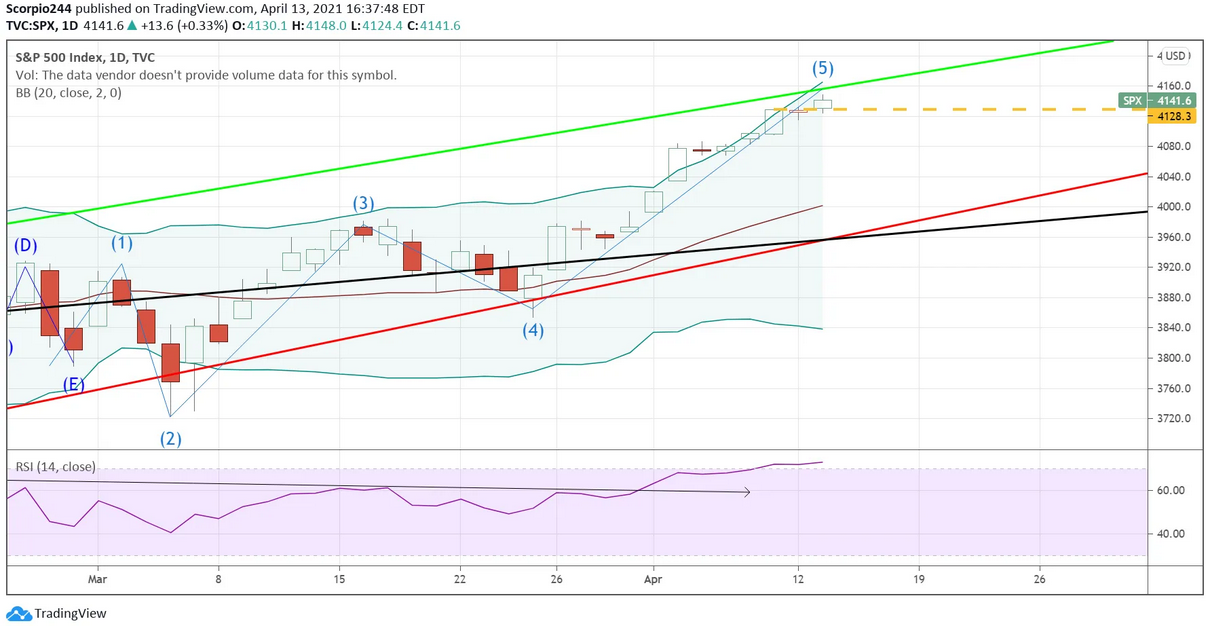
I still contend that the S&P 500 will fall back to 3,960 and fill the gap going back to Mar. 31. It doesn’t mean it is happening tomorrow or Friday, but over the next one to two weeks is my general feeling.
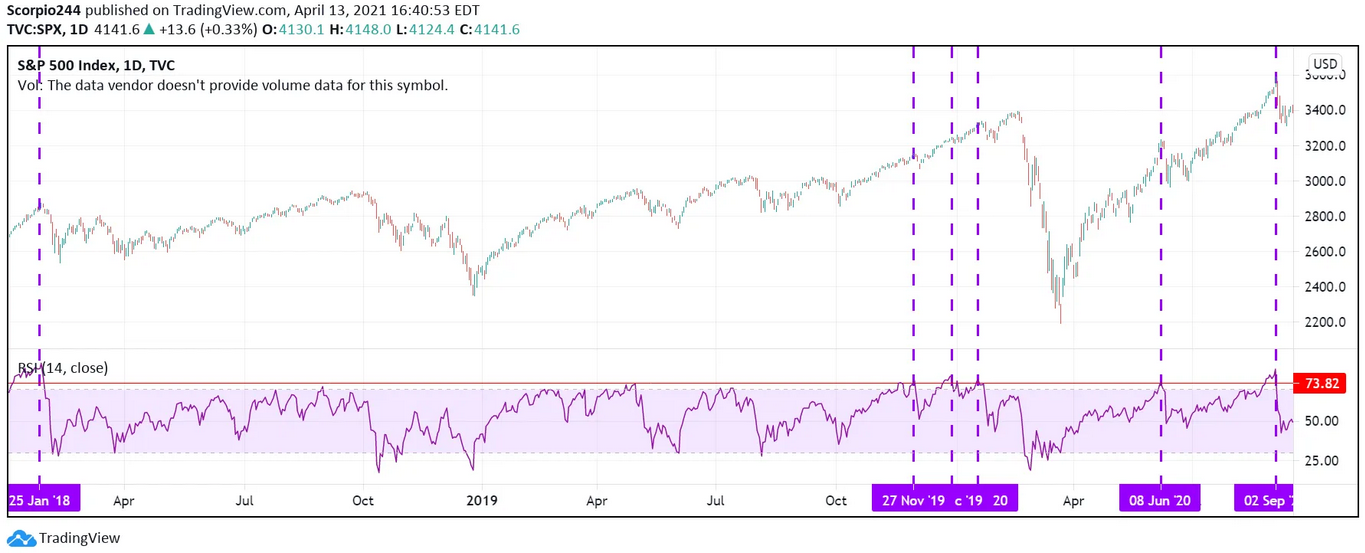
Looking back, a high percentage of times when the S&P 500 did hit a reading over 73 on the RSI, it did pull back. The depth and length have varied, but in some cases, the declines have been steep.
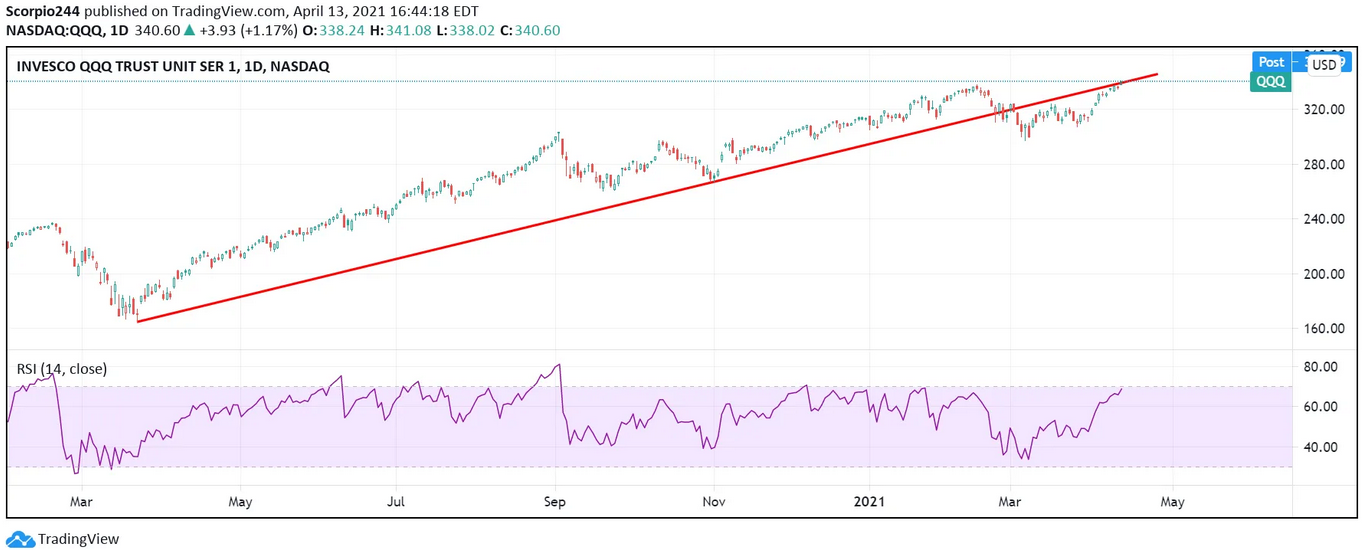
NASDAQ Qs
Additionally, the Invesco QQQ Trust (NASDAQ:QQQ) was hitting against the upper end of its March 2020 uptrend. This is an area that should offer plenty of resistance. Sometimes—not all the time—it can be a retest of the breakdown of the previous uptrend.
In this case, it could suggest that significantly lower prices will follow. As of right now, it is way too soon to make a call like that, but given the data point shown above, it certainly seems like a reasonable spot in this current rally to end.
Apple
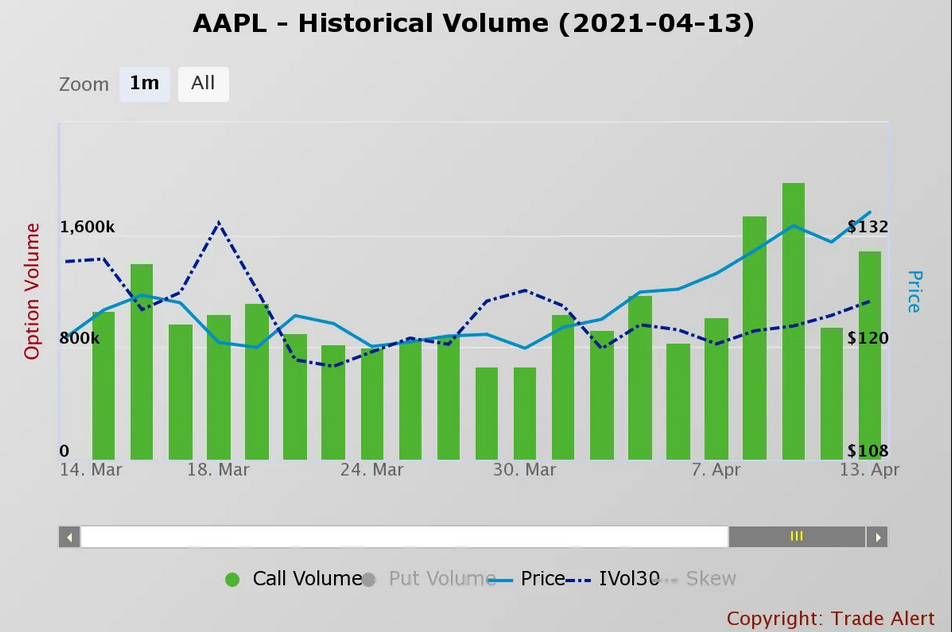
Meanwhile, Apple rose about 2.5% on Tuesday, and whether the stock is running up ahead of earnings next week, tough to say. But call volume in Apple is picking up, and so is implied volatility. This is what we have seen historically during gamma squeezes, which is likely what is now taking place in Apple.
Most of the options traded on Tuesday expire this week, so the stock rally could fade very quickly. The $135 calls were the most active, so with the stock trading at $134.40, the calls could start losing value quickly if the stock doesn’t get over $135 early today. That means market makers will go from being buyers of Apple’s stock to hedge against their short call positions to unwinding by selling Apple’s stock.
Tesla
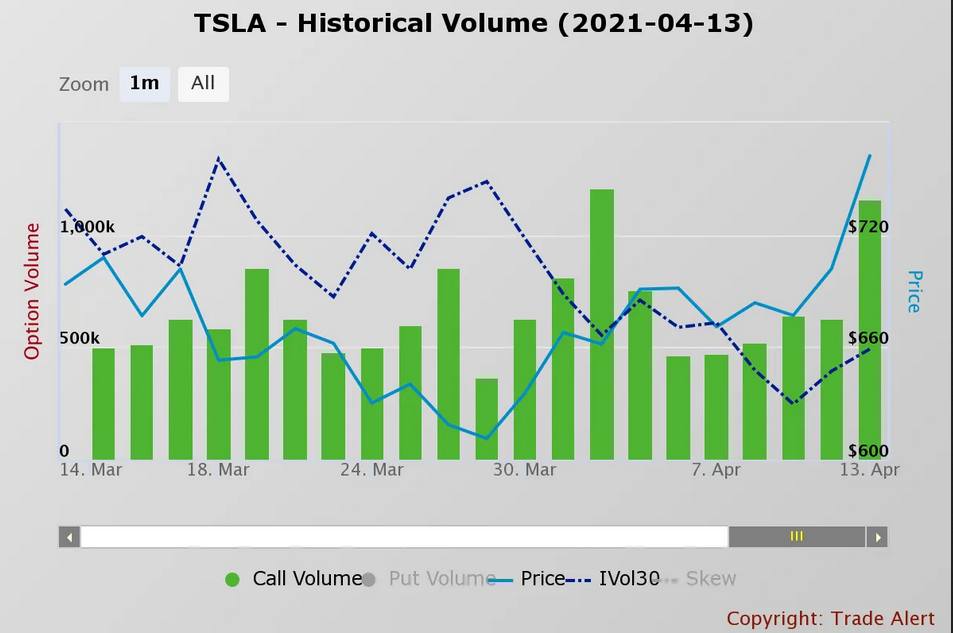
The same thing happened in Tesla. Yesterday, the most active calls were the Apr. 16 $750 and $800 strike prices. Tesla was at $762ish, so if Tesla doesn’t hold above $750, we could quickly see the same unwind happen in Tesla over the next few days, meaning market makers start selling the stock to unwind hedges.
It is fine to play the game; just make sure what game your playing.
