Stocks Remain Resilient And Will Likely Move Higher

Published 02/19/2020, 03:32 AM
Updated 11/16/2024, 07:53 AM
US500
-
AAPL
-
ESH25
-
NFLX
-
SWKS
-
BABA
-
PINS
-

S&P 500 (SPY)

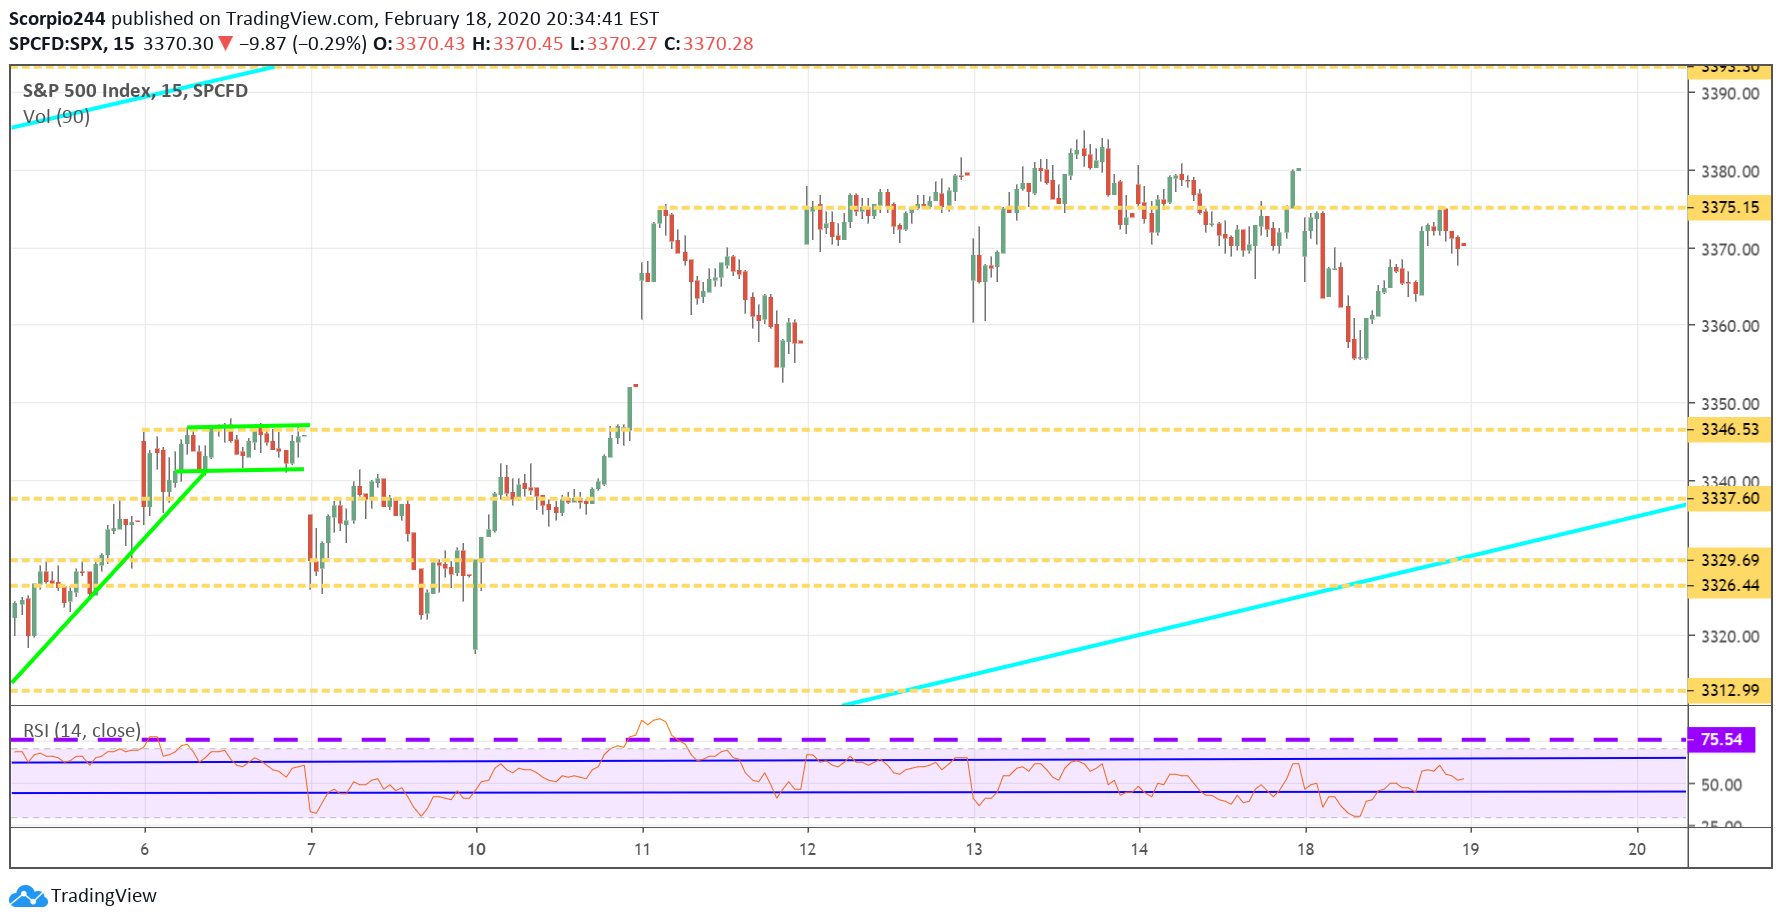
Stocks fell yesterday as expected, but the S&P 500 managed to drop less than 30 basis points to finish lower at 3,370. The SPX managed to drop to around 3,355, and it found a bounce eventually climbing back to 3,375, not entirely closing the gap, but pretty close.

It means that the trend for the market hasn’t changed. I think it means we keep grindin’ higher!
S&P 500 Chart

ES Minis

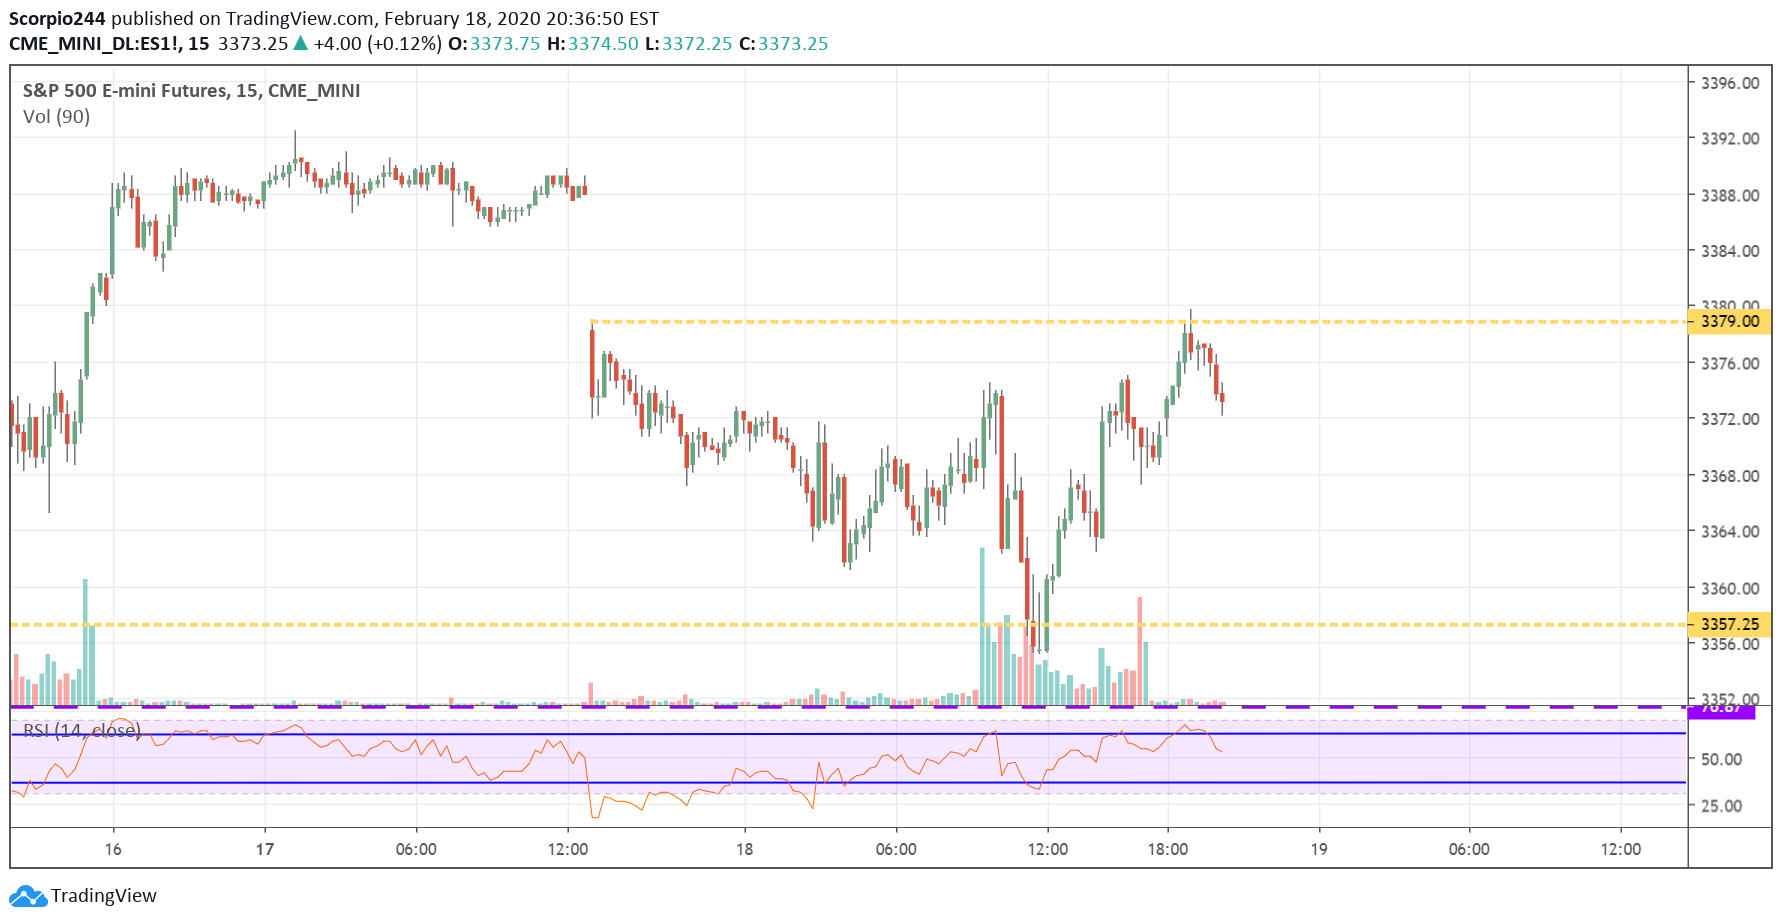
The S&P 500 Futures climbed to a high of 3,379 at 7 PM on Tuesday evening, but then turned lower. So this appears to be the region to watch for now.
S&P 500 Emini Futures Chart

Biotech (XBI)

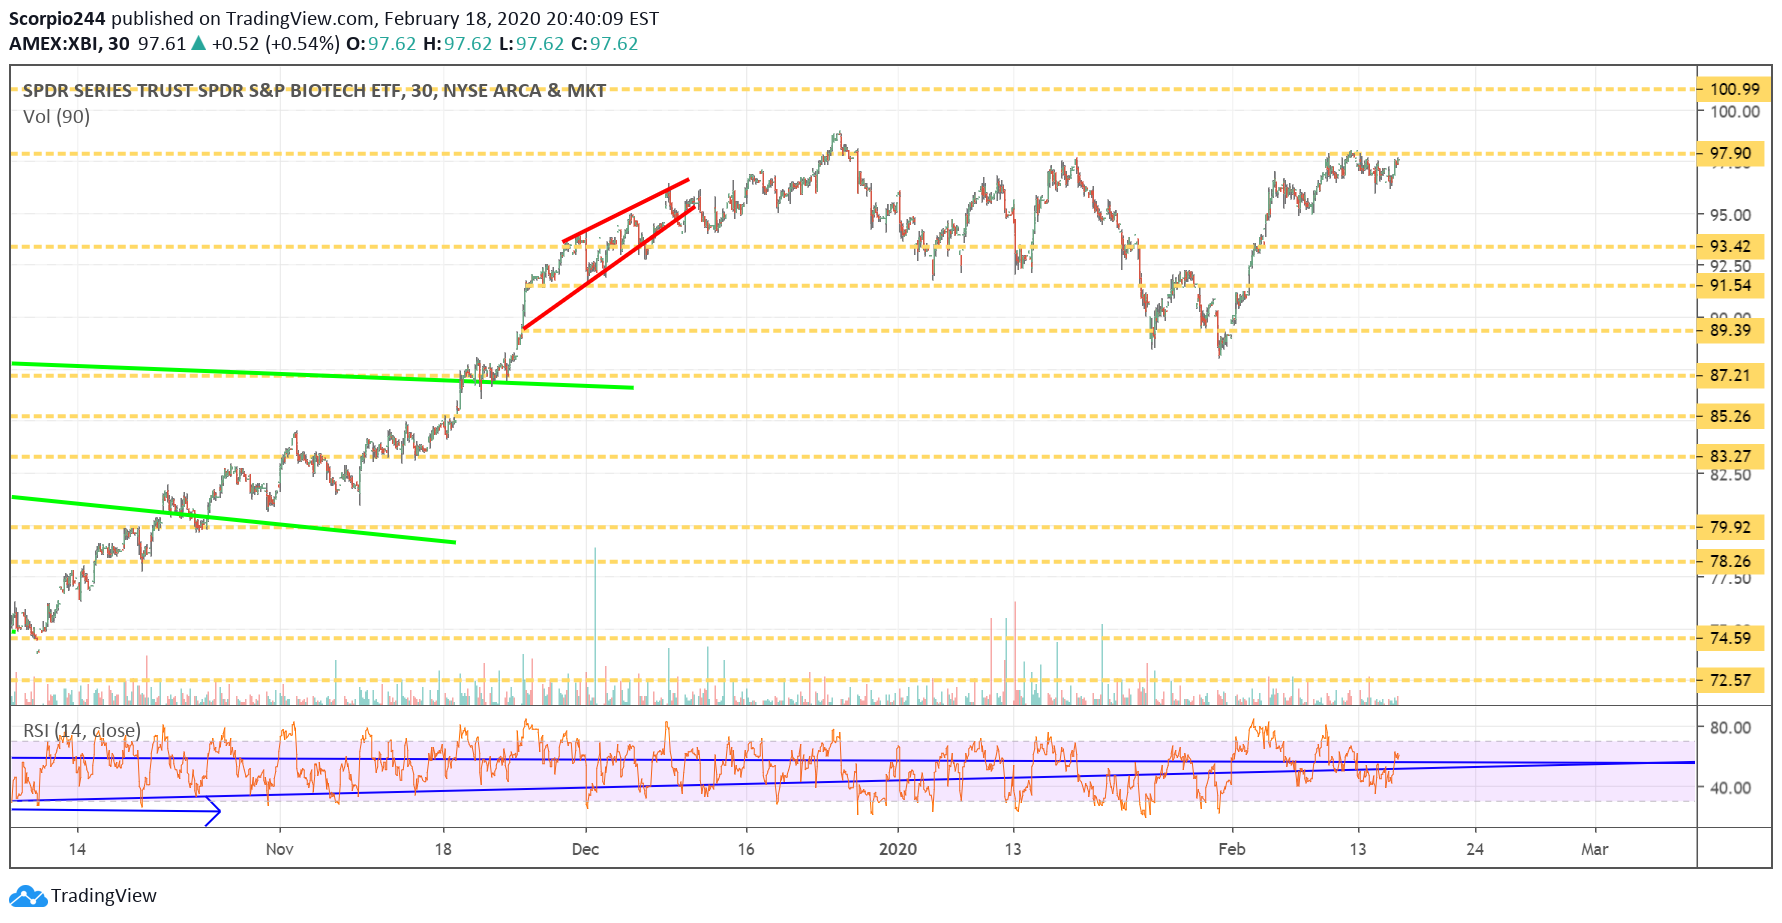
The biotechs are running higher, and they are nearing a pretty big break out at $98, potentially pushing the ETF higher towards $101.
XBI Chart

Netflix (NFLX)

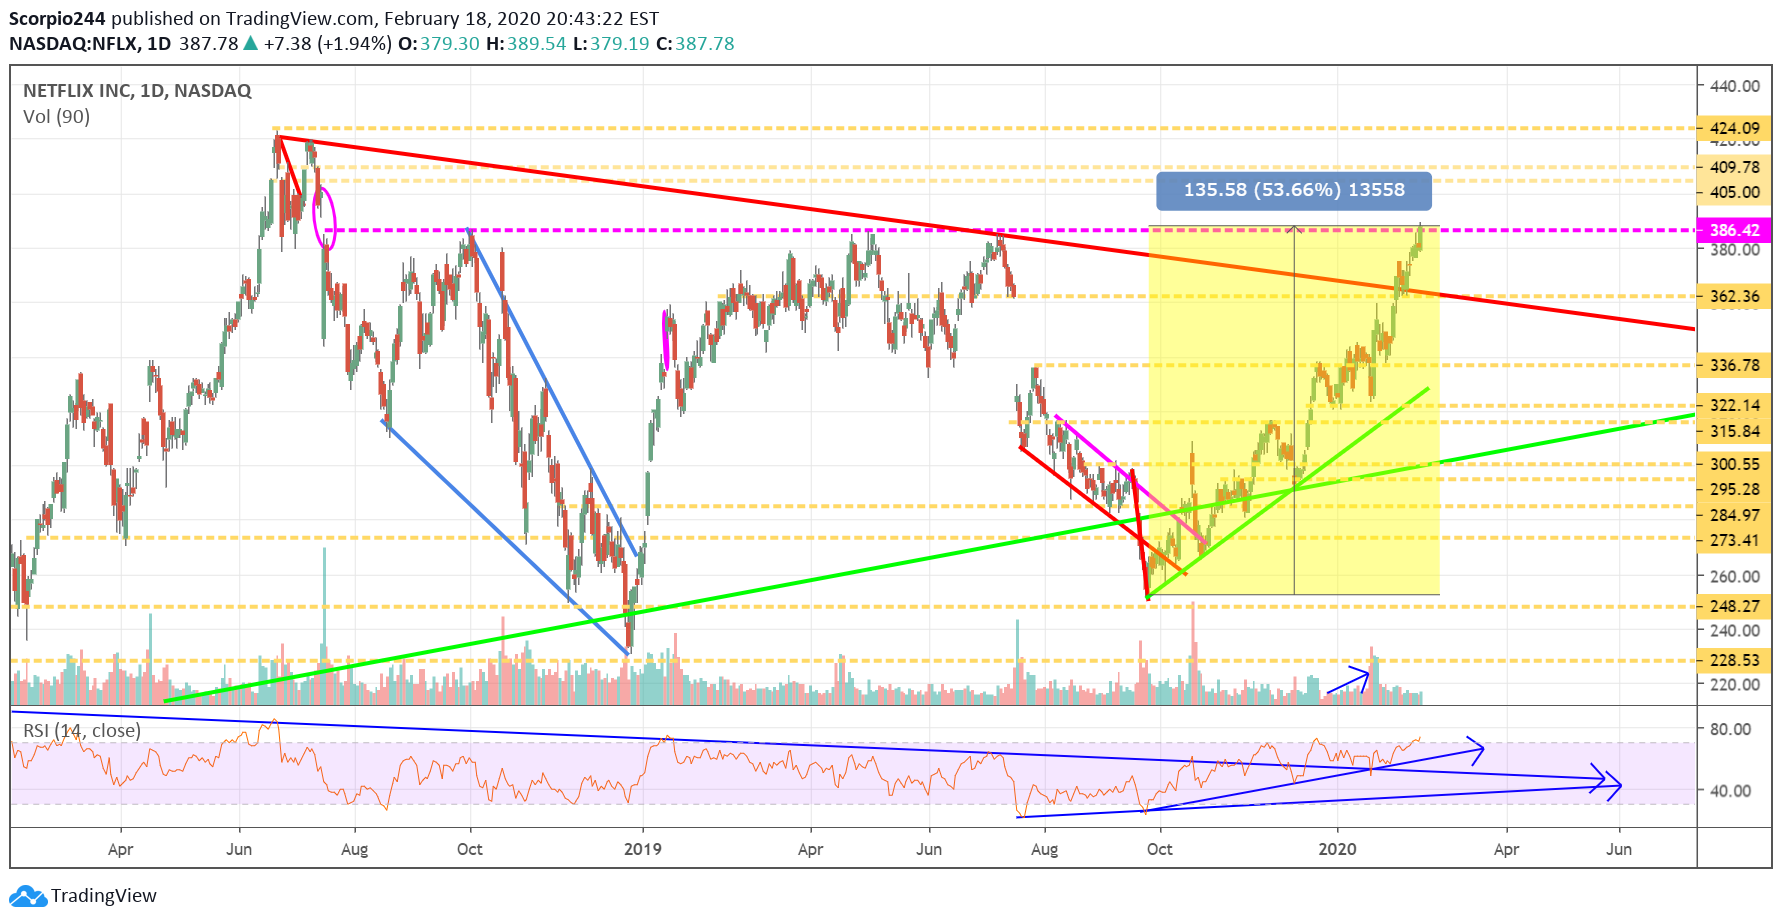
I noted today in the midday update that Netflix (NASDAQ:NFLX) was breaking out, and we needed to close above $385, and we did. The next level could be that all-time high. I hear no one mention how this stock is up over 50% just since the end of September. The market is telling you loud and clear what thinks about the coming competition. What competition!?
Netflix Chart

Pinterest (PINS)

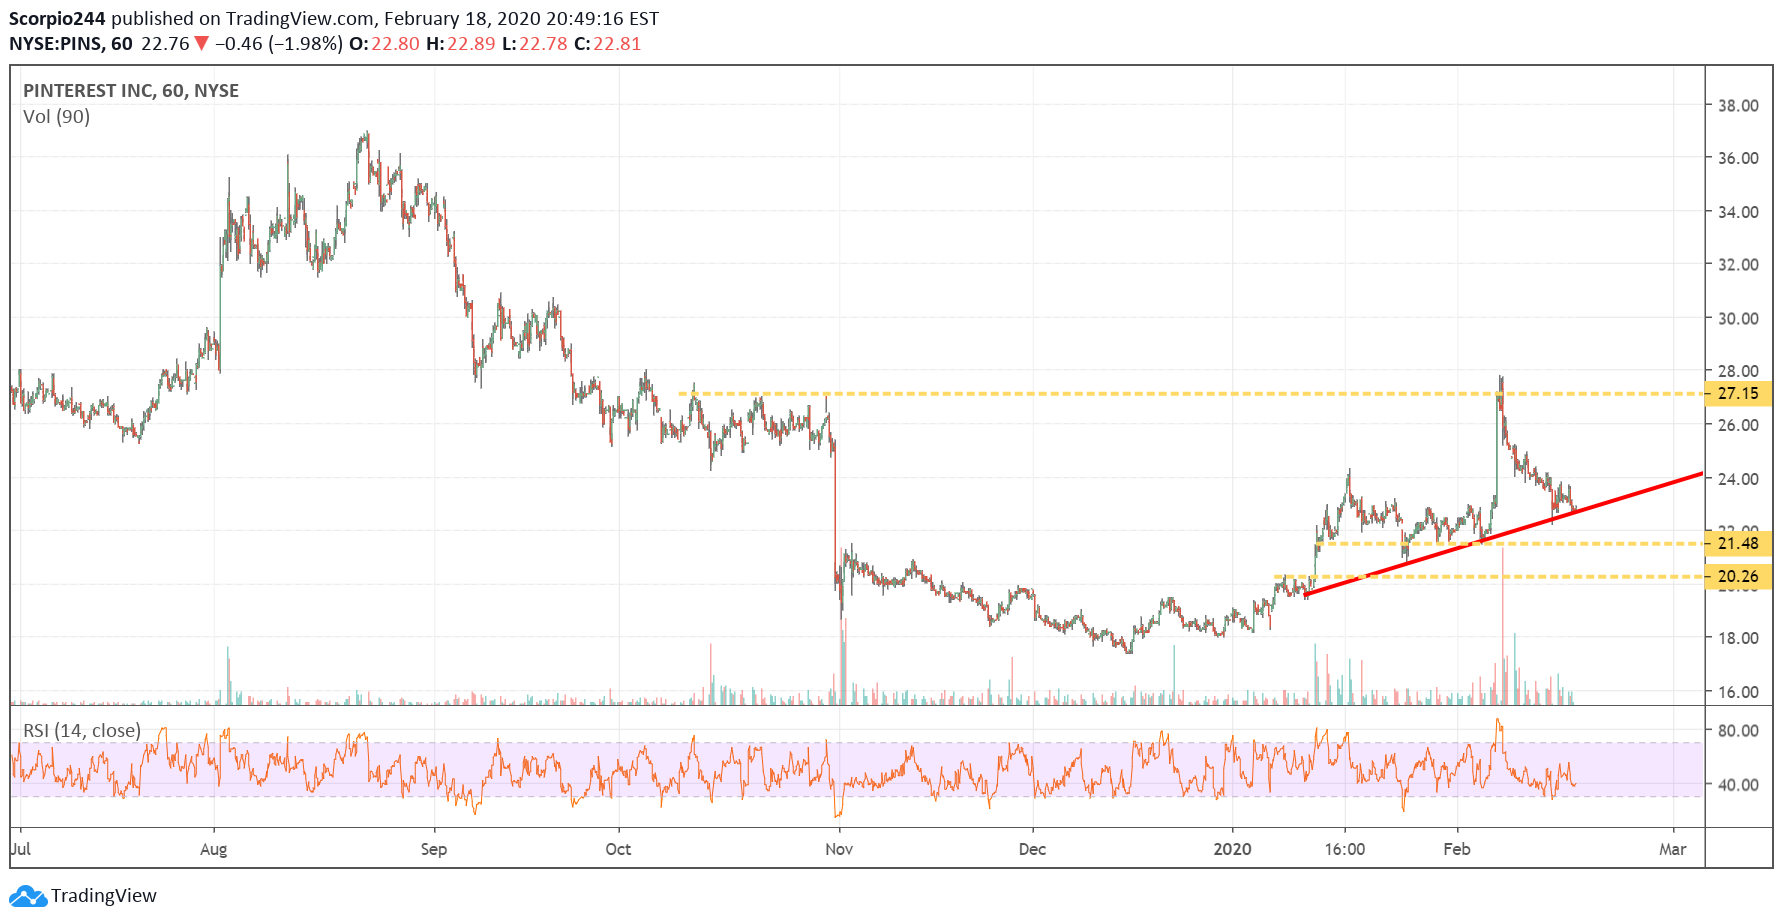
A member asked me to take a look at Pinterest (NYSE:PINS). I have never looked at this one before, so I’ll give it my best shot. The stock failed at resistance around $27, and proceed to fill a post-earnings gap lower. Now the stock sits on an uptrend, and typically once a gap is filled, it follows the previous trend; in this case, the long-term trend has been lower. So I think it heads lower still towards $21.50.
Pinterest Chart

Alibaba (BABA)

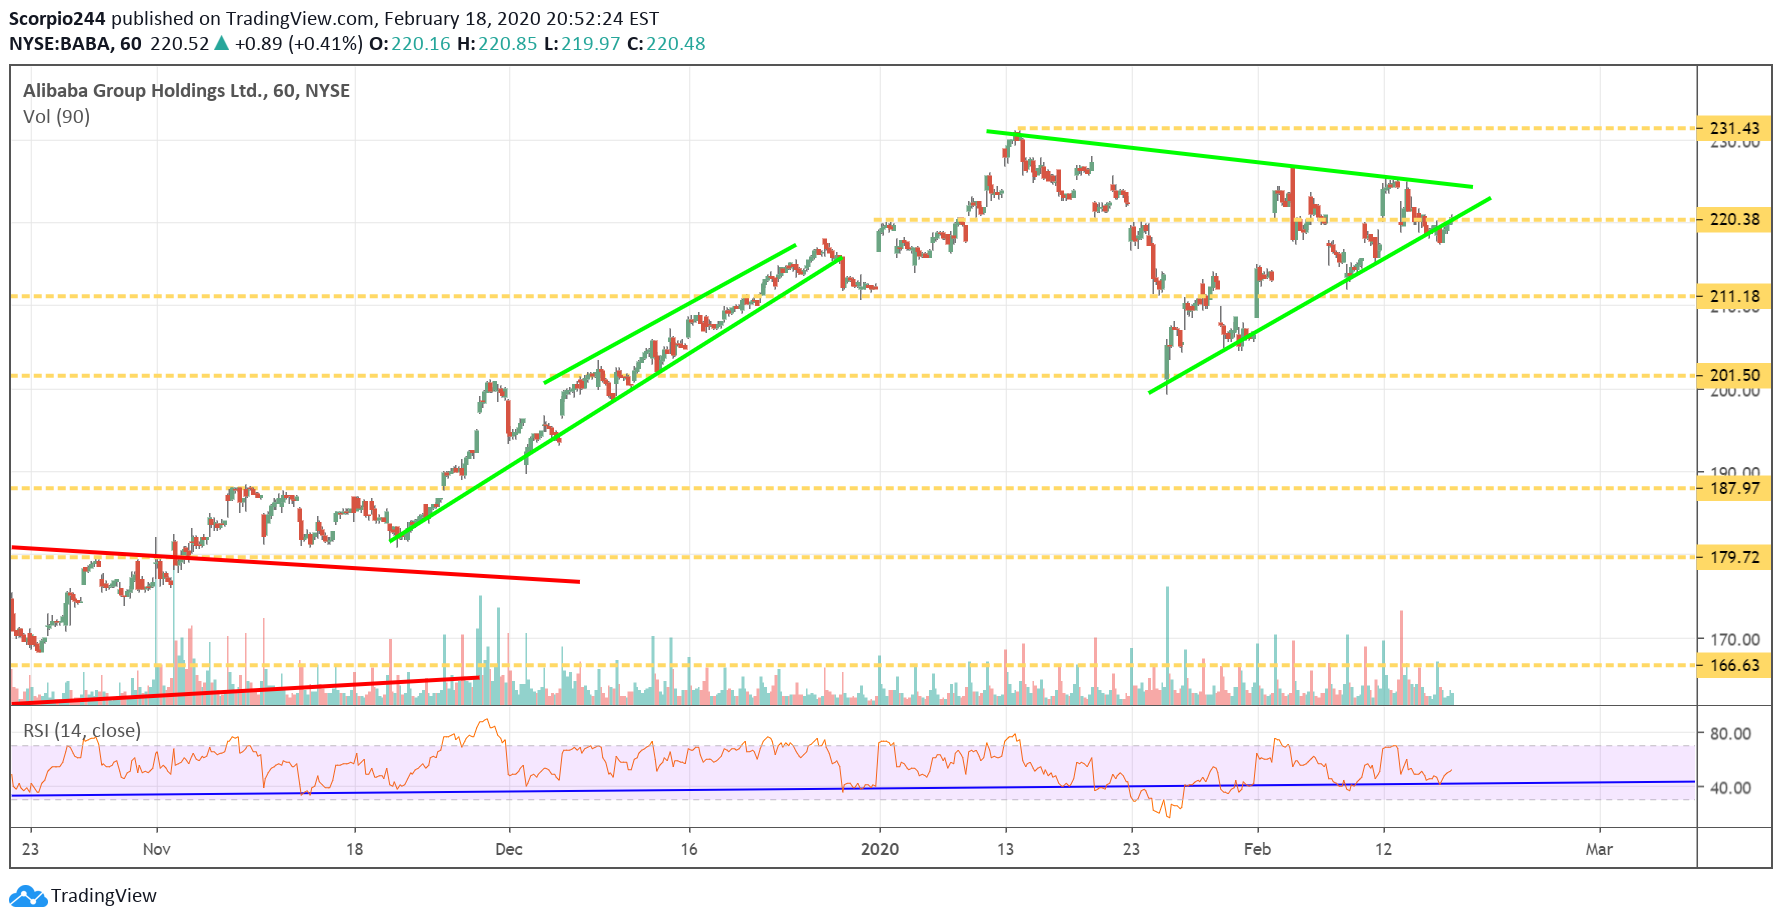
Alibaba (NYSE:BABA) is one sturdy stock that holds the line, and I think it is getting ready to make that jump back to $230.
Alibaba Chart

Skyworks (SWKS)

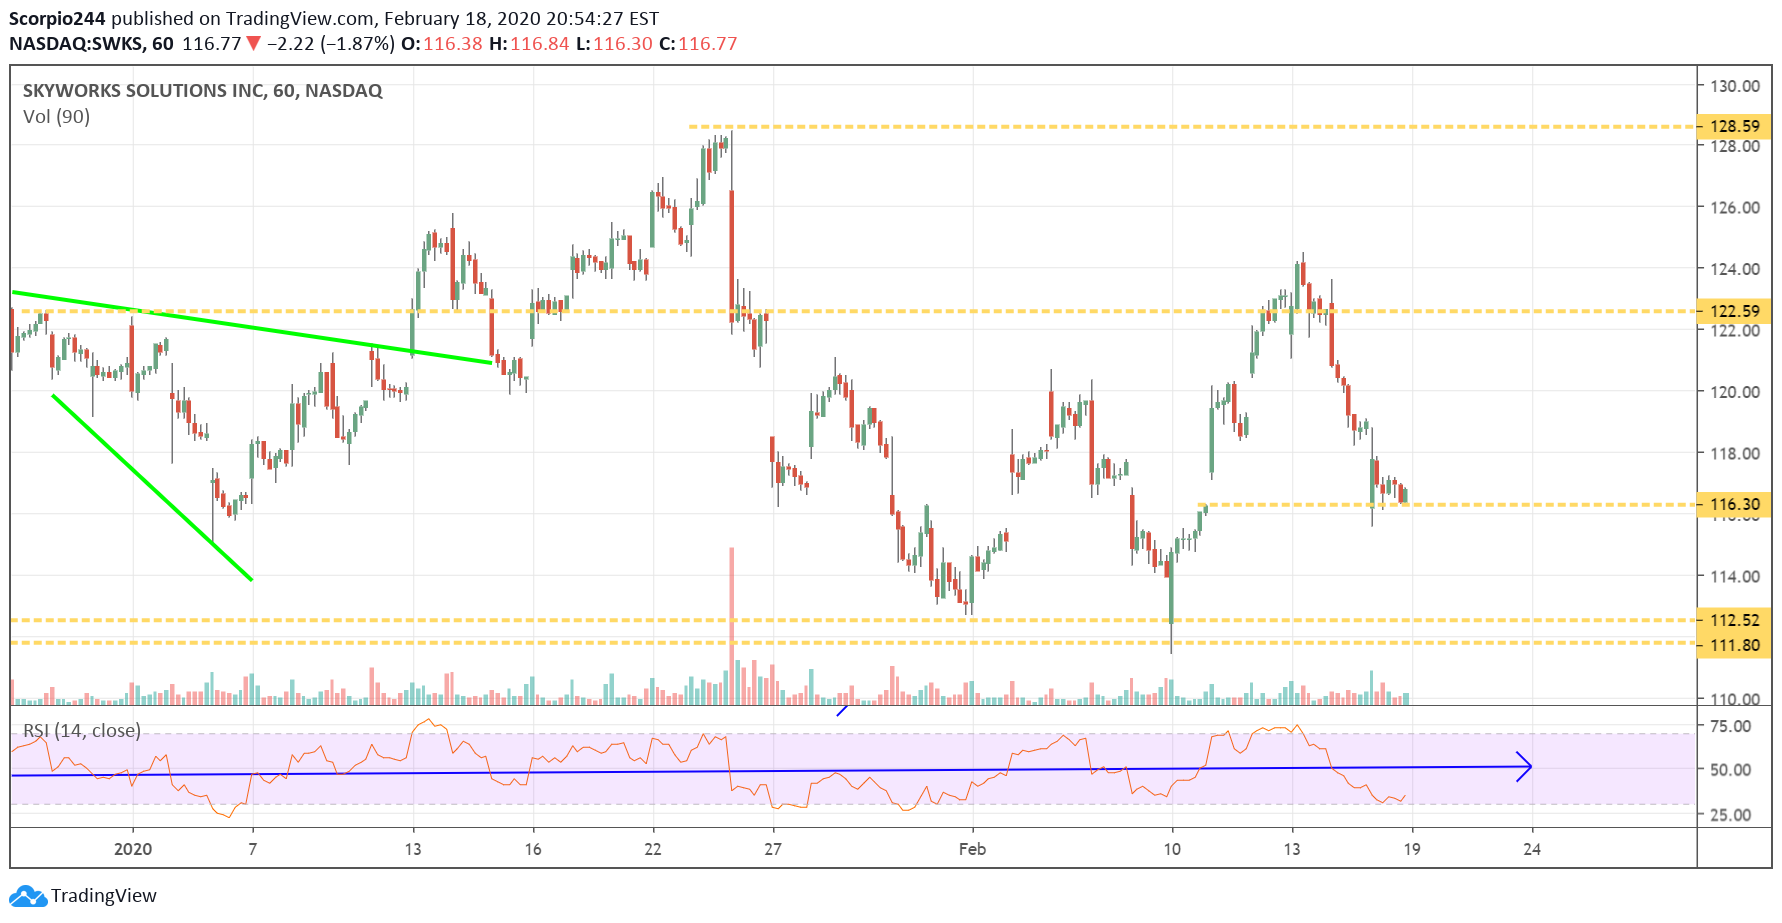
How bad could the Apple (NASDAQ:AAPL) news be when Skyworks (NASDAQ:SWKS) falls by just 2%. This has gaps to fill all over the place; I’m still looking for that one up at $128.
Skyworks Chart

Apple (AAPL)

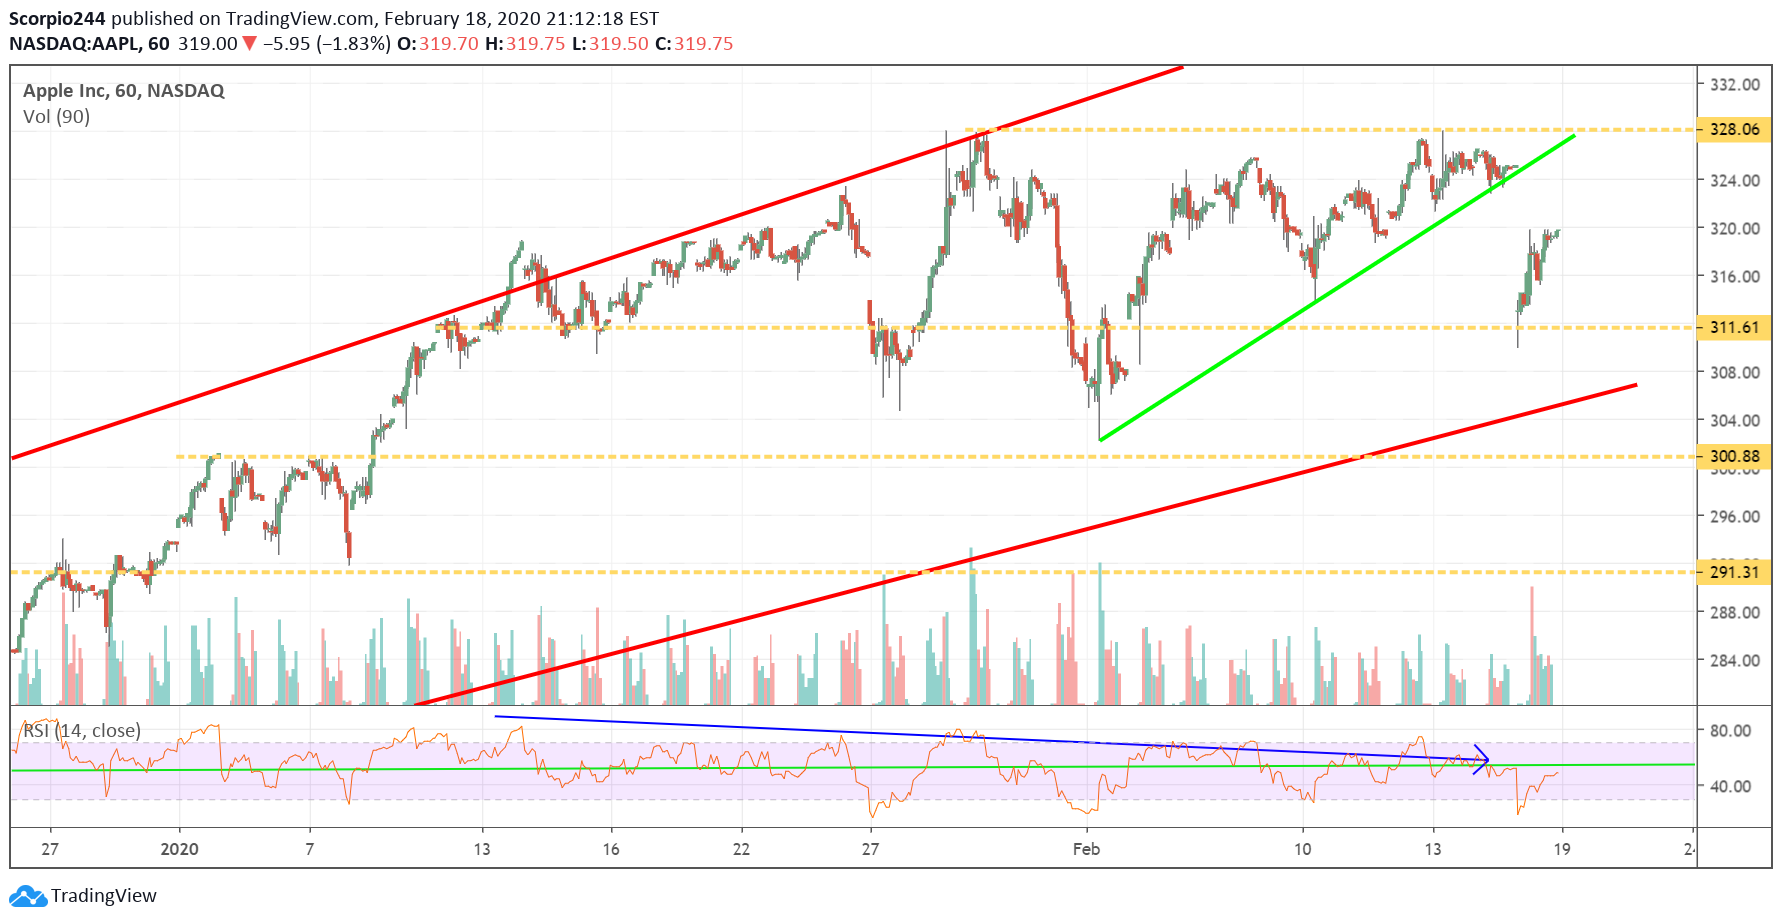
Apple was strong yesterday, and it seemed like a typical day for the stock. It found support around $311 and never looked back. Why can’t it fill the gap up at $325? It seems reasonable.
Apple Chart

Original Post

Latest comments

Loading next article…
Risk Disclosure: Trading in financial instruments and/or cryptocurrencies involves high risks including the risk of losing some, or all, of your investment amount, and may not be suitable for all investors. Prices of cryptocurrencies are extremely volatile and may be affected by external factors such as financial, regulatory or political events. Trading on margin increases the financial risks.
Before deciding to trade in financial instrument or cryptocurrencies you should be fully informed of the risks and costs associated with trading the financial markets, carefully consider your investment objectives, level of experience, and risk appetite, and seek professional advice where needed.
Fusion Media would like to remind you that the data contained in this website is not necessarily real-time nor accurate. The data and prices on the website are not necessarily provided by any market or exchange, but may be provided by market makers, and so prices may not be accurate and may differ from the actual price at any given market, meaning prices are indicative and not appropriate for trading purposes. Fusion Media and any provider of the data contained in this website will not accept liability for any loss or damage as a result of your trading, or your reliance on the information contained within this website.
It is prohibited to use, store, reproduce, display, modify, transmit or distribute the data contained in this website without the explicit prior written permission of Fusion Media and/or the data provider. All intellectual property rights are reserved by the providers and/or the exchange providing the data contained in this website.
Fusion Media may be compensated by the advertisers that appear on the website, based on your interaction with the advertisements or advertisers.
© 2007-2025 - Fusion Media Limited. All Rights Reserved.