Durable Goods Bring Cheer To Holiday Week
As noted Monday, bullish alignment of fundamentals and technicals can be a powerful bullish driver for higher stock prices. On the fundamental front, economic data this week has continued to align with “things are getting better”.
From The Wall Street Journal
Orders for U.S. durable goods—big-ticket items such as cars and aircraft designed to last more than three years—rose 3.5% last month, reversing a decline in October, the Commerce Department said Tuesday. Excluding the volatile transportation category, manufactured-goods orders rose 1.2%, the strongest gain since May.
Technical Set-Ups Remain In Place
Behind every stock chart are human beings. Therefore, bullish technical set-ups speak to economic perceptions that often precede higher stock prices. The set-ups we recently covered (no sign of buying exhaustion and post-Fed higher highs) remain in place. It is not difficult to envision a push toward 1850 on the S&P 500 in the not too distant future.
Tech Stocks Maintain Bullish Bid
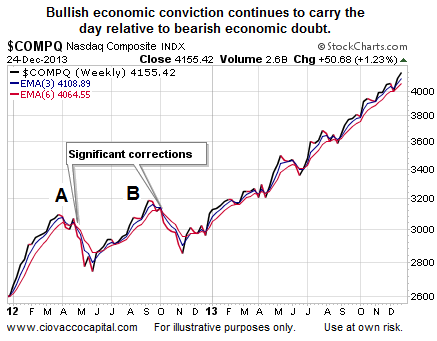
Our market model produces prudent asset allocations based on observable evidence related to the market’s tolerance for risk. The evidence in hand aligns with a high tolerance for risk, and thus, calls for a heavy weight to growth-oriented assets, such as stocks. One example of bullish evidence is the strong demand driving technology stocks. As long as the weekly chart of the NASDAQ below avoids a “correction look” (see A and B), we will continue to give our positions in technology (QQQ) the bullish benefit of the doubt.

Fed Wants Employment Gains
The Federal Reserve’s decision to taper their monthly bond purchases was based in part on evidence of an improving labor market. The post-Christmas trading day brought another upbeat report on the prospects for employment.
From USA Today
Initial claims for unemployment insurance fell sharply last week in a possible sign that the job market is continuing to gain strength. First-time claims for jobless benefits dropped by 42,000 to a seasonally adjusted 338,000 for the week ending Dec. 21, the Labor Department said Thursday.
Investment Implications – Bullish As Long As Market Allows
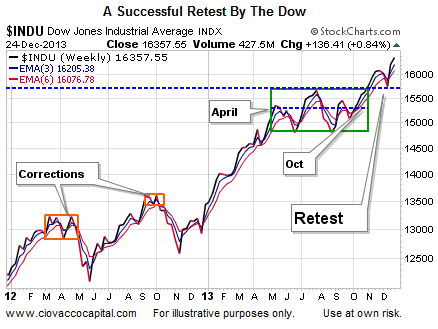
The weekly chart of the Dow below tells us the battle between bullish economic conviction and bearish economic fear continues to be won by the economic optimists. The Dow consolidated between April and October, which indicated a nearly even battle between confidence and fear. The bulls eventually won the battle pushing the Dow above the blue-dotted line. The recent Fed-related uncertainty resulted in a “retest” of the previous breakout level.

Until the evidence calls for a more defensive stance, we will continue to hold our positions in U.S. stocks (SPY), technology, financials (XLF), energy (XLE), small caps (IJR) and global stocks (VT). The market model weeds out our weakest positions incrementally unless they can begin to earn their keep. We still maintain a relatively modest exposure to China (FXI) and emerging markets (EEM). The model has already reduced exposure to emerging markets on two separate occasions since the October 9 low in stocks. A third reduction may be in the cards this week.
