The dam not only broke to today, but it also burst open and flooded the entire village. I was hoping and praying, we could avoid this scenario and that somehow or some way, the S&P 500 would hold the key levels I mentioned yesterday at 3,110. Unfortunately, hoping and praying isn’t enough.
While it is only “money,” and there are more important things in life, it can sure feel horrible.
I’m quite sure though that the sun will rise tomorrow, and a new day will start, and in time the markets will recover, and we will recover much in the same way that we did 2018, twice, and all the nasty pullback in history. The market and the economy have always endured.
S&P 500 SPY)
The S&P 500 fell by 4.4% to close at 2,978. The few companies that have issued profit warning do not seem to amount the $4 trillion in market destruction. At this point, if we assume no earnings growth in 2020 and it remains precisely at 2019 results around $156, then the S&P 500 is trading for about 19, which means it fairly valued with the historical average PE ratio of 19 going back to 1988. In this type of uncertainty, should the S&P 500 trade at 17 times, it equals 2650.
Currently, based on my own model, I am projecting earnings to grow to $171.60 in 2020, with one standard deviation of $165.35 to $177.85. If we assume earnings growth doesn’t fall to zero, but to the lower bound or around 4% to $165.35, then we currently trade for 18 times, at 17 times the S&P 500 is worth 2810. Anyway, here is a little chart based on my earnings estimates.

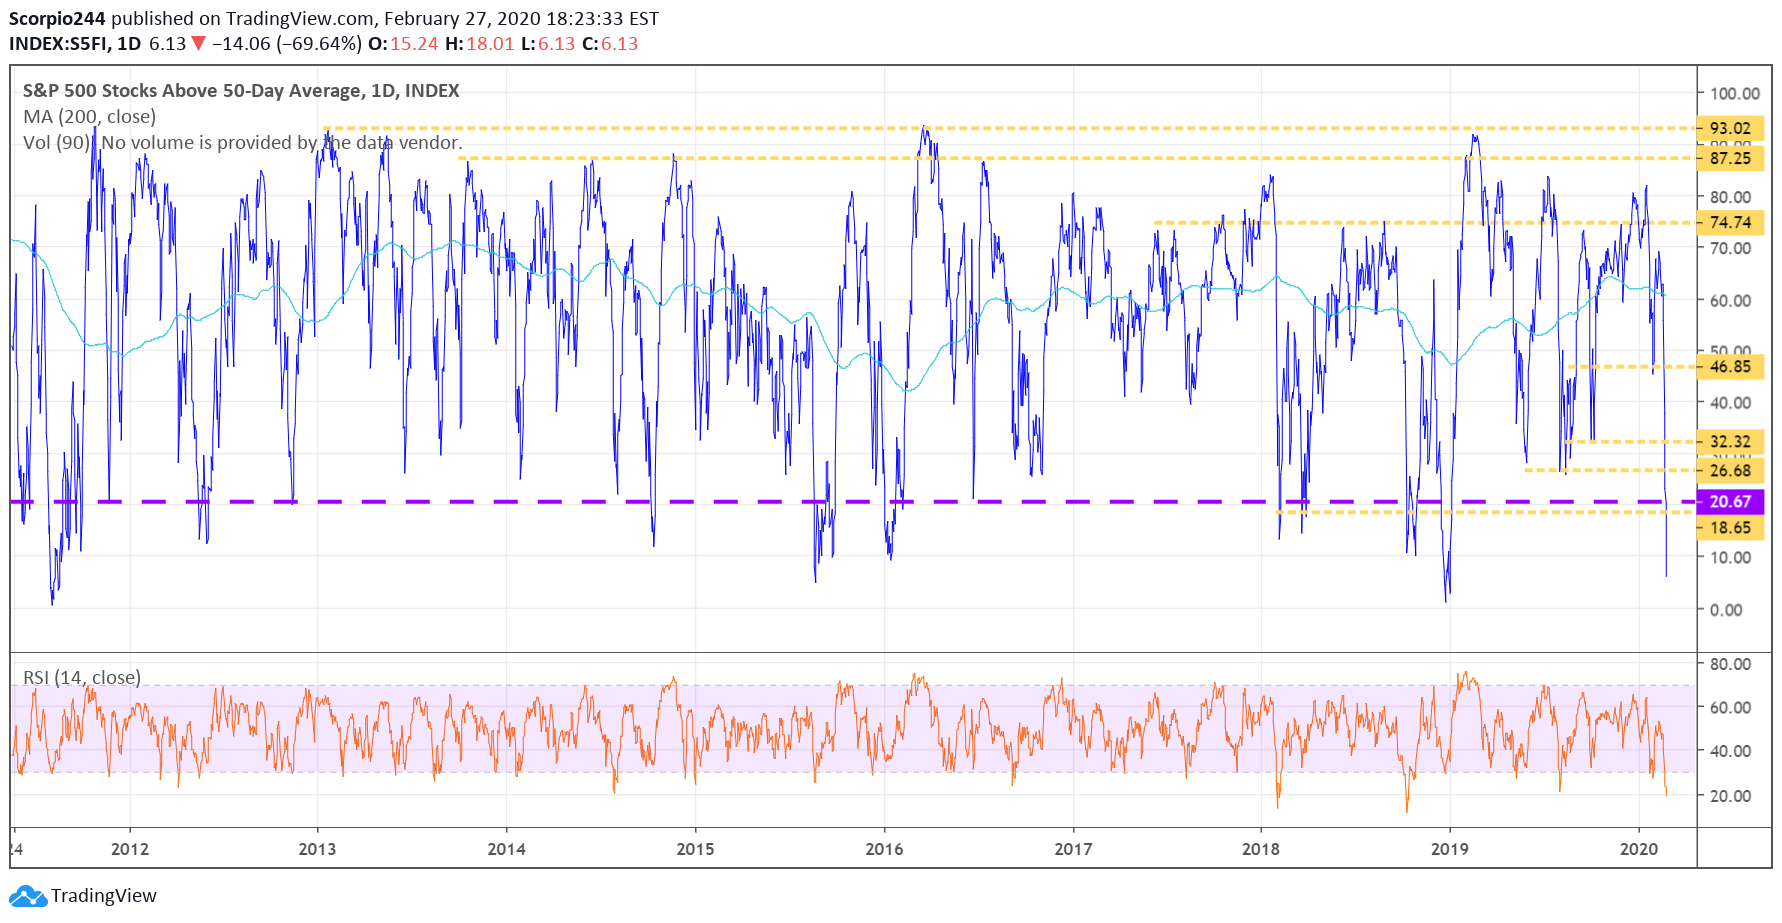
The number of stock below there 50 day moving average is now at 6%.
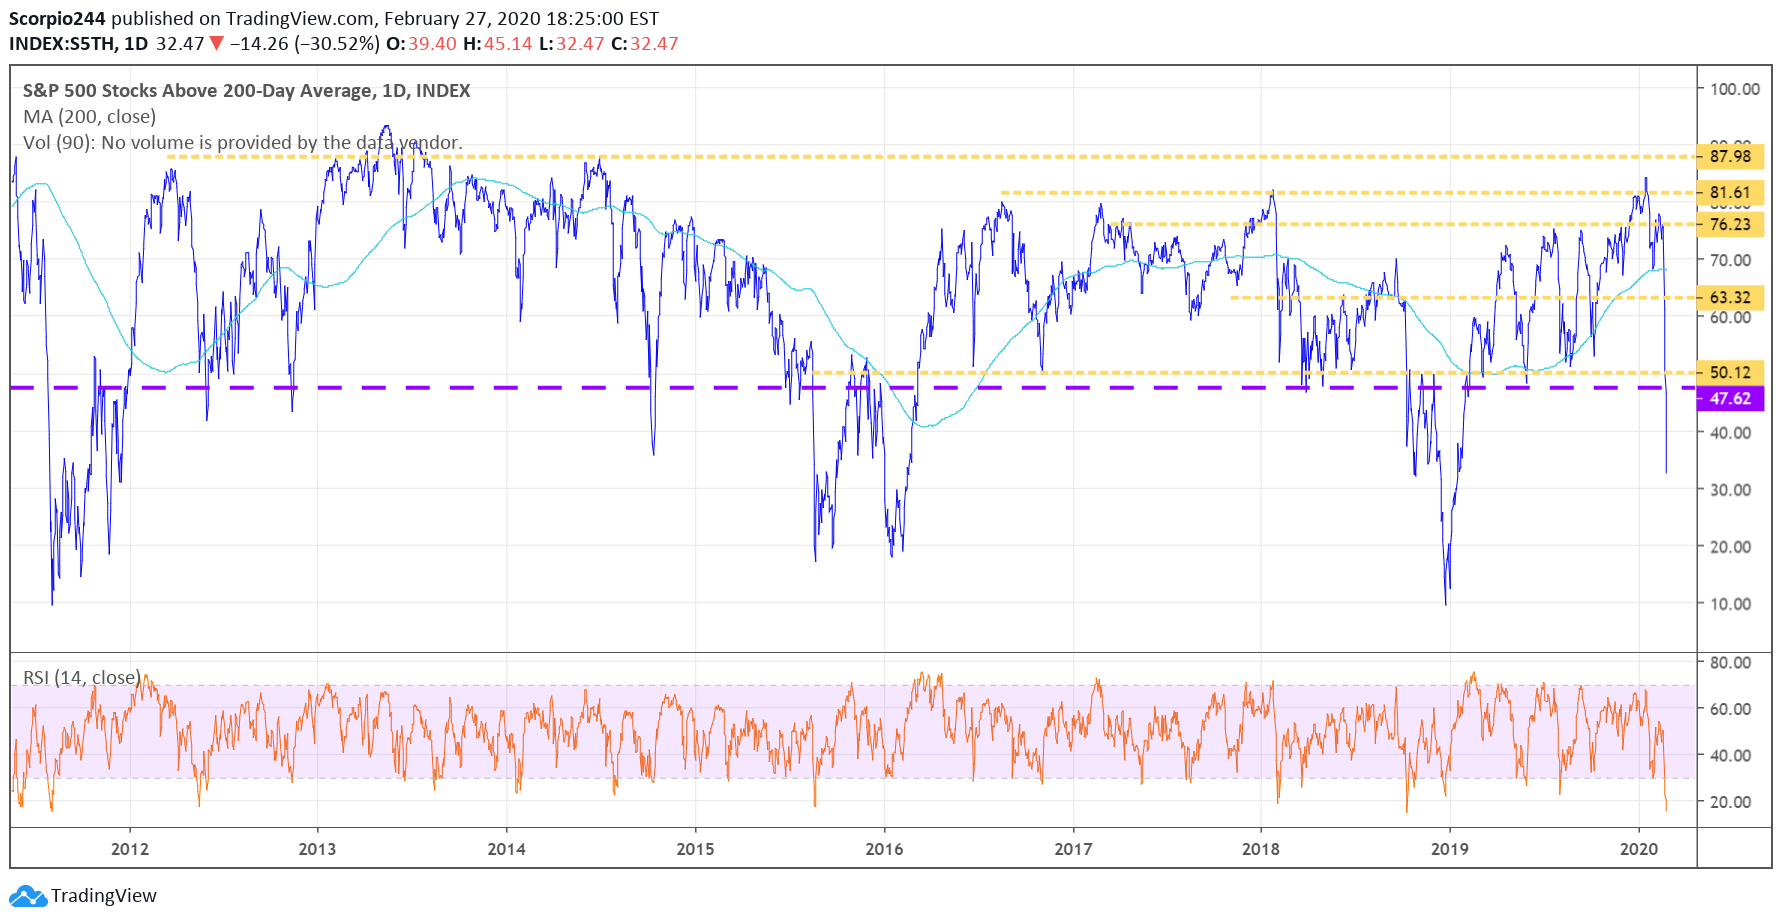
The number of stocks below their 200 day moving is at 32.5%.
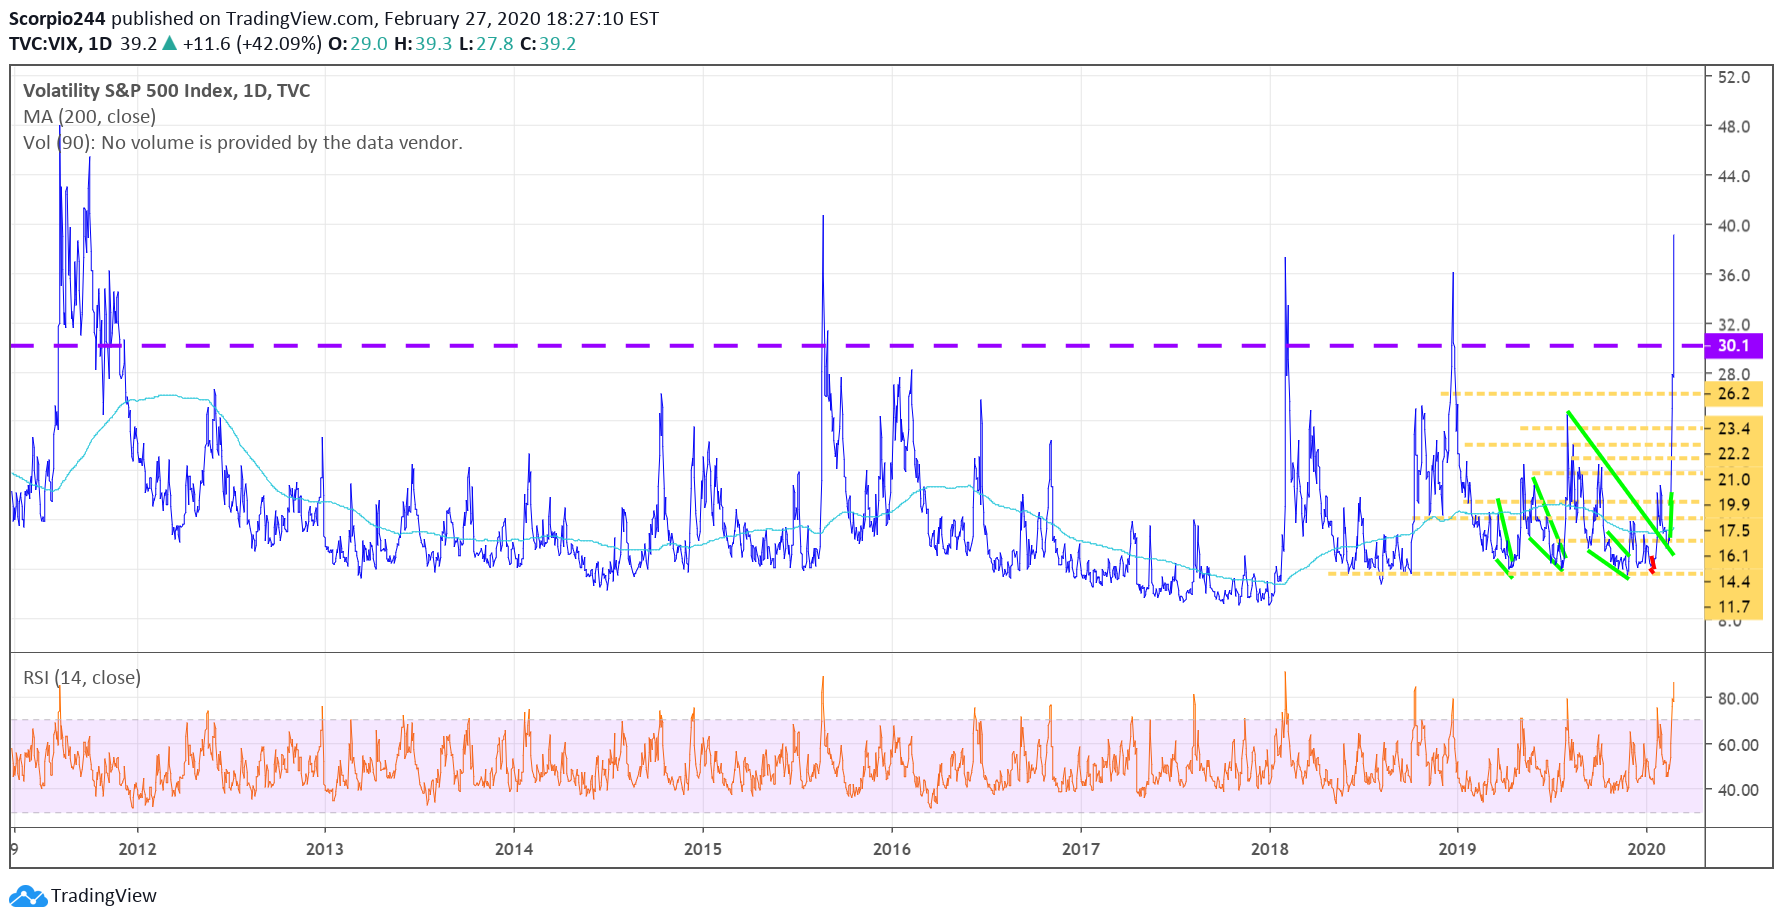
The VIX closed at 39.2, indicating extreme fear in the market.
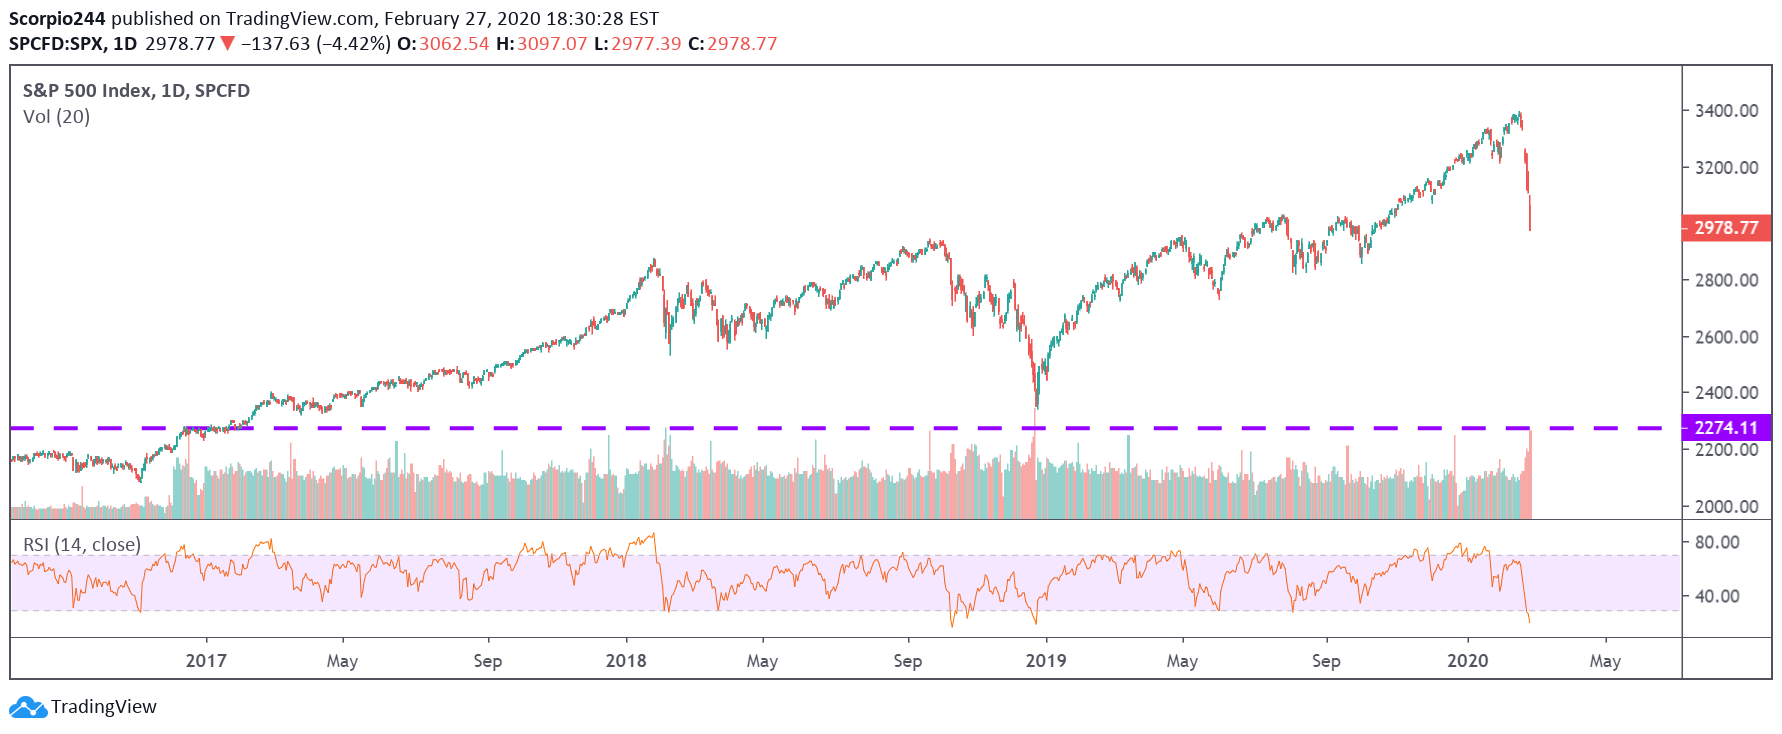
Meanwhile, the RSI plunged to 20, and volume reached levels not seen since December 2018. Reminiscent of the Christmas eve massacre.
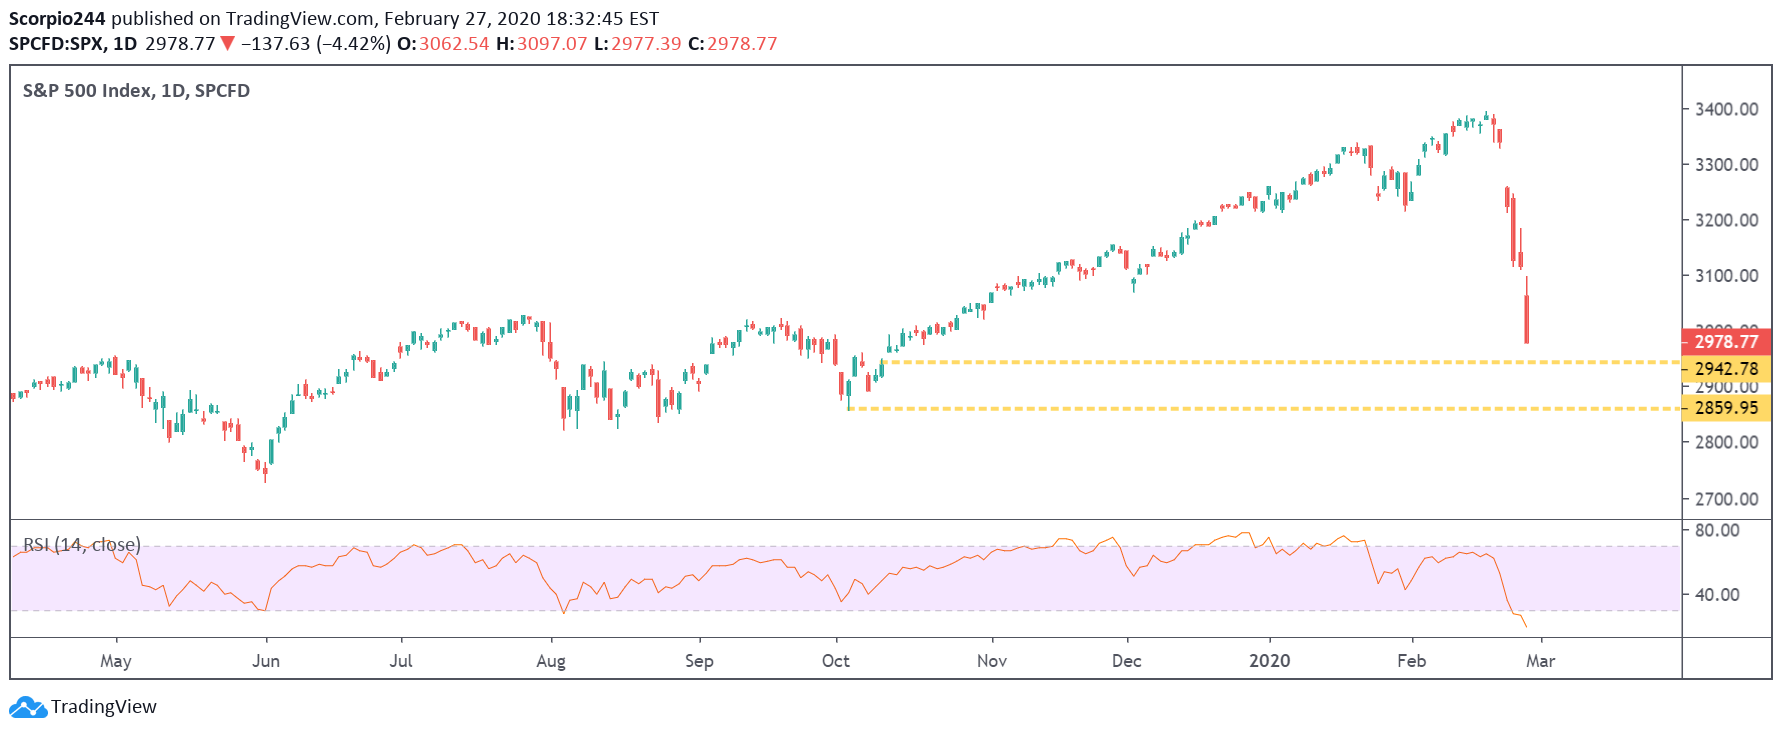
And if the market is going to destroy everything created from October on, it means it needs to go back to the very beginning. To somewhere between 2860 to 2940. But at this point, who knows! Nobody. This is what happens when you combine ETF’s, Algo’s, and leverage together.
Roku (ROKU)
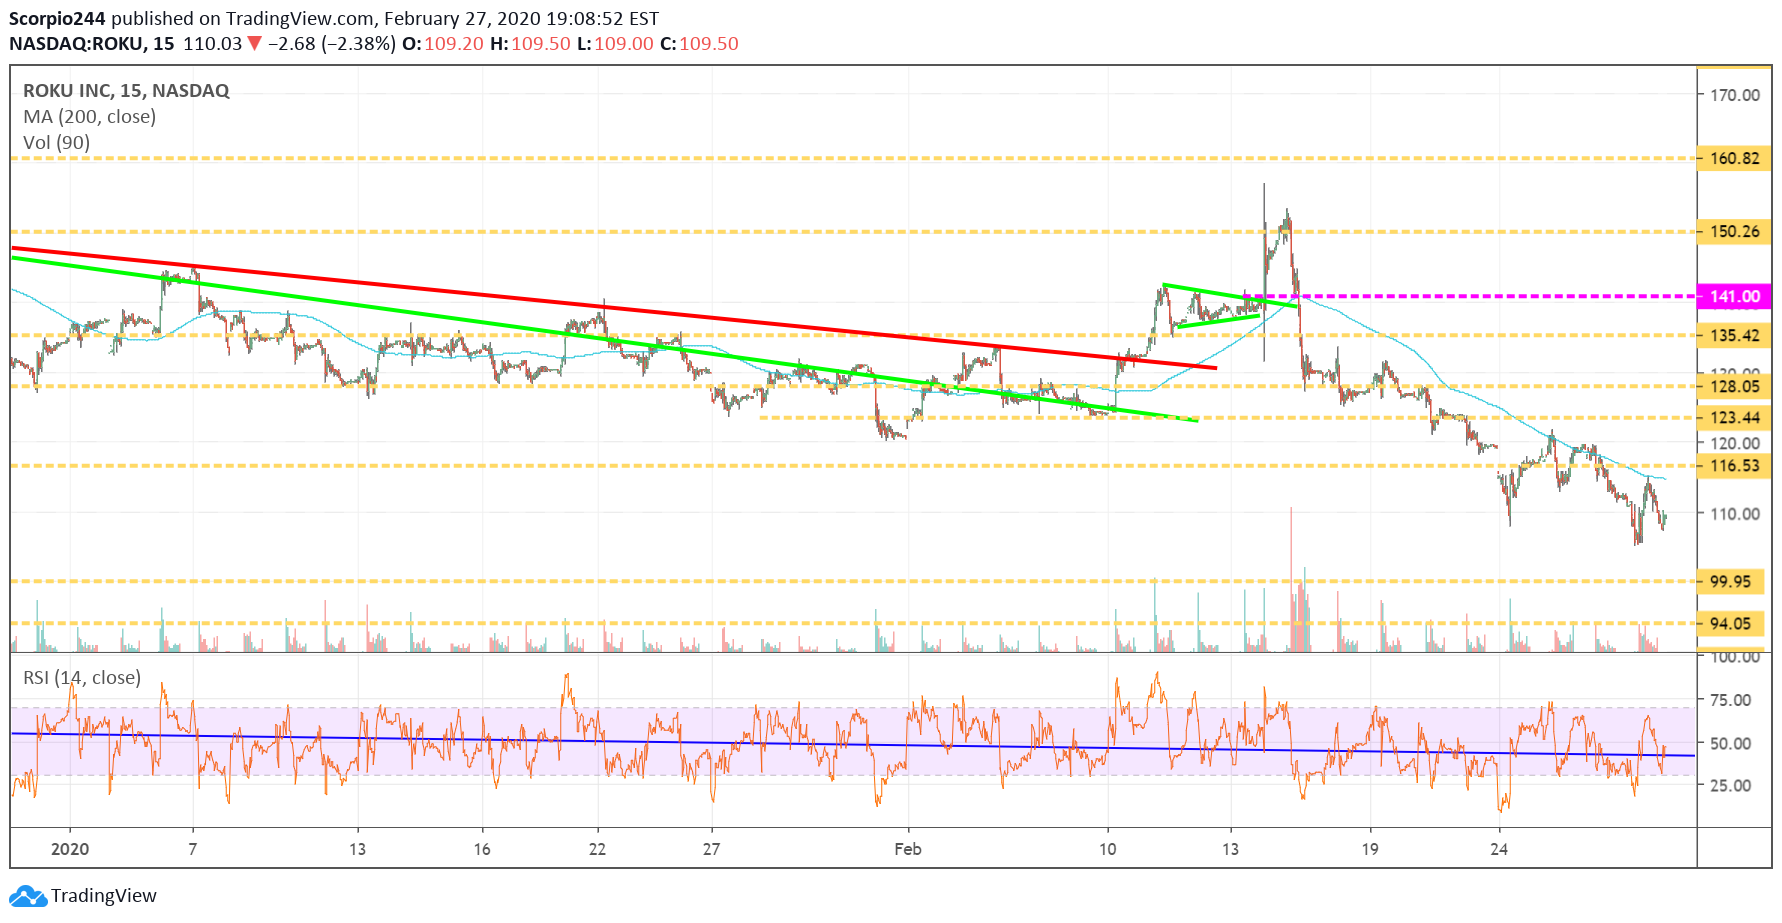
Roku Inc (NASDAQ:ROKU) has held up relatively well, and I guess that’s because everyone will be home streaming. Anyway, the stock should find firm support if it gets sucked down the drain like everything else.
Netflix
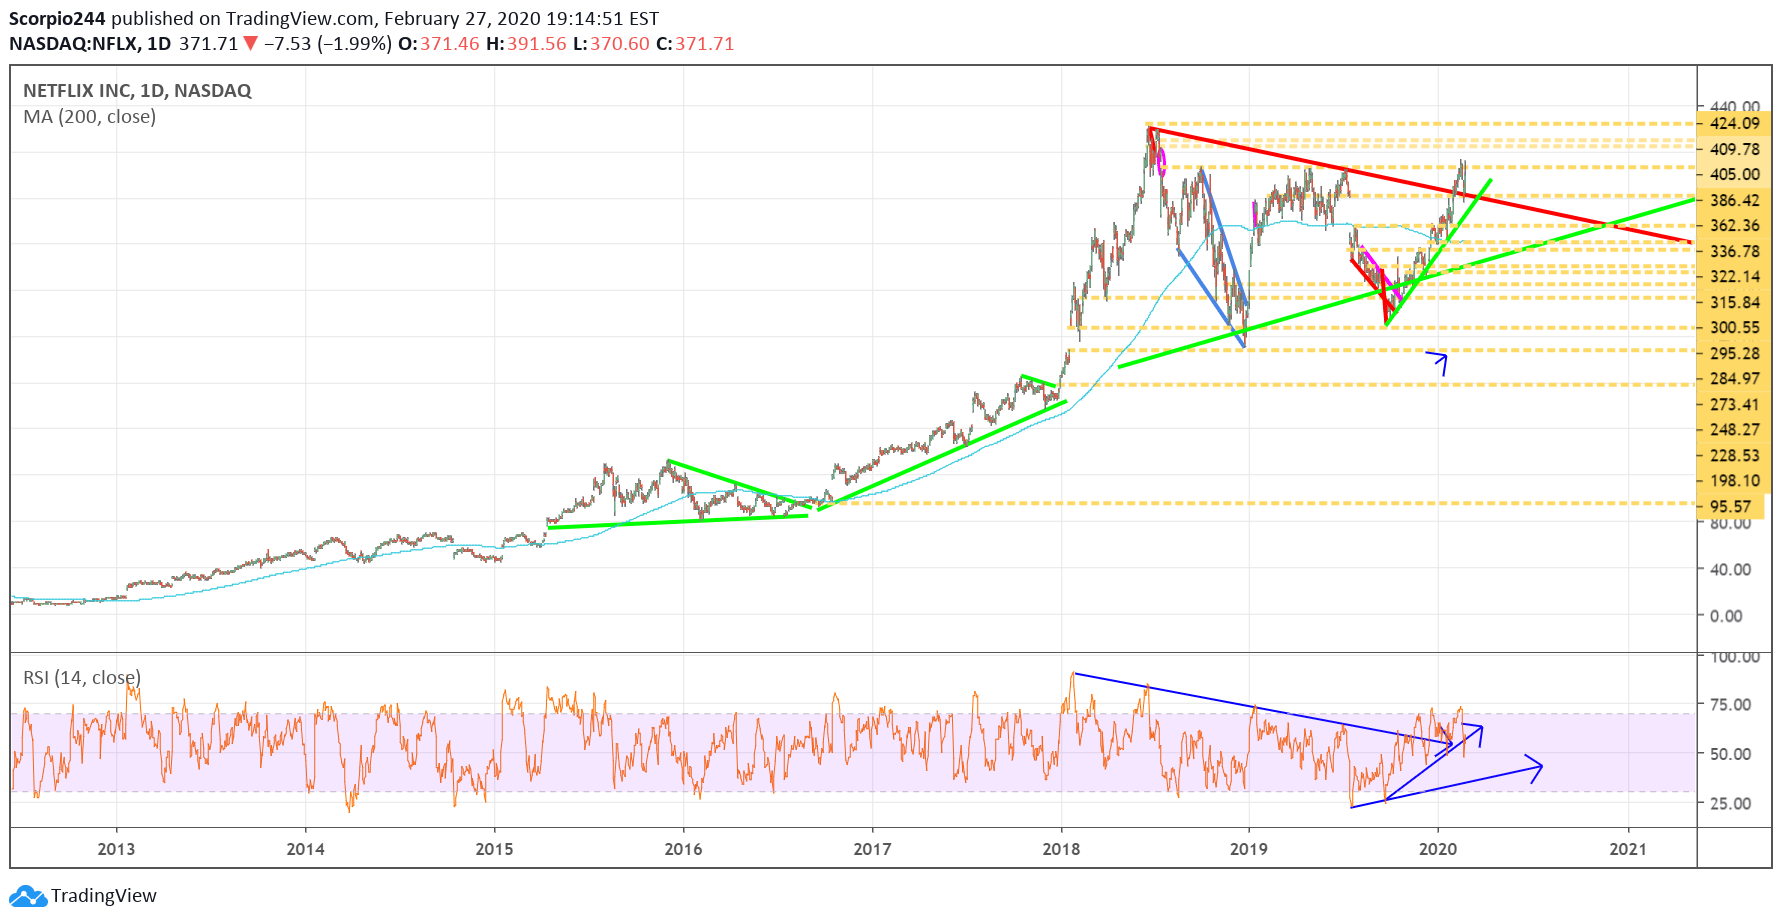
If we are all going to be watching TV on our Roku, then we need some content to view, and that is why Netflix (NASDAQ:NFLX) has been going higher. The stock is trending higher and could be heading to $405.
Apple
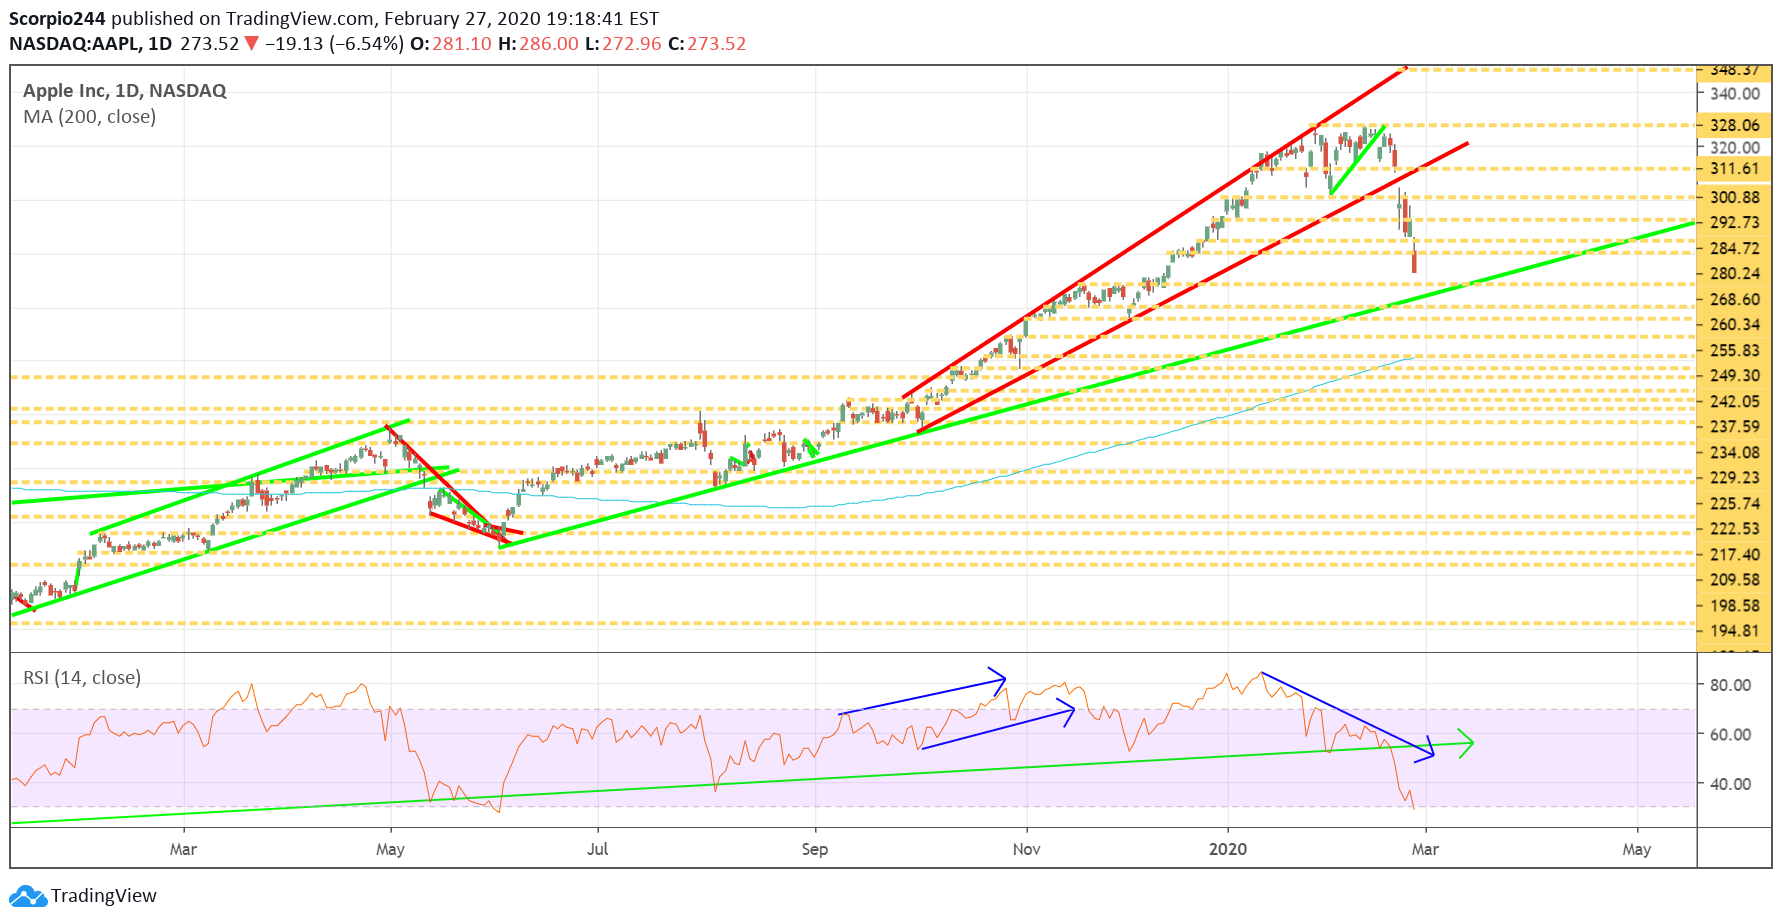
Apple (NASDAQ:AAPL) appears that it might have some strong support in the $268 region. The stock is pretty much oversold at this point. Not that it matters if it oversold, everything is.
Alphabet
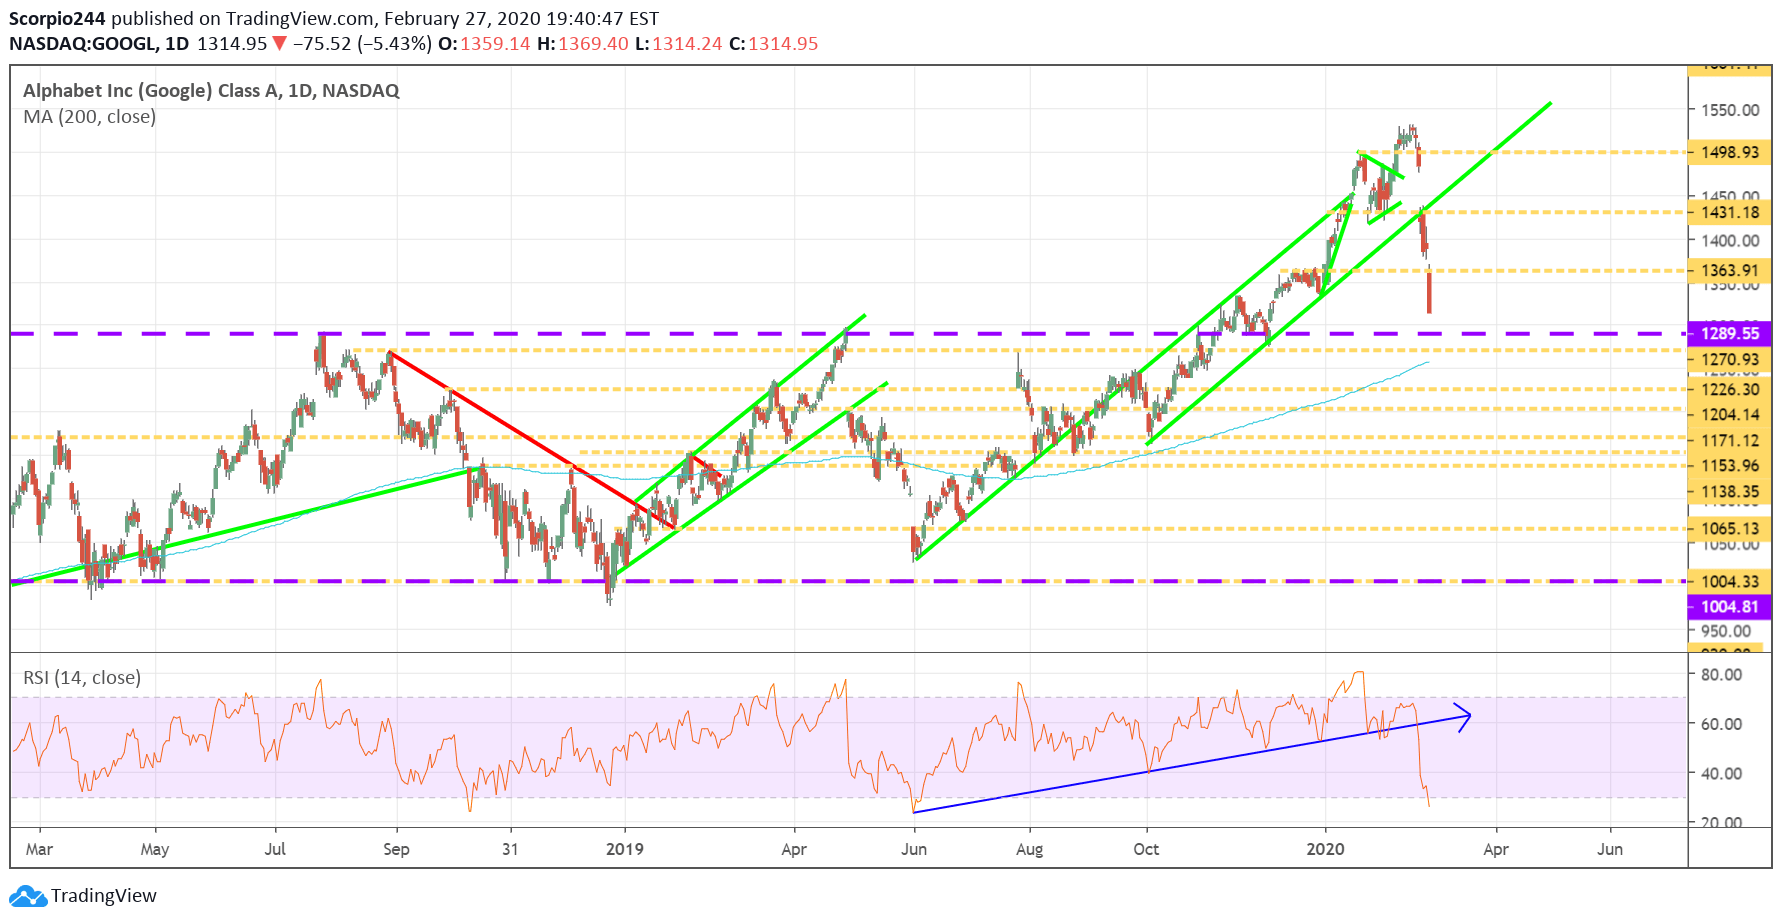
Alphabet (NASDAQ:GOOGL) is falling and should hopefully find support at its break breakout around $1290.
Tesla
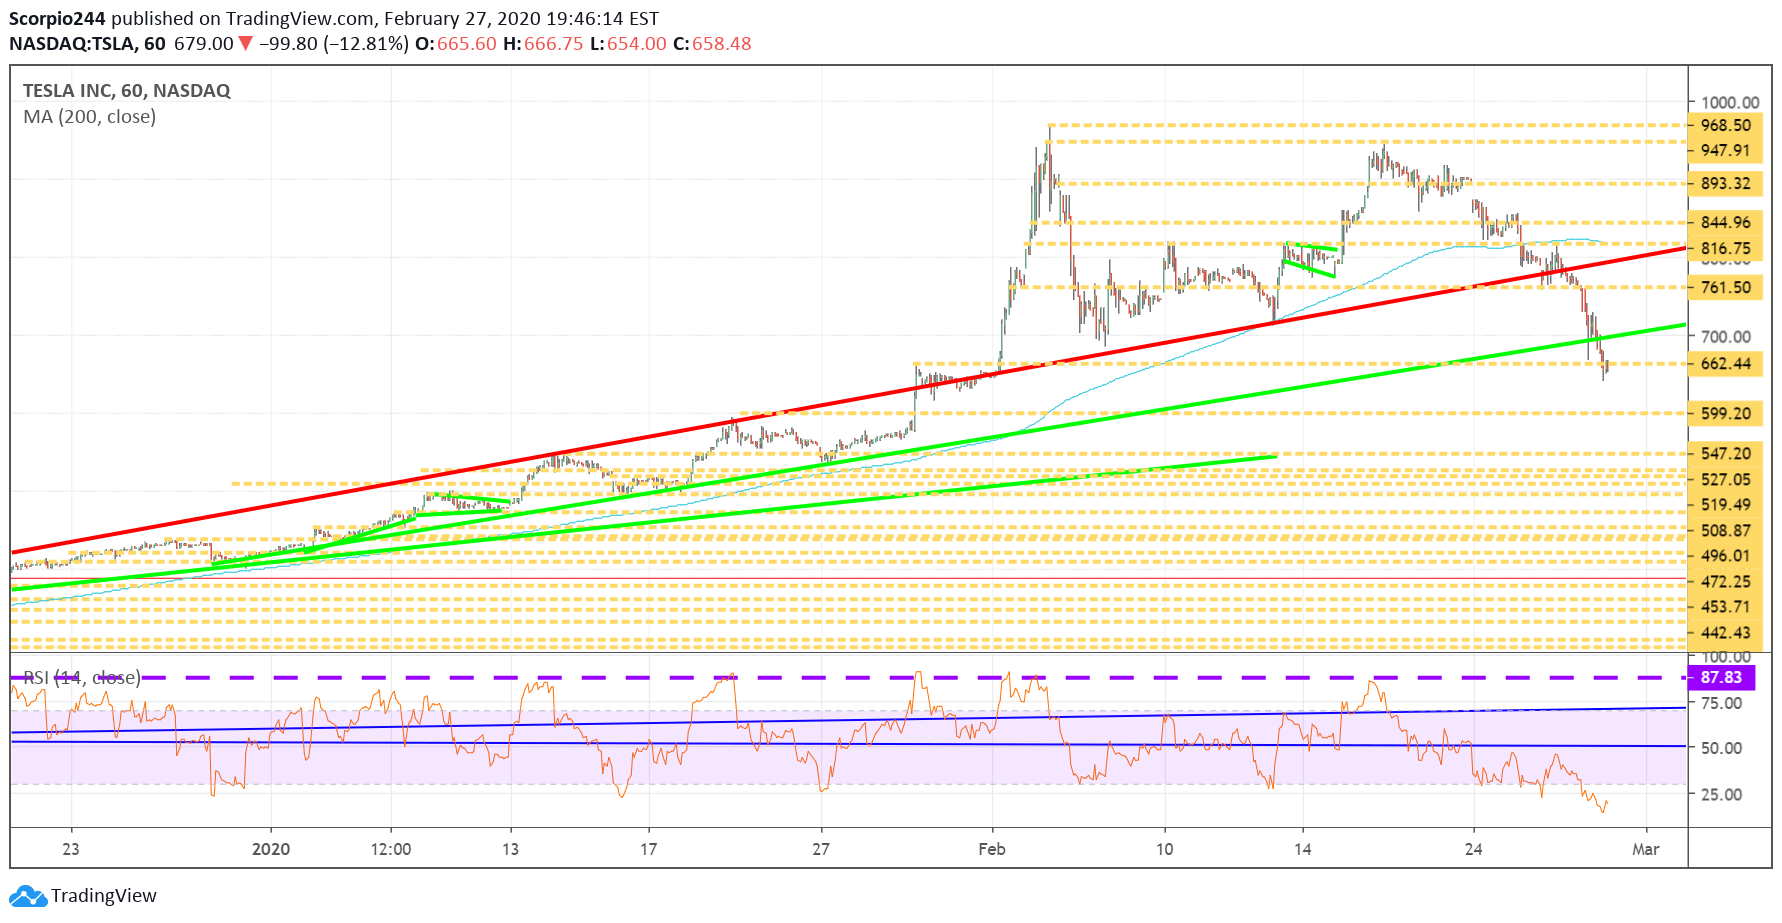
Tesla (NASDAQ:TSLA), maybe it goes back to $600.
Anyway, no commentary in the morning; I am doing my taxes, in case I wasn’t being tortured enough this week.
