Stocks May Still Rally Despite Fading Stimulus Hopes

Published 10/22/2020, 12:23 AM
Updated 11/16/2024, 07:53 AM
US500
-
QQQ
-
AMD
-
NFLX
-
TSLA
-
US10YT=X
-
SMH
-
SHOP
-

Stocks were down on Oc. 21, with the S&P 500 dropping around 25 basis points, while the Qs fell by around 10 basis points. It didn’t feel like an overly exciting day, with markets basically waiting on headlines regarding a stimulus deal. So far, there has been no news of a deal, just that they are getting closer, and I continue to think there will be no deal. But the market continues to trade off various headlines.

S&P 500

As a result of the dullness, the technical charts really didn’t change very much. We are pretty much in the same spot as yesterday, hovering around support at the S&P 500 around 3,440. I still think we have a good chance to target 3,600 by the election.
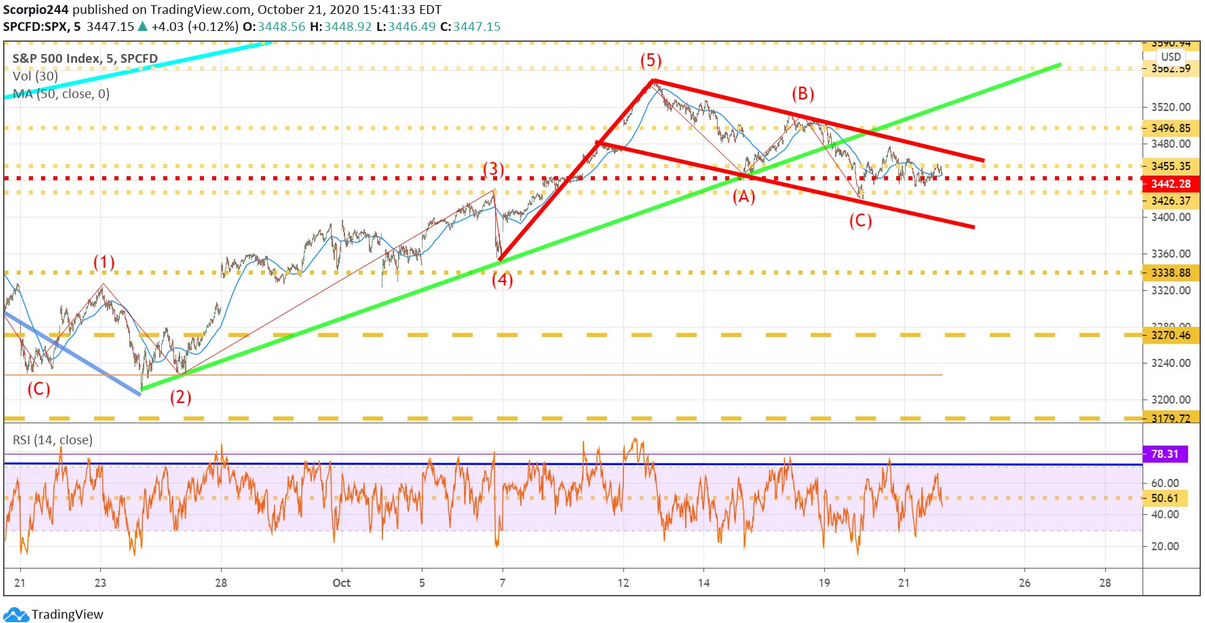
S&P 500 Index Chart

NASDAQ 100

Meanwhile, the QQQs are hanging around the $284 region.
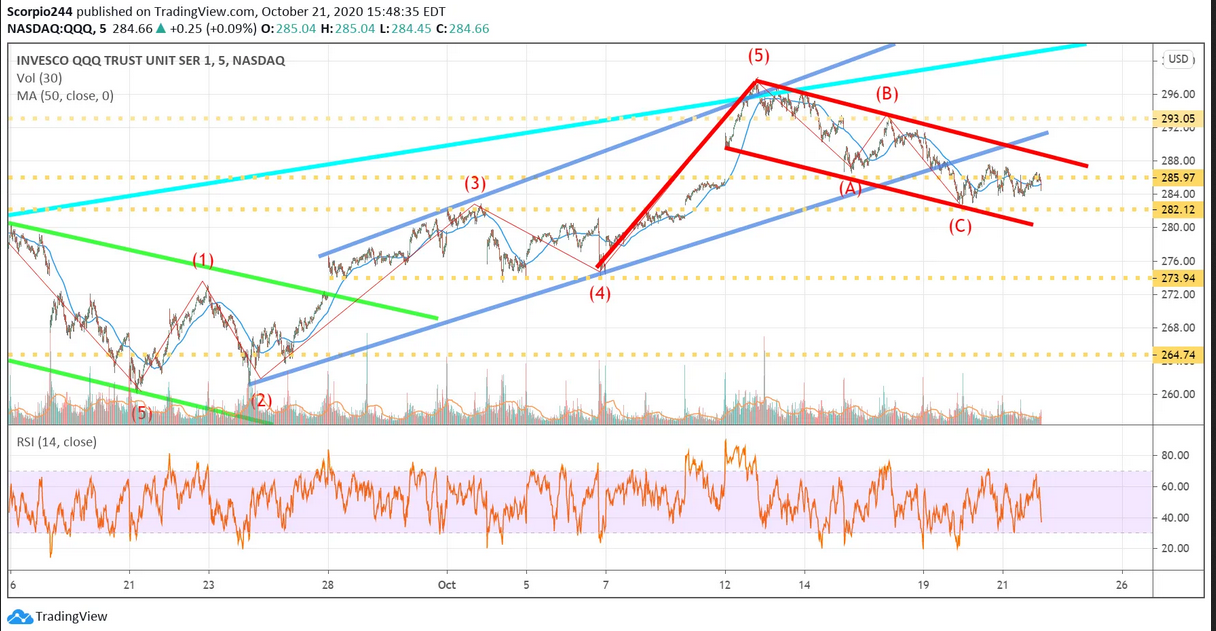
QQQ Chart

10-Year

The 10-year yield reached its highest levels in some today and climbing above 80 basis points. The higher yields are a result of the potential more stimulus coming.
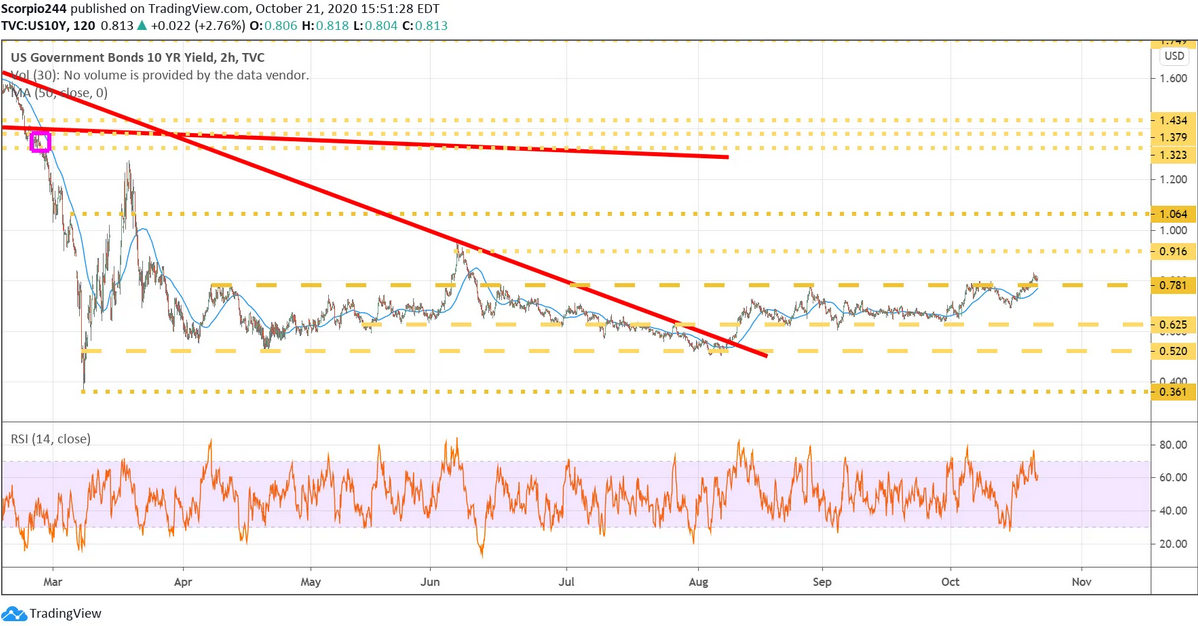
10 Yr Yield Chart

Semis

The SMH is starting to show major signs of weakness, and I noted earlier that a massive option bet was placed that the ETF falls from here. A drop below $180 would create problems for the sector.
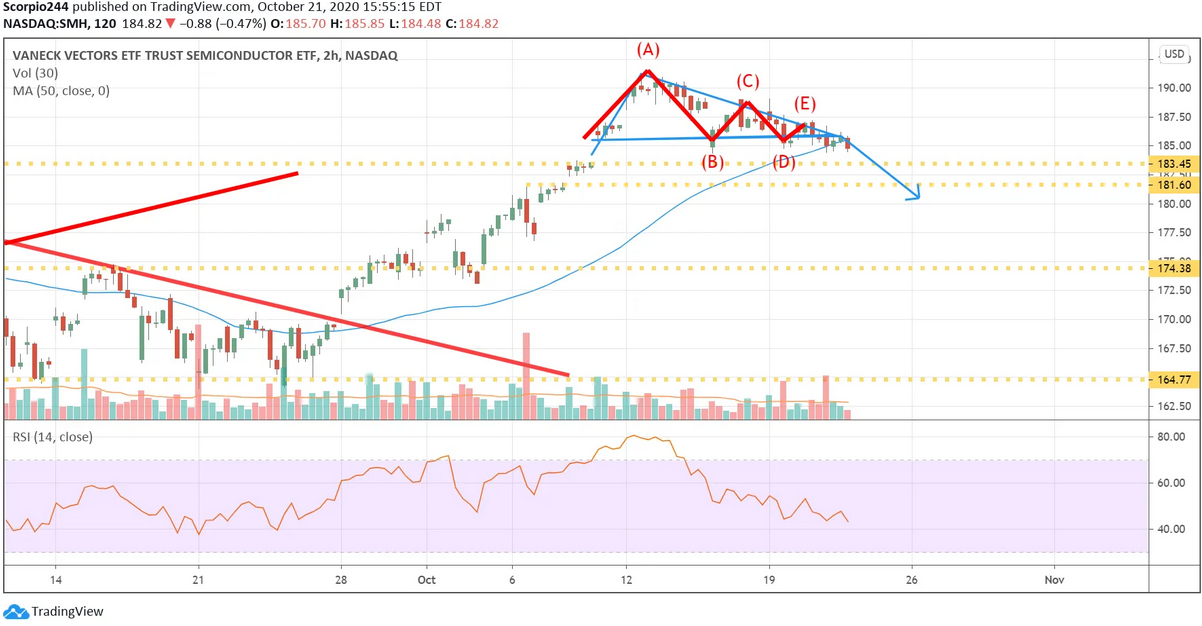
SMH Chart

AMD

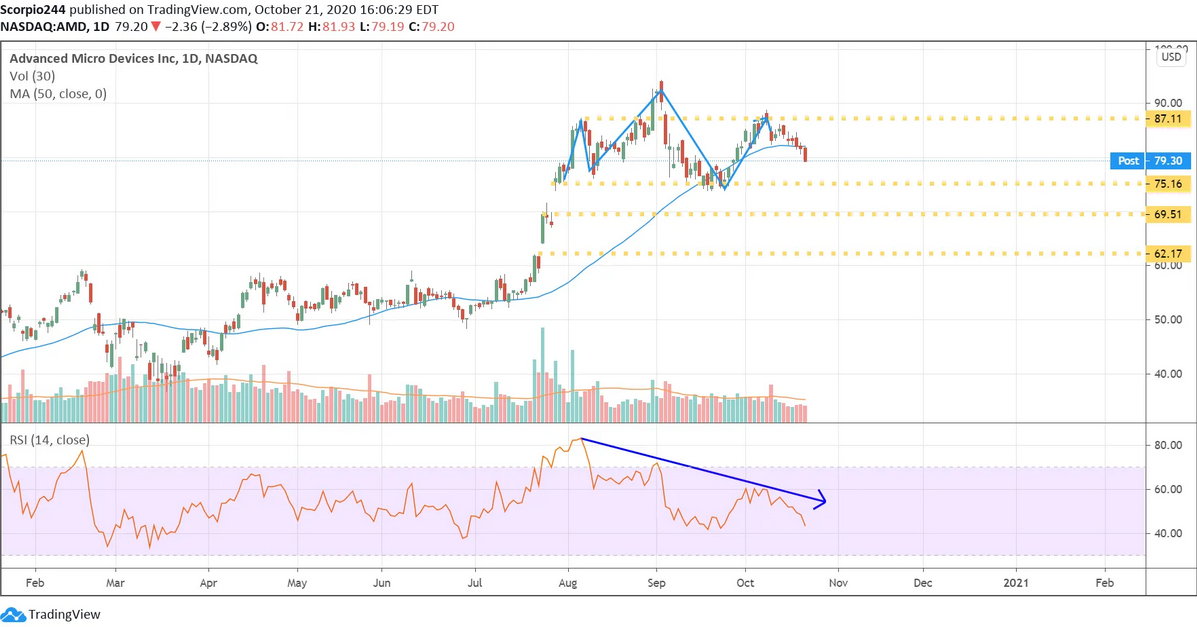
AMD is one of those chip stocks that keep on falling. Again, we will still need to break below $75 before knowing just how bad things will get. The RSI keeps telling us the same thing; lower prices are coming.
AMD Daily Chart

Netflix

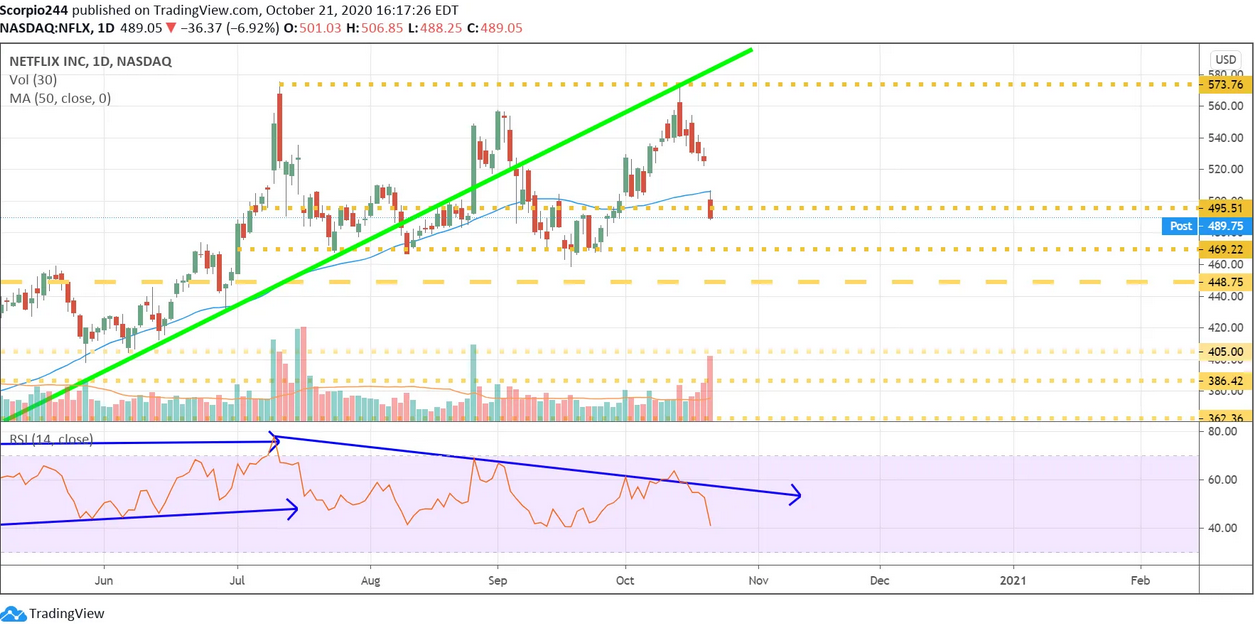
Netlfix had a weak day as expected. But the stock managed to fall below that critical level of support around $495, which likely sets up a further drop to around $470.
Netflix Daily Chart

Tesla

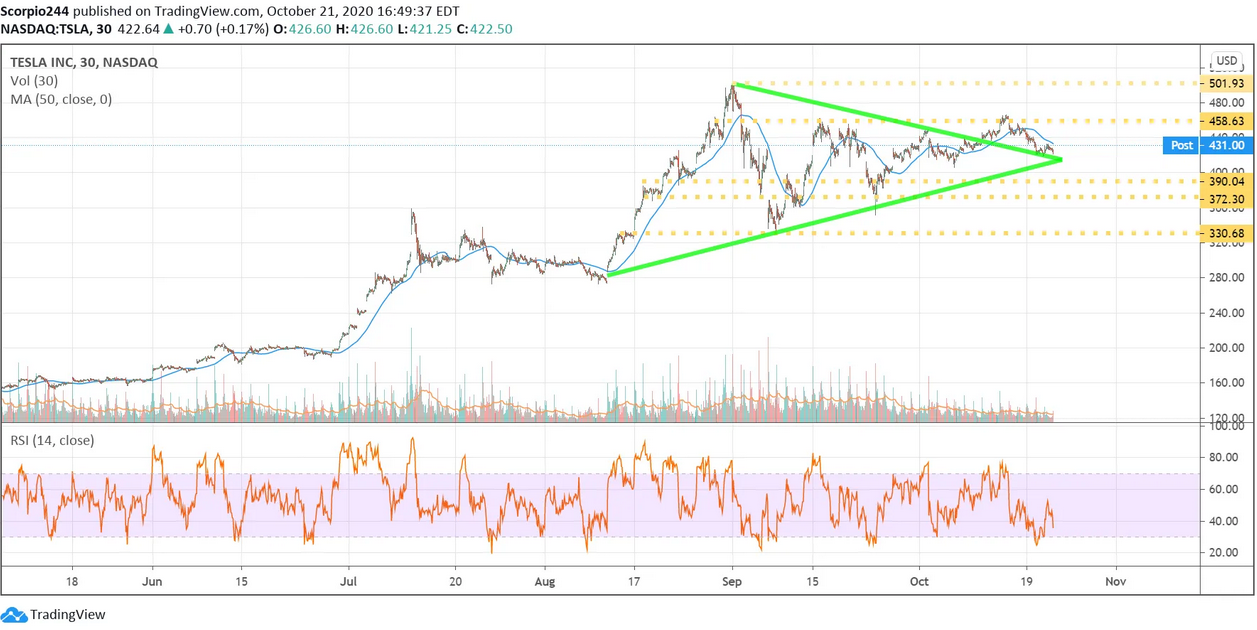
Tesla reported better than expected revenue and earnings while maintaining its full delivery guidance. The stock is trading up only modestly. I still think it is likely heading higher, towards $460. There was also a tremendous bet that suggests shares continue even higher towards $600 into June.
Tesla Inc Chart

Shopify

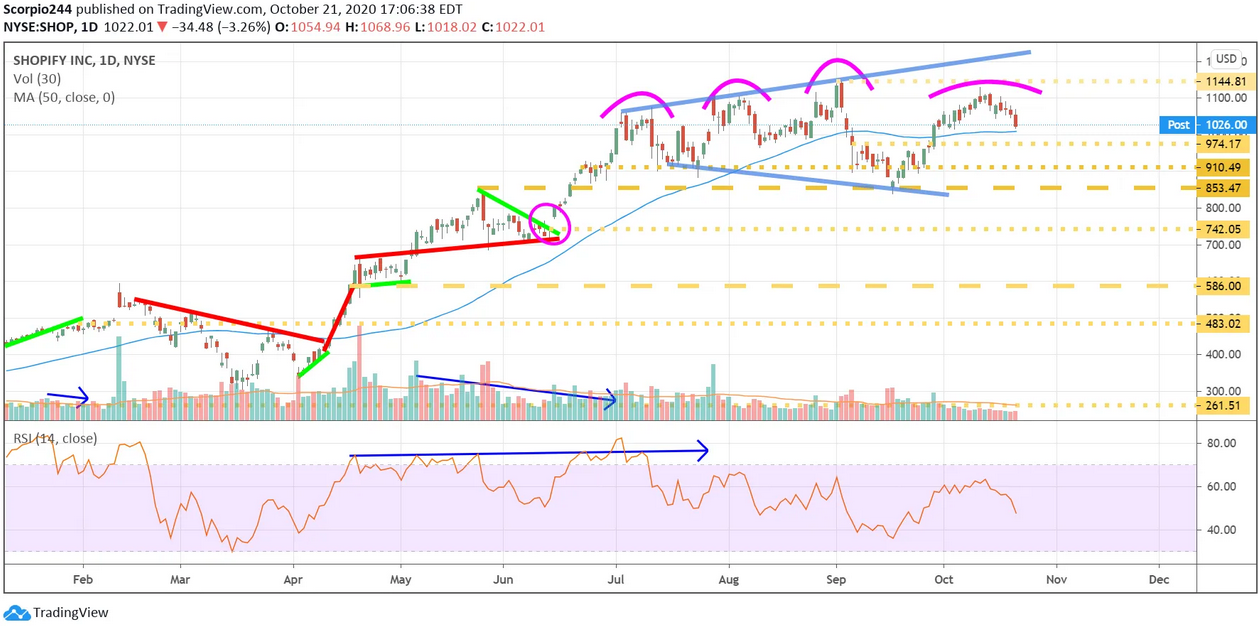
An interesting pattern forming in Shopify (NYSE:SHOP), a potential head and shoulders. It has a lot of the same characteristics as AMD.
Shopify Inc Daily Chart

Original Post

Latest comments

Loading next article…
Risk Disclosure: Trading in financial instruments and/or cryptocurrencies involves high risks including the risk of losing some, or all, of your investment amount, and may not be suitable for all investors. Prices of cryptocurrencies are extremely volatile and may be affected by external factors such as financial, regulatory or political events. Trading on margin increases the financial risks.
Before deciding to trade in financial instrument or cryptocurrencies you should be fully informed of the risks and costs associated with trading the financial markets, carefully consider your investment objectives, level of experience, and risk appetite, and seek professional advice where needed.
Fusion Media would like to remind you that the data contained in this website is not necessarily real-time nor accurate. The data and prices on the website are not necessarily provided by any market or exchange, but may be provided by market makers, and so prices may not be accurate and may differ from the actual price at any given market, meaning prices are indicative and not appropriate for trading purposes. Fusion Media and any provider of the data contained in this website will not accept liability for any loss or damage as a result of your trading, or your reliance on the information contained within this website.
It is prohibited to use, store, reproduce, display, modify, transmit or distribute the data contained in this website without the explicit prior written permission of Fusion Media and/or the data provider. All intellectual property rights are reserved by the providers and/or the exchange providing the data contained in this website.
Fusion Media may be compensated by the advertisers that appear on the website, based on your interaction with the advertisements or advertisers.
© 2007-2025 - Fusion Media Limited. All Rights Reserved.