Stocks March Higher With More To Come The Week Of December 23

Published 12/22/2019, 05:00 AM
Updated 11/16/2024, 07:53 AM
US500
-
T
-
MU
-
AMD
-
NFLX
-
TSLA
-
IWM
-

For most people the flu would be enough to sideline them, but even with a 102 fever the Monster Market Commentary gets pushed out because the market waits for no one.

S&P 500 (SPY)

Stocks continued to push higher this past week, with the S&P 500 rising to 3,220. The index managed to avoid the potential rising wedge pattern; I was watching, and instead pushed higher above the upper end of the trading channel that formed on November 4. The good news is that stocks are likely to continue to rise this week with the potential for the S&P 500 to rise to around 3,255.
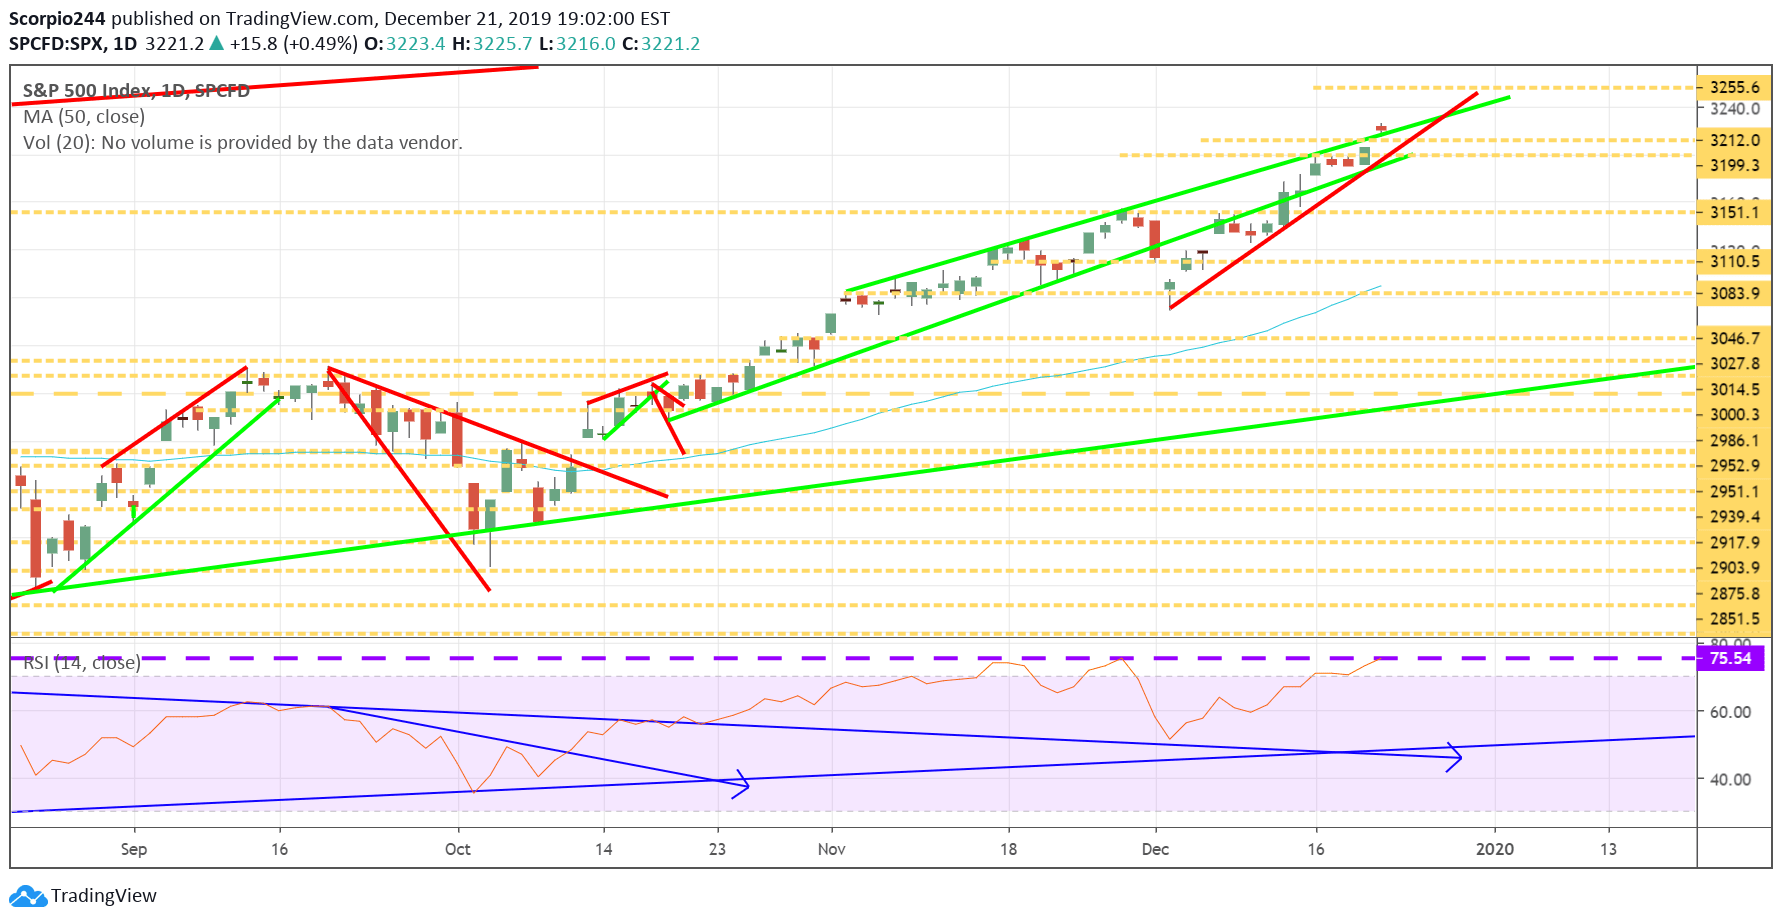
S&P 500 Daily Chart

Russell (IWM)

The Russell also finished the week off higher, closing right at resistance at 1673. I continue to prefer the Russell over the S&P 500 into year-end. I think Russell can rise to around 1710, and it has more ground it needs to cover. That is likely one reason why I have held on to my January $166 IWM calls.
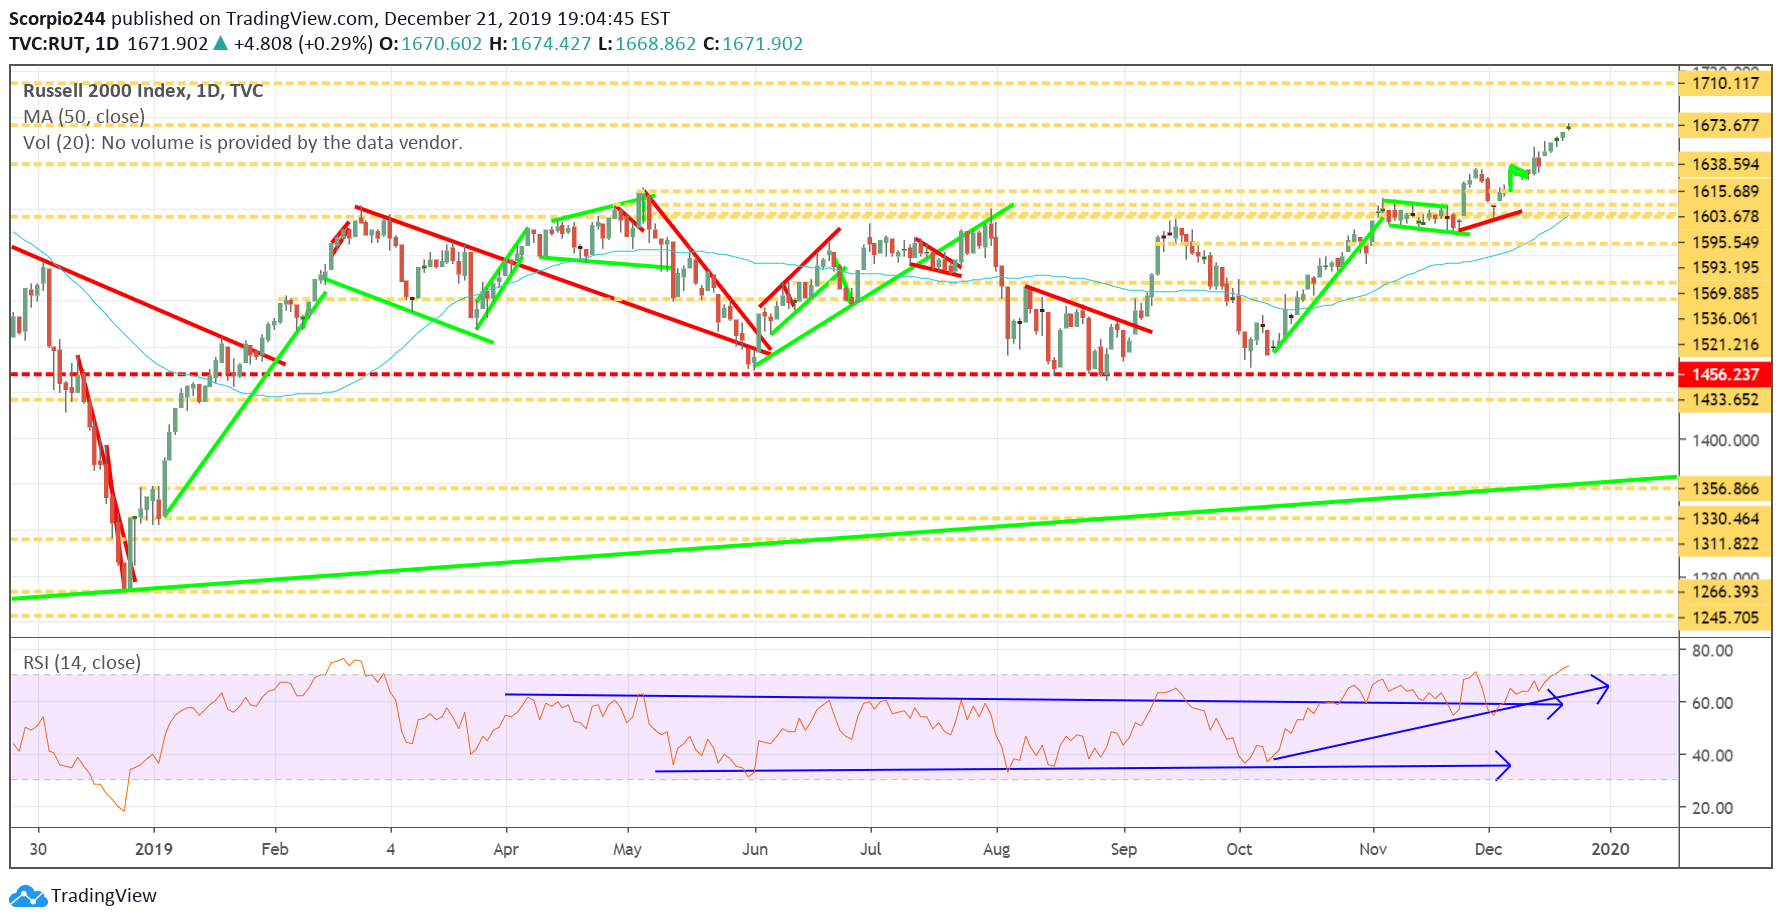
Russsell 2000 Index Daily Chart

Netflix (NFLX)

Netflix (NASDAQ:NFLX) had a great week rising back to resistance at $336. I had noted earlier this week in a mid-day commentary that I thought if the stock could get over $336, it could look to fill the gap up to $362.
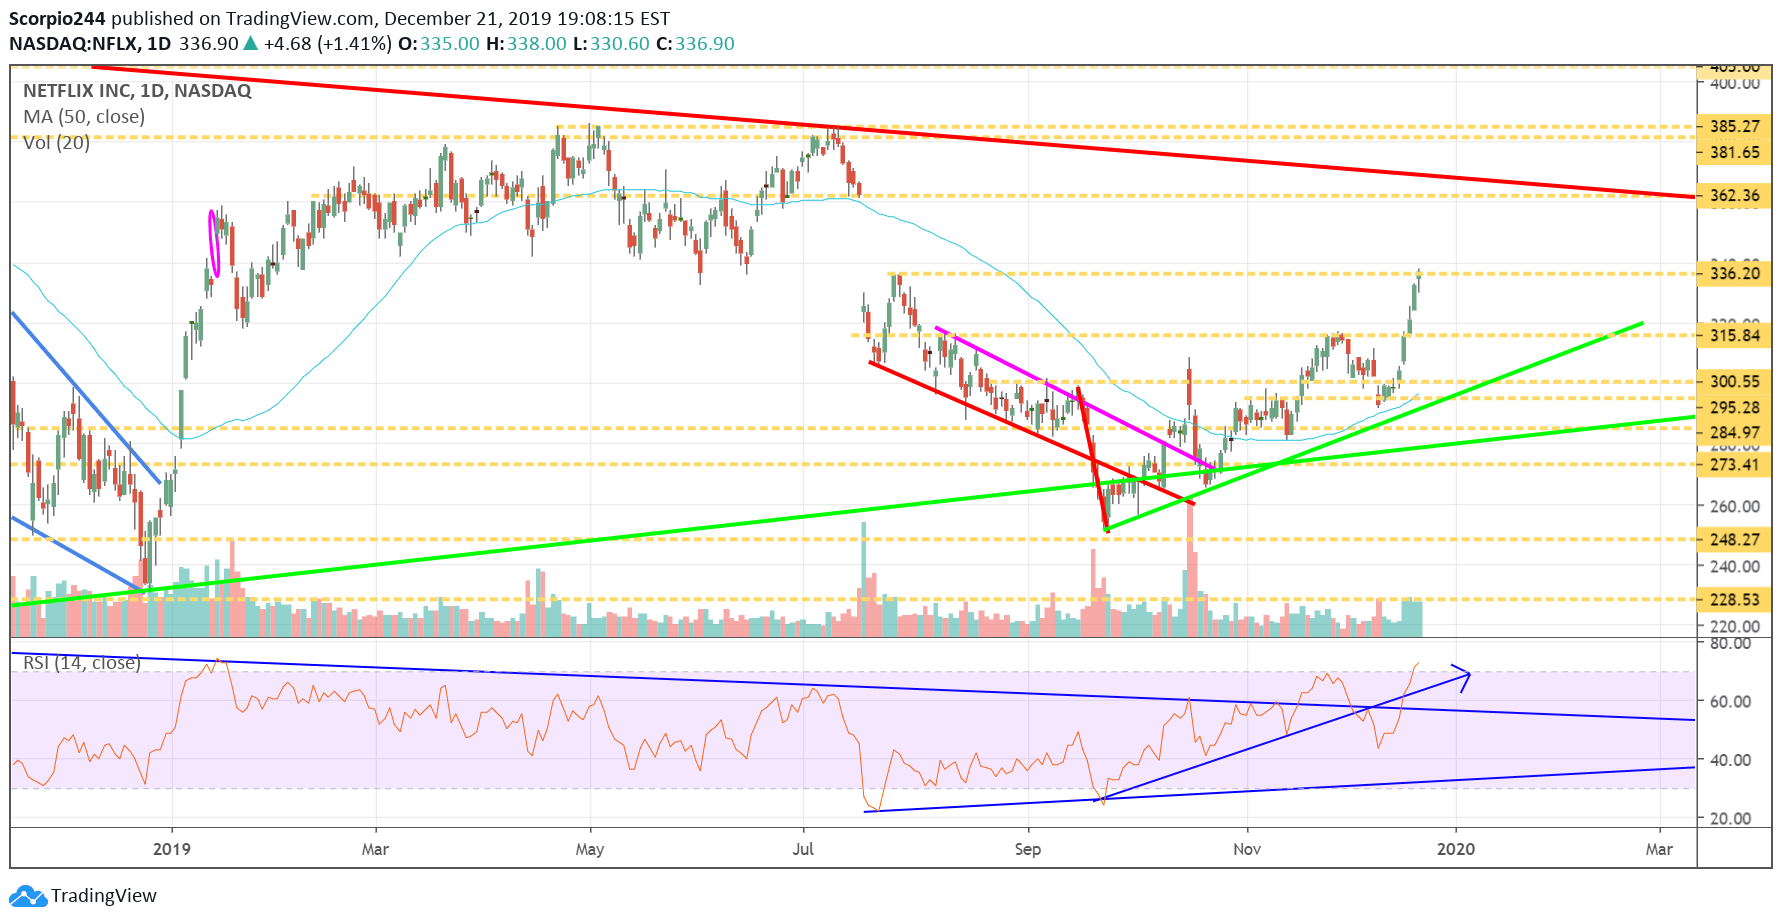
Netflix Daily Chart

Tesla (TSLA)

Tesla (NASDAQ:TSLA) is also rocketing higher, and based on some bullish options activity and the chart, I think there is a chance to increase to $423.
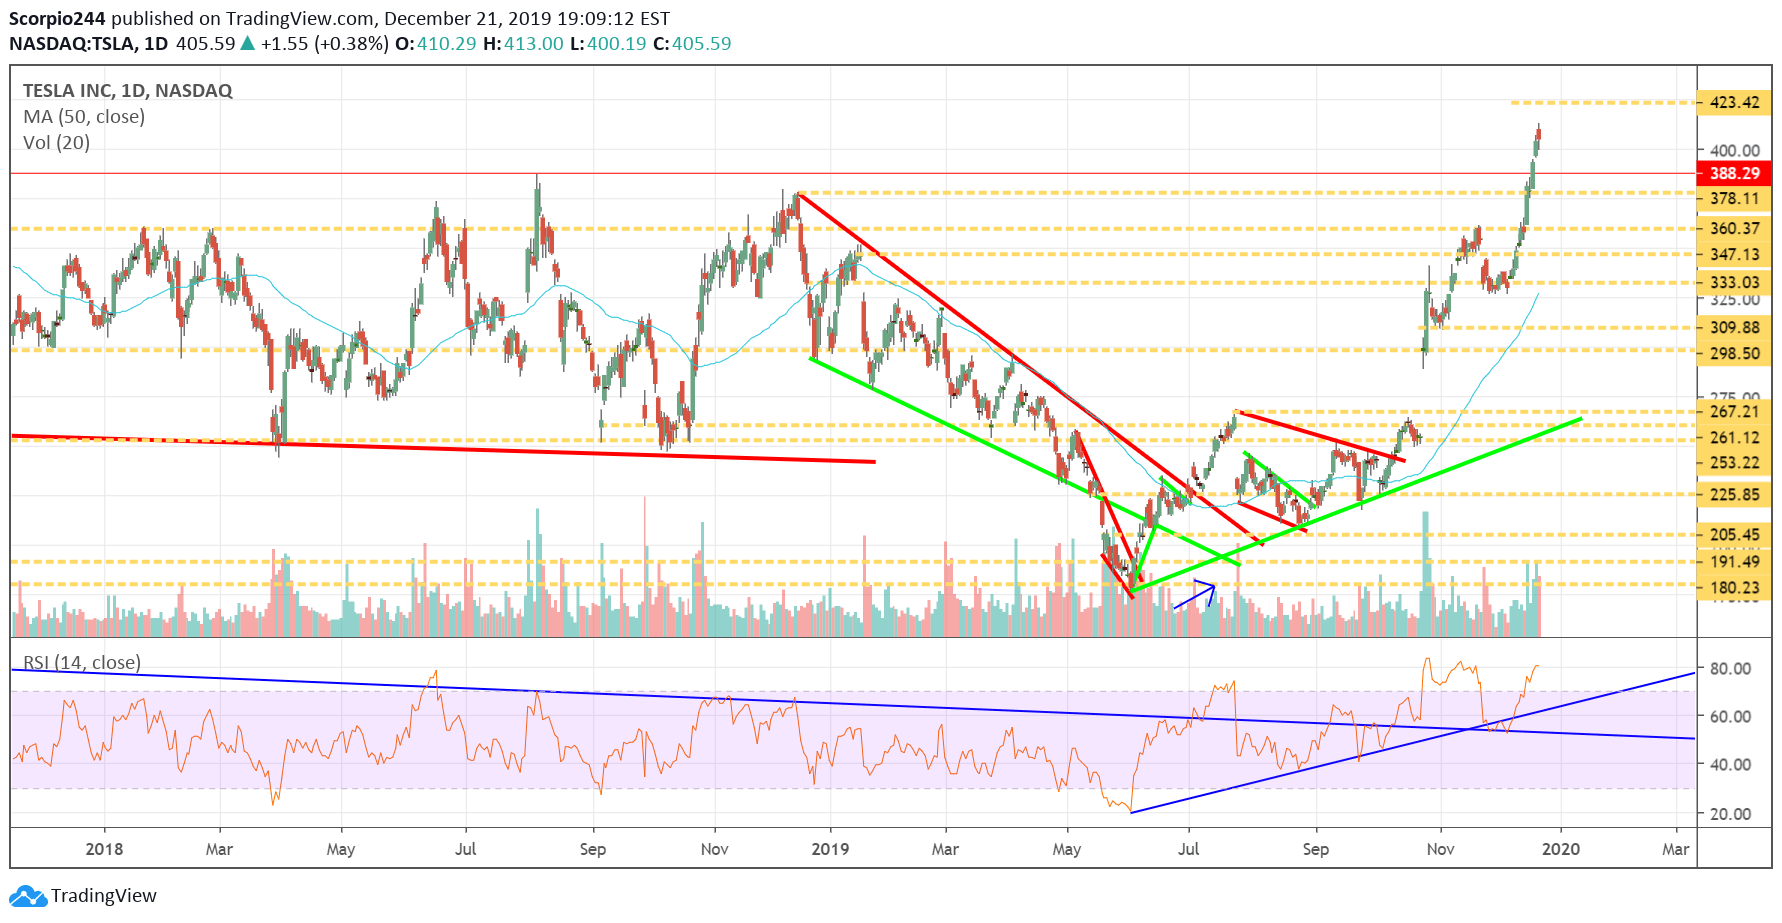
Tesla Inc Daily Chart

AMD (AMD)

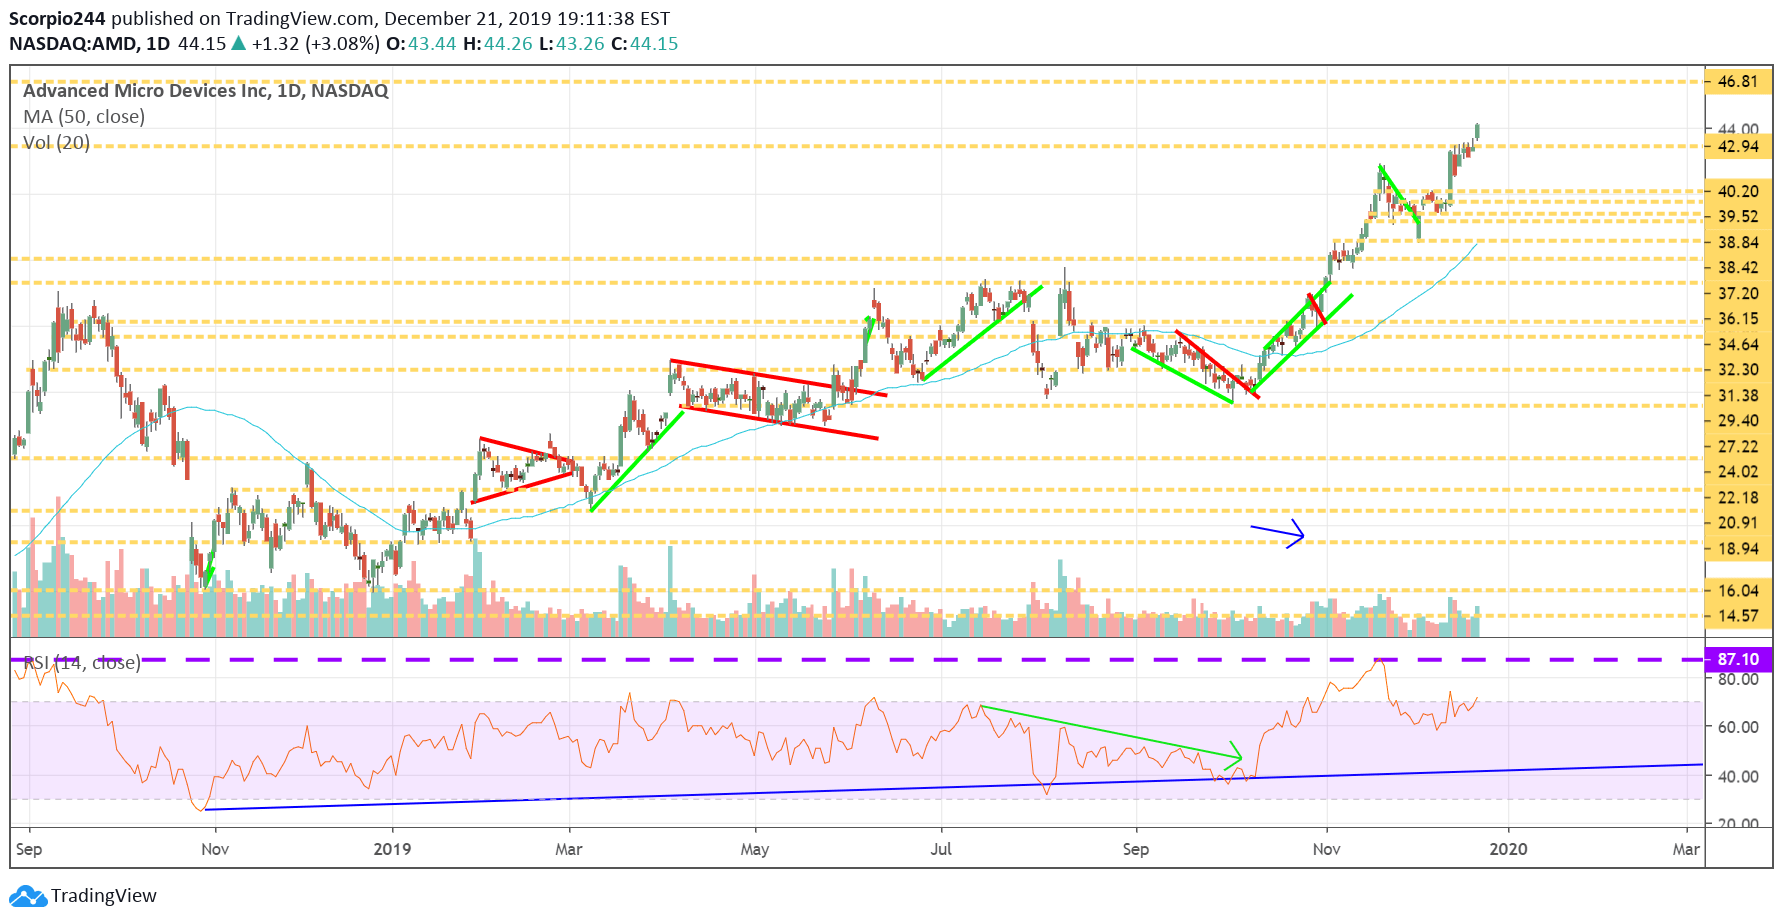
Advanced Micro Devices (NASDAQ:AMD) rose above $43 this past week, and now it stands a chance to push higher to $46.80.
AMD Inc Daily Chart

AT&T (T)

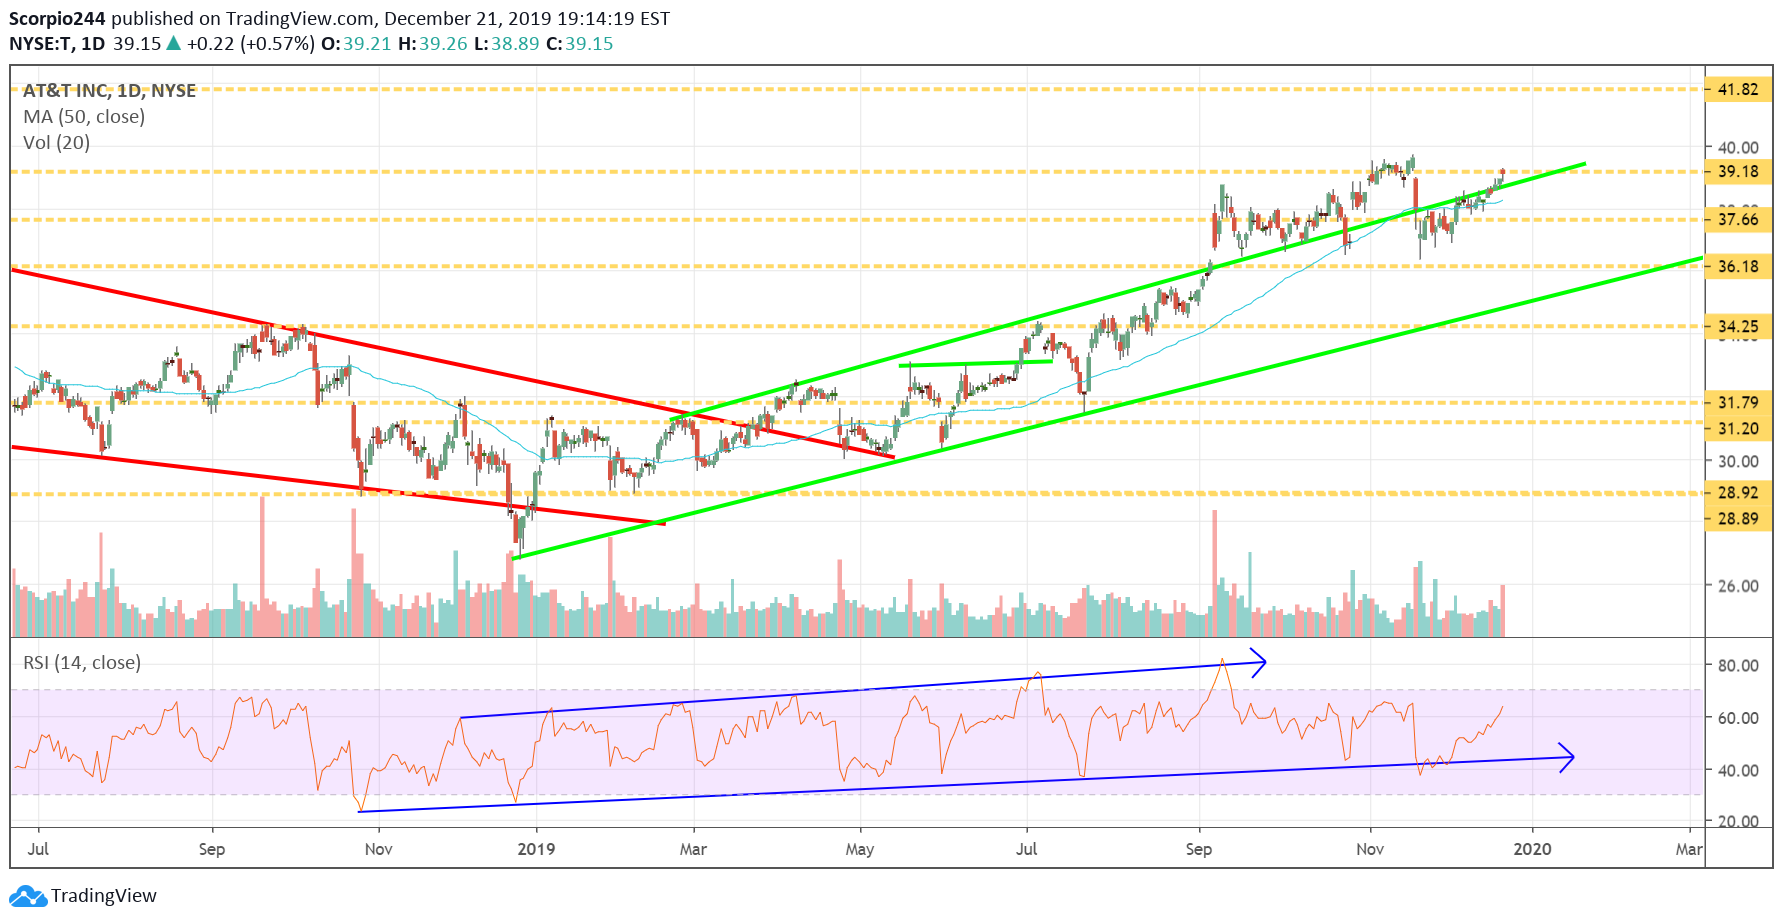
AT&T (NYSE:T) has been steadily trending higher, and if it can clear $39.25, then perhaps it pushes to $41.80.
AT&T Inc Daily Chart

Micron (MU)

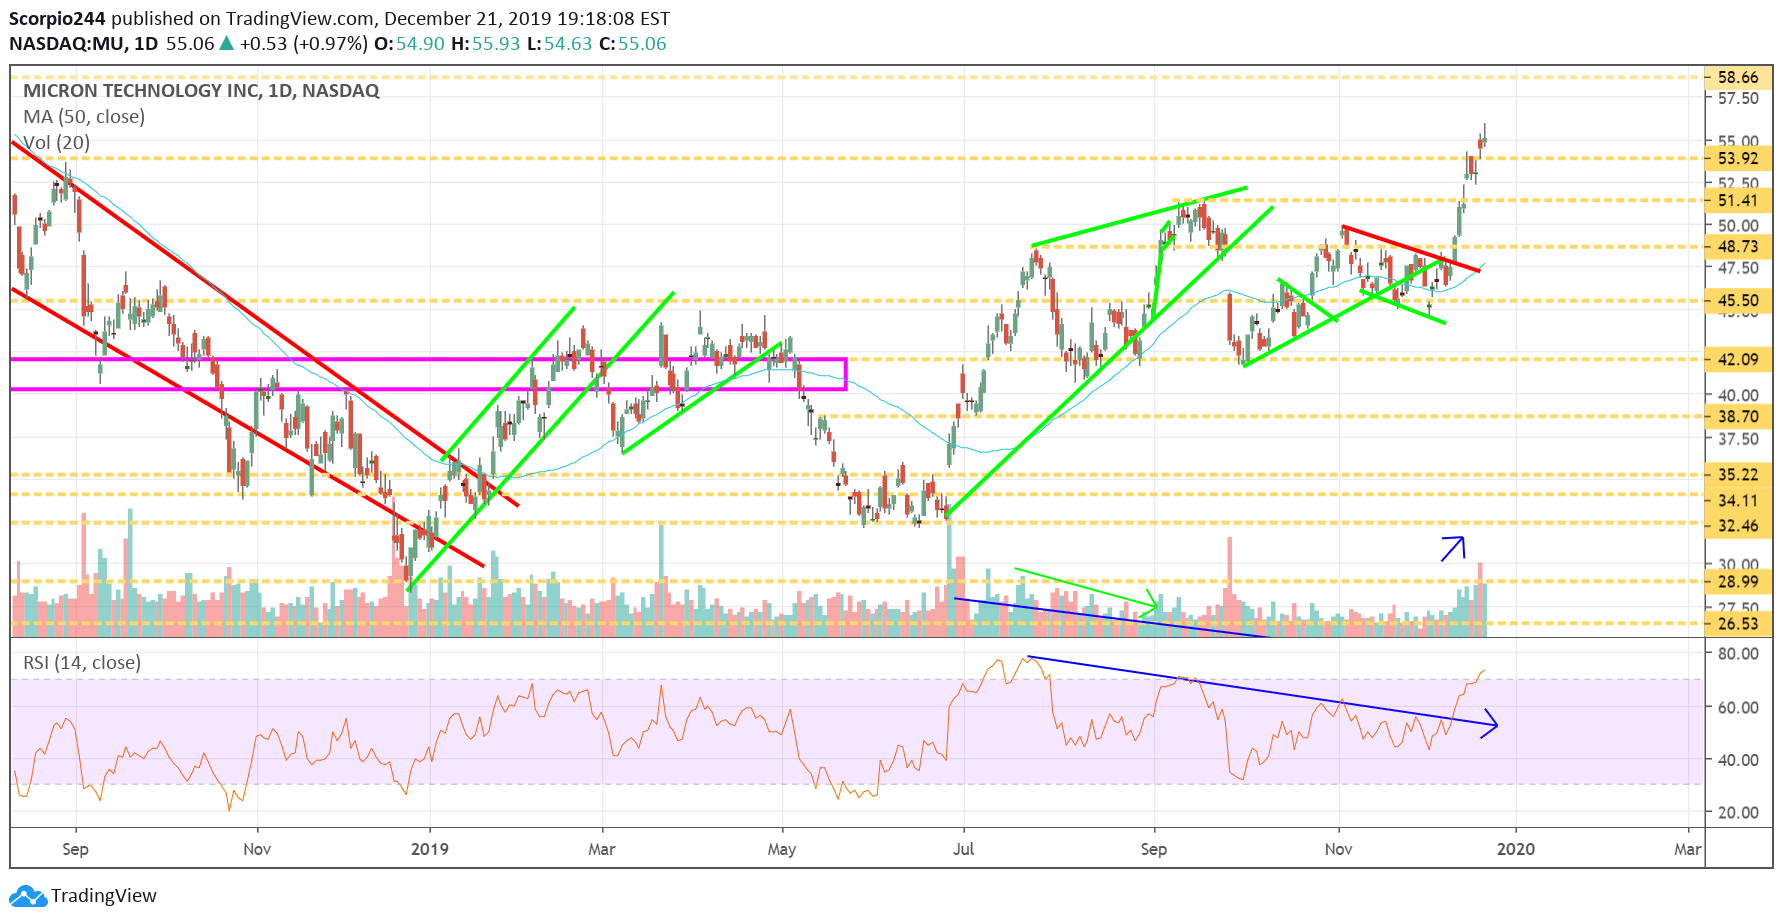
Micron (NASDAQ:MU) also had a good week, after its quarterly results and like the options traders were betting, the stock climbed. Now, $58.65 is the next level to watch for.
Micron Inc Daily Chart

Original Post

Latest comments

Loading next article…
Risk Disclosure: Trading in financial instruments and/or cryptocurrencies involves high risks including the risk of losing some, or all, of your investment amount, and may not be suitable for all investors. Prices of cryptocurrencies are extremely volatile and may be affected by external factors such as financial, regulatory or political events. Trading on margin increases the financial risks.
Before deciding to trade in financial instrument or cryptocurrencies you should be fully informed of the risks and costs associated with trading the financial markets, carefully consider your investment objectives, level of experience, and risk appetite, and seek professional advice where needed.
Fusion Media would like to remind you that the data contained in this website is not necessarily real-time nor accurate. The data and prices on the website are not necessarily provided by any market or exchange, but may be provided by market makers, and so prices may not be accurate and may differ from the actual price at any given market, meaning prices are indicative and not appropriate for trading purposes. Fusion Media and any provider of the data contained in this website will not accept liability for any loss or damage as a result of your trading, or your reliance on the information contained within this website.
It is prohibited to use, store, reproduce, display, modify, transmit or distribute the data contained in this website without the explicit prior written permission of Fusion Media and/or the data provider. All intellectual property rights are reserved by the providers and/or the exchange providing the data contained in this website.
Fusion Media may be compensated by the advertisers that appear on the website, based on your interaction with the advertisements or advertisers.
© 2007-2025 - Fusion Media Limited. All Rights Reserved.