🐂 Not all bull runs are created equal. November’s AI picks include 5 stocks up +20% eachUnlock Stocks

Stocks Jump As Junk Slumps

Published 06/30/2020, 04:27 AM
Updated 09/20/2023, 06:34 AM
US500
-
SPY
-
MU
-
ESZ24
-
TSLA
-
US10YT=X
-
META
-
HYG
-
JNK
-

It wasn’t the most vigorous trading session despite a 1% rally in the S&P 500. The real action came in the after-hours when it rallied another 50 or so basis points after Powells issued a statement ahead of his testimony for Congress. There was nothing new said, but still, the algo’s took the index up. It will give us a chance to find out if the market can advance much beyond 3050 or not. For now, the futures have been unable to advance beyond that level of resistance.
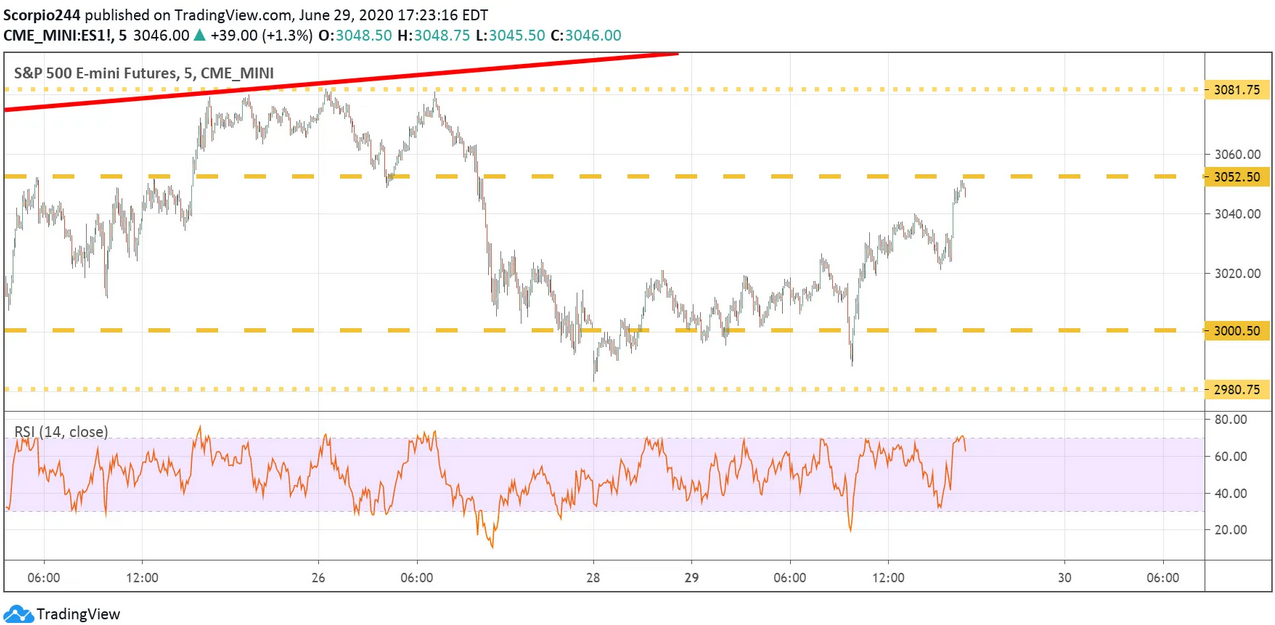
S&P 500 Emini Futures Chart

The 10-year yield fell below support at 63 basis point late yesterday, and I think that is a negative sign for the yields and potential the equity market. It likely suggests the 10-year drops to around 55bps.
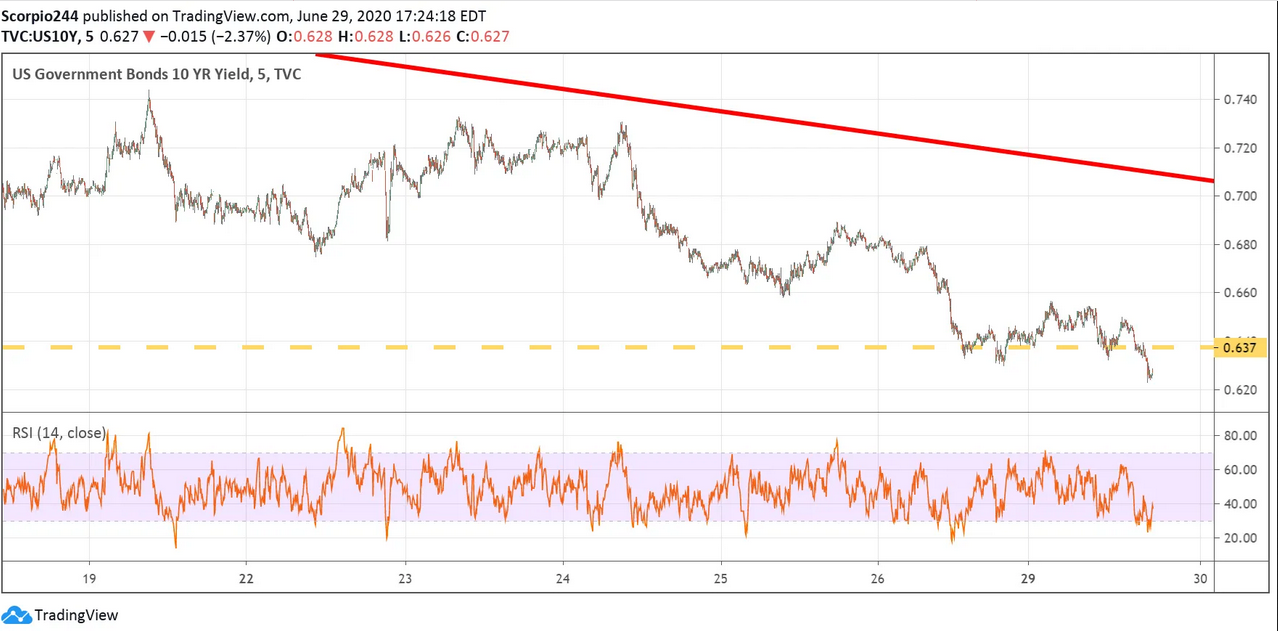
US Govt Bonds 10 Yr Yield Chart

I am a little bit concerned that the HYG and JNK ETF’s are trending lower as the yields are moving lower too. The falling ETF values indicate higher yields for the ETFs. That means spreads are widening, and that usually isn’t a good sign for equities.
Facebook Inc Chart

Micron

Micron (NASDAQ:MU) reported better than expected results and gave better guidance, which was surprising to me. It wasn’t what I was expecting. For now, the stock has jumped to technical resistance at $52.75 and failed at the moment. We will see what happens during the normal trading session. This stock doesn’t have the greatest history of holding post-earnings rallies. Plus, $52.75 has been a tough level for some time.
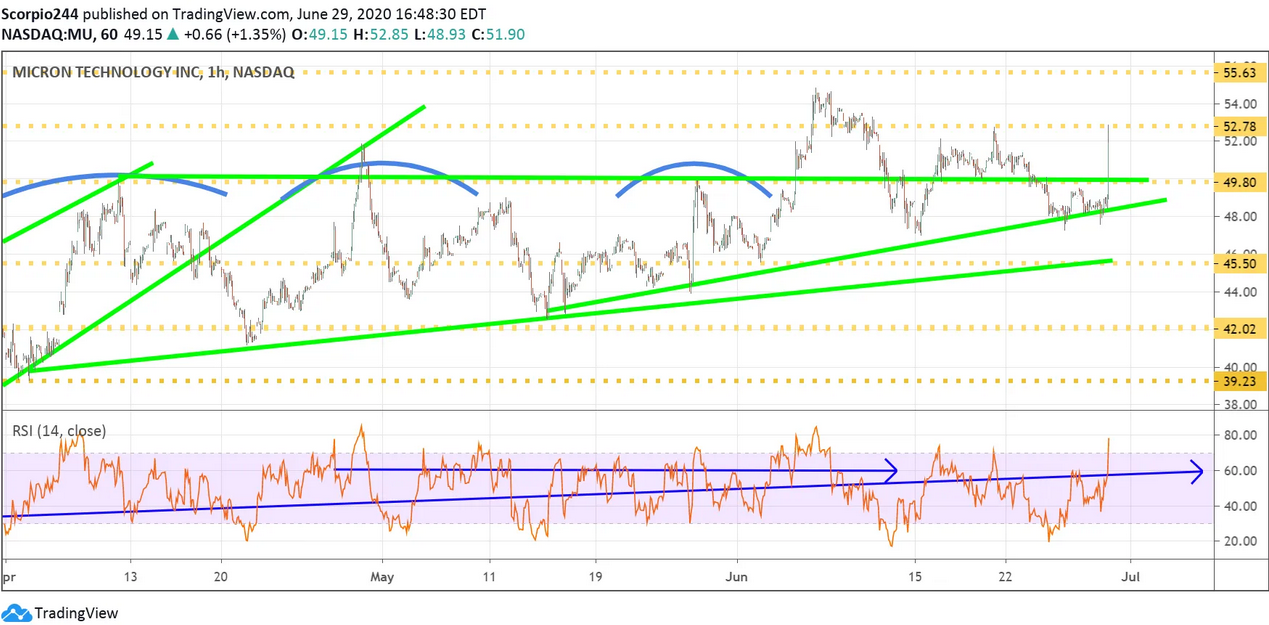
Micron Tech Hourly Chart

Facebook

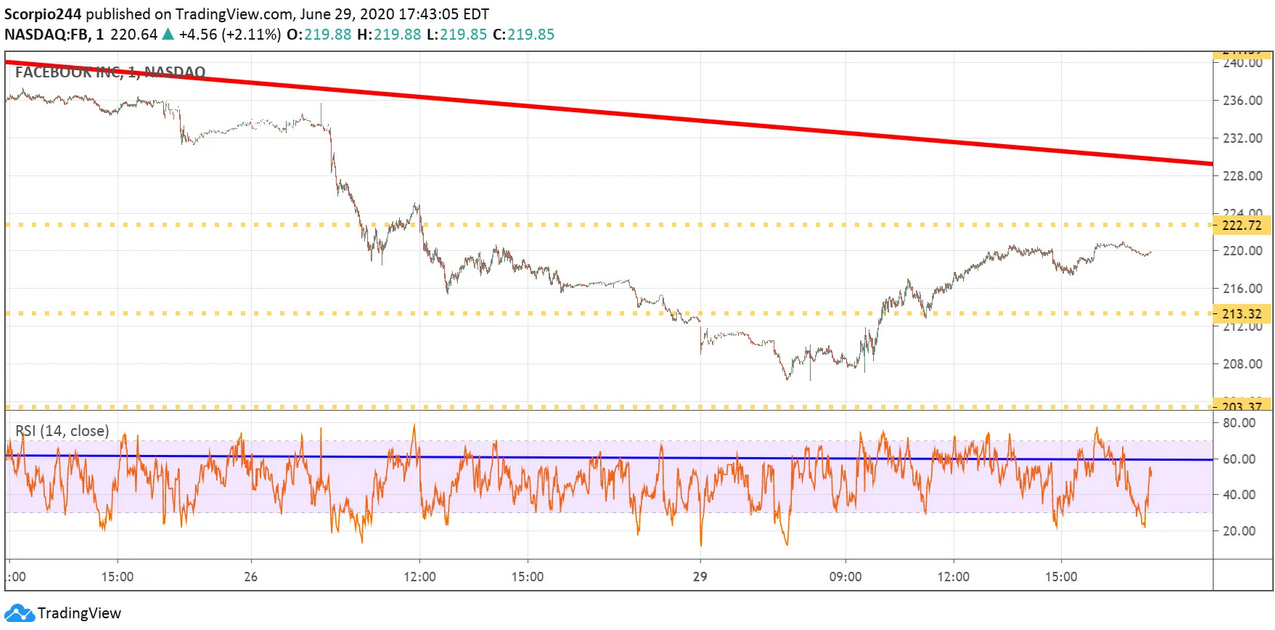
A bunch of other companies decided they were going to start pulling ads from Facebook (NASDAQ:FB) as well. The stock’s next significant level is at $222.
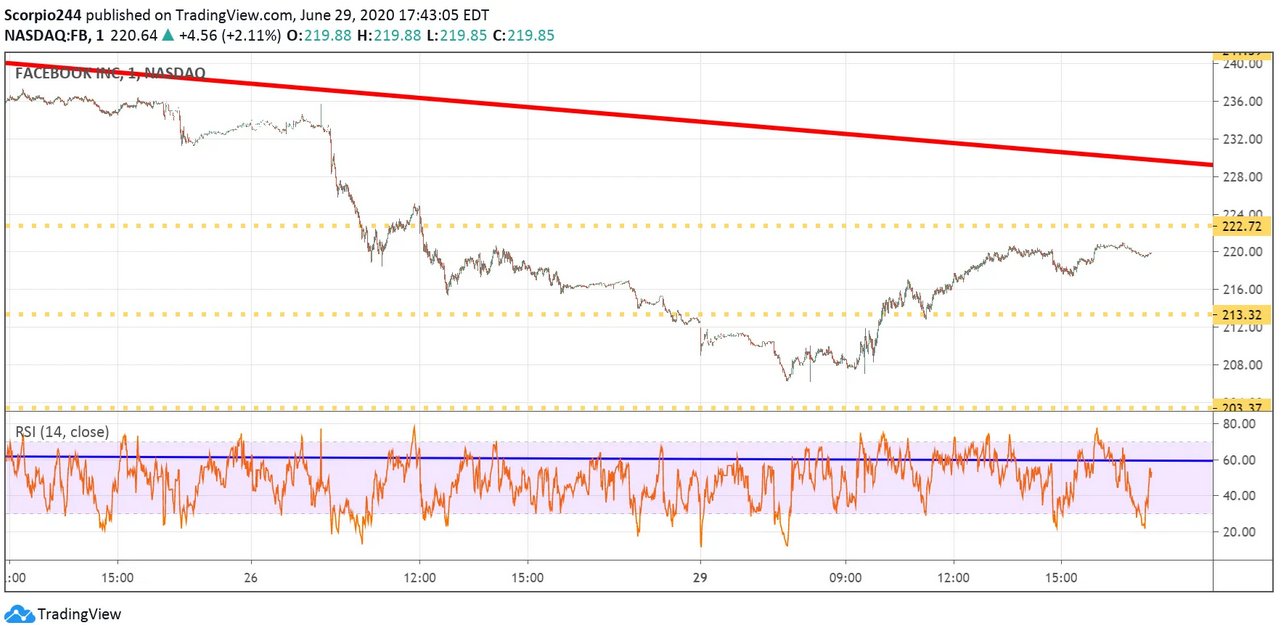
FB 1 Hr Chart

Tesla

Tesla (NASDAQ:TSLA) looks as if it may getting ready for its next leg higher, potential to as high as $1200. The company is nearing profitably for the quarter, according to reports.
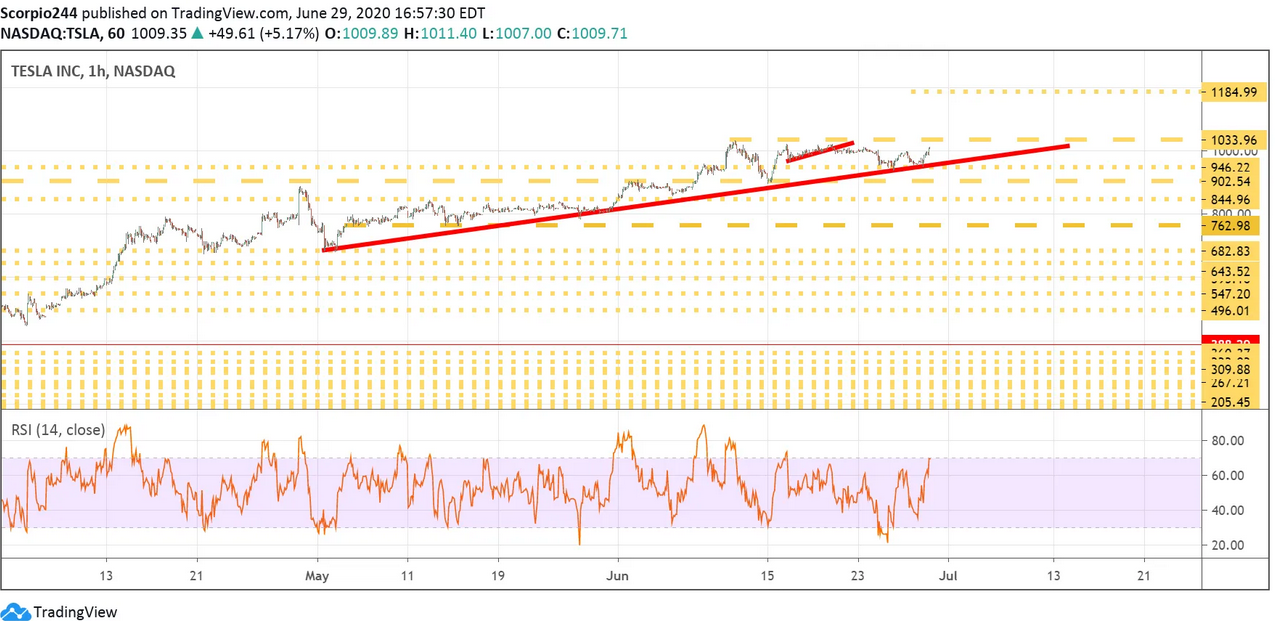
Tesla Inc Hourly Chart

Original Post

Latest comments

Loading next article…
Risk Disclosure: Trading in financial instruments and/or cryptocurrencies involves high risks including the risk of losing some, or all, of your investment amount, and may not be suitable for all investors. Prices of cryptocurrencies are extremely volatile and may be affected by external factors such as financial, regulatory or political events. Trading on margin increases the financial risks.
Before deciding to trade in financial instrument or cryptocurrencies you should be fully informed of the risks and costs associated with trading the financial markets, carefully consider your investment objectives, level of experience, and risk appetite, and seek professional advice where needed.
Fusion Media would like to remind you that the data contained in this website is not necessarily real-time nor accurate. The data and prices on the website are not necessarily provided by any market or exchange, but may be provided by market makers, and so prices may not be accurate and may differ from the actual price at any given market, meaning prices are indicative and not appropriate for trading purposes. Fusion Media and any provider of the data contained in this website will not accept liability for any loss or damage as a result of your trading, or your reliance on the information contained within this website.
It is prohibited to use, store, reproduce, display, modify, transmit or distribute the data contained in this website without the explicit prior written permission of Fusion Media and/or the data provider. All intellectual property rights are reserved by the providers and/or the exchange providing the data contained in this website.
Fusion Media may be compensated by the advertisers that appear on the website, based on your interaction with the advertisements or advertisers.
© 2007-2024 - Fusion Media Limited. All Rights Reserved.