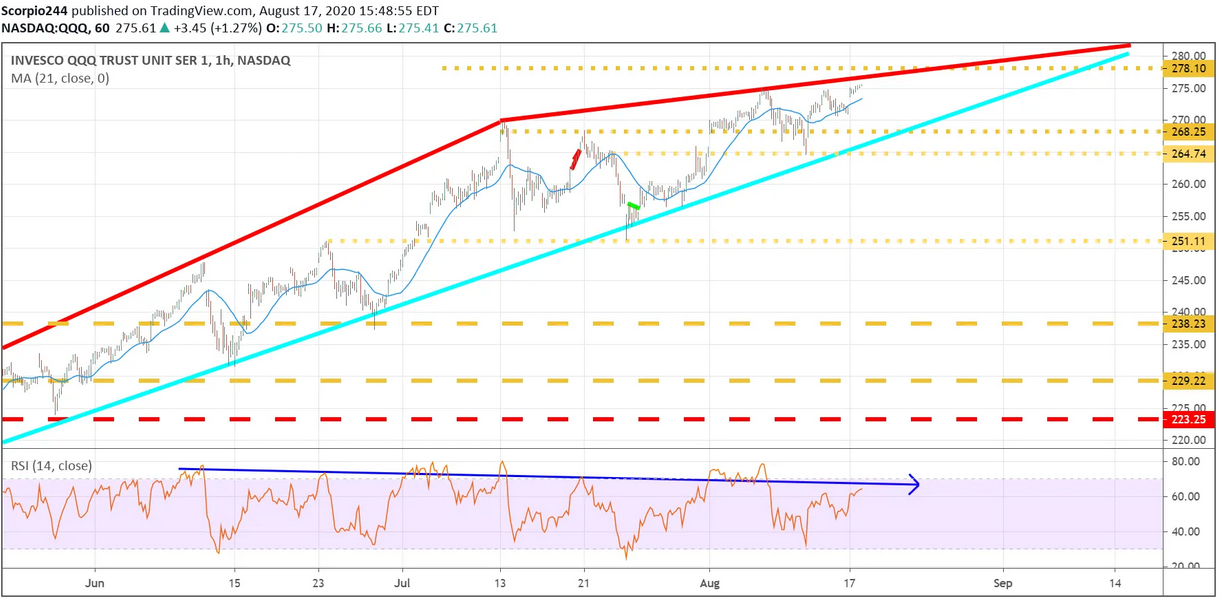
The market continues to be range-bound, with the proxy for the NASDAQ ETF, the QQQ, rising by 1.2%. Still, it remained around that $275 level, which it has been stuck since early August.
From the standpoint of what happens next, at this point, I can’t find one bullish indicator that I track. Options betting continues to build, suggesting lower prices lie ahead, gamma levels are also suggesting upside in this market is completely limited. I talked about this in the morning and midday update. In 2019, we always had that backdrop of a favorable valuation based on earnings, but this year that crutch is gone. Low-interest rates are great, but they are low for a reason. The equity risk premium is favorable to the market, but is that what this has come too? Just multiple expansion? Not exactly an ideal situation to be in if you ask me.
The current path from a purely technical standpoint gets the QQQs to no higher than $280, by the middle of September, then everything will converge. That is about 1.9% higher from its current spot.
S&P 500
Still, no gap fill in the S&P 500. Ugh. Not what we wanted to see. But it doesn’t go higher either.
Amazon
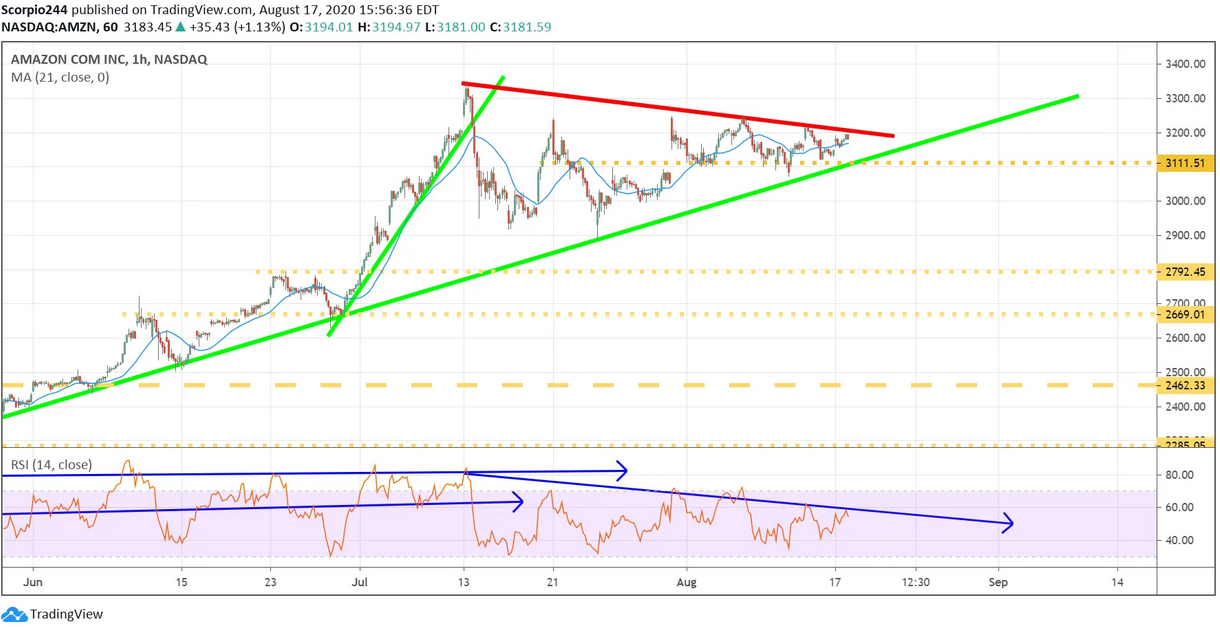
Amazon (NASDAQ:AMZN) continues to trade in this triangle; for now, I guess that we will have a breakout or break down in about three days. The RSI is telling us what direction is to come.
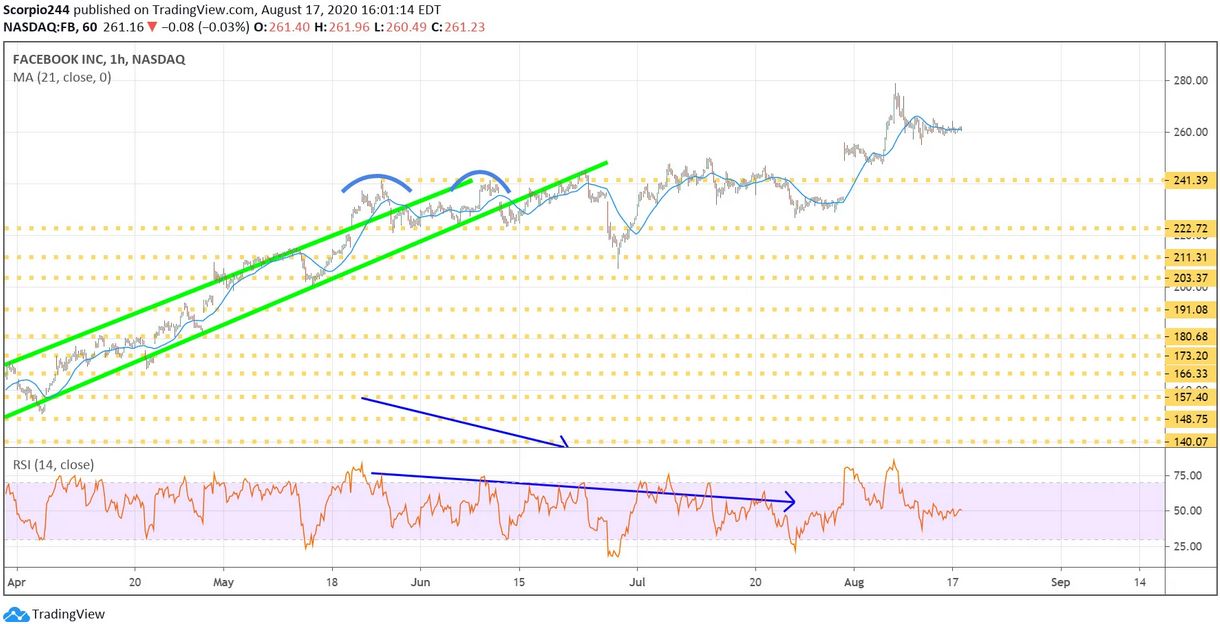
I saw some bullish option betting on Facebook (NASDAQ:FB), which suggests the stock continues to climb. I noted in an article for Forbes. It’s possible, but the shares move higher is a story of multiple expansion. So as long as investors are willing to pay a higher multiple for the stock, then things will be beautiful. But gaps do eventually get filled, remember that.
Square
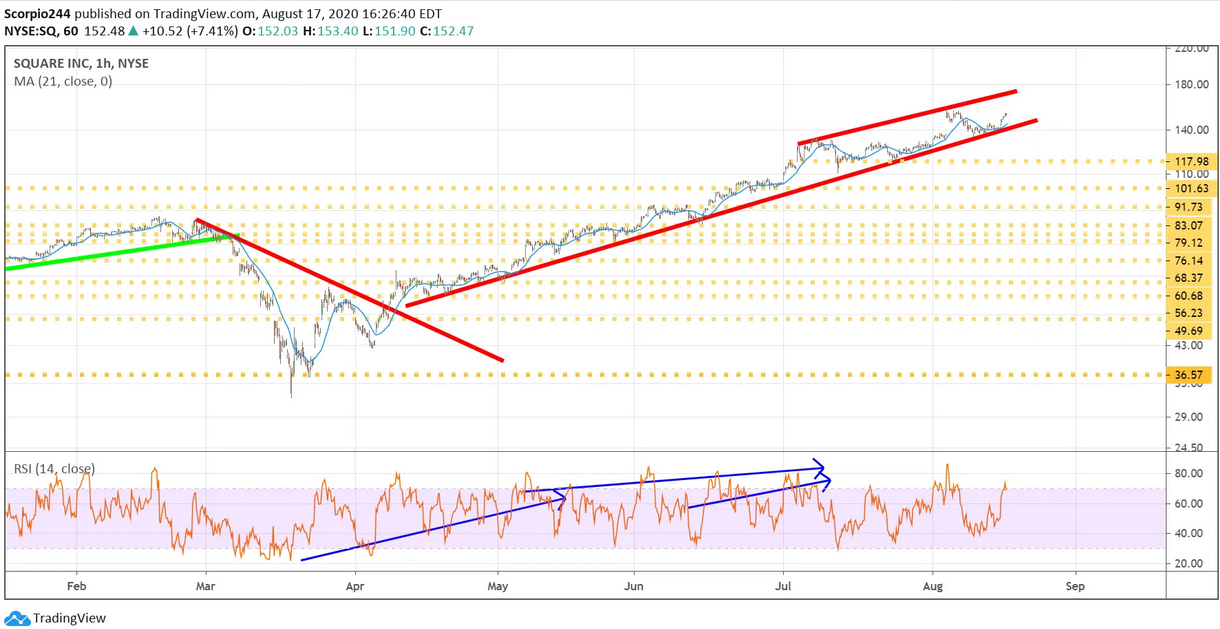
Square keeps going higher, and so it might as well go to that upper end of the trading channel around $170.
PayPal
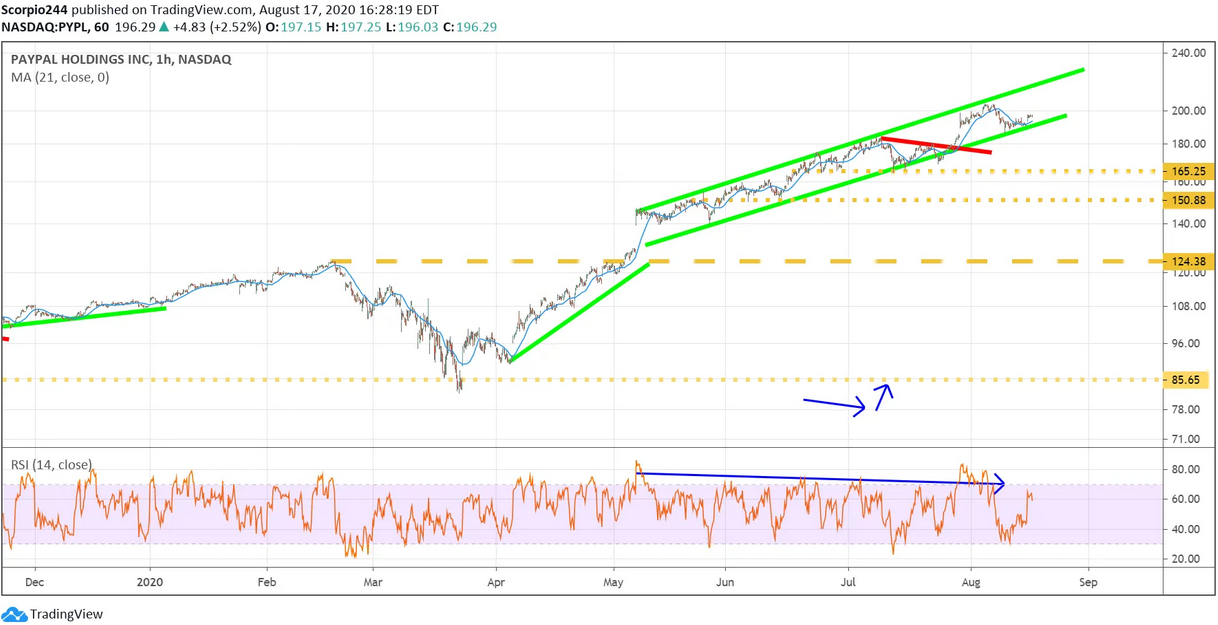
I heard that stocks only go up, and PayPal seems to be one of those stocks. So sure, why not, $220 seems like a great spot to go.
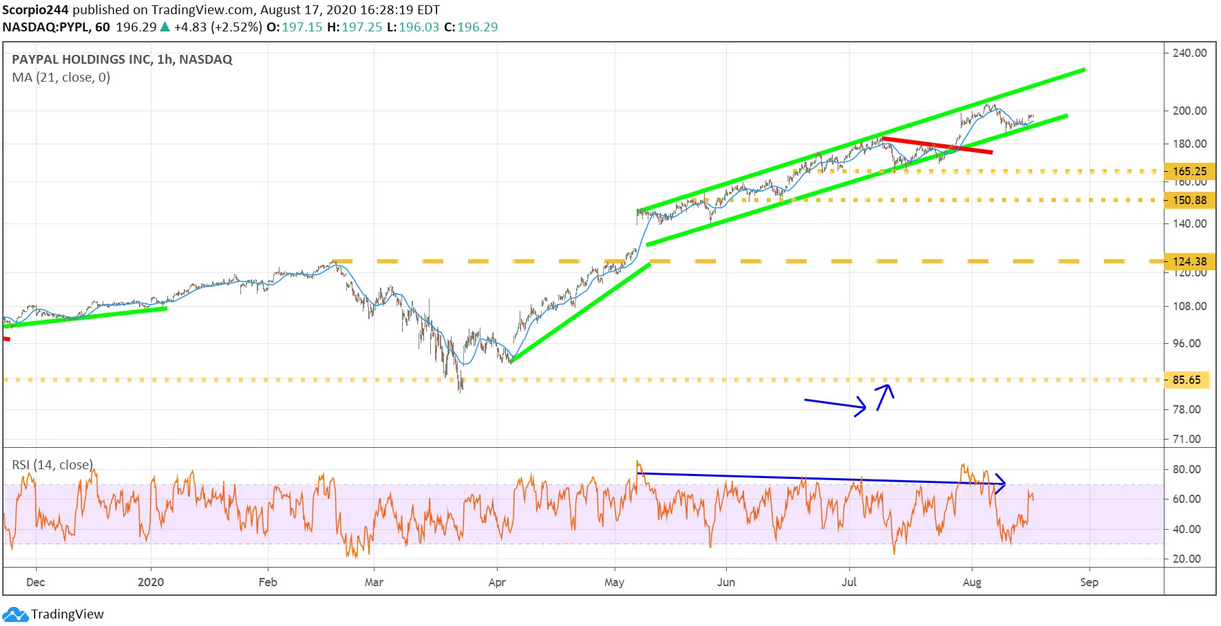
But in all seriousness, both PayPal and Square are great stories. Their valuations, that’s another story. PayPal has a market cap that is that same size as Bank of America (NYSE:BAC), around $230 billion. I’m not sure what the right valuation for PayPal is, to be honest. It could be the case that the stock is worth 35 times 2022 earnings estimates. Hey, why, not. Look at Square; it makes Paypal look cheap, trading at 84 times 2022 earnings estimates.
