Stocks Fell on April 20, Are They Now Ready To Roll Over?

Published 04/21/2020, 12:45 AM
Updated 11/16/2024, 07:53 AM
US500
-
INTC
-
JPM
-
QQQ
-
AMZN
-
CL
-
NFLX
-
SQ
-

Stocks finished the day lower by a modest 1.8% on the S&P 500. In regular times, that would be a lot, but these days aren’t normal times by any stretch of the imagination. How could they be when the front-month contract for oil fell to NEGATIVE $36. That’s right; the buyer of oil got paid to take it off the seller’s hand—strange world. It just goes to show you how much supply there is versus the weak demand, and nowhere to store the stuff.
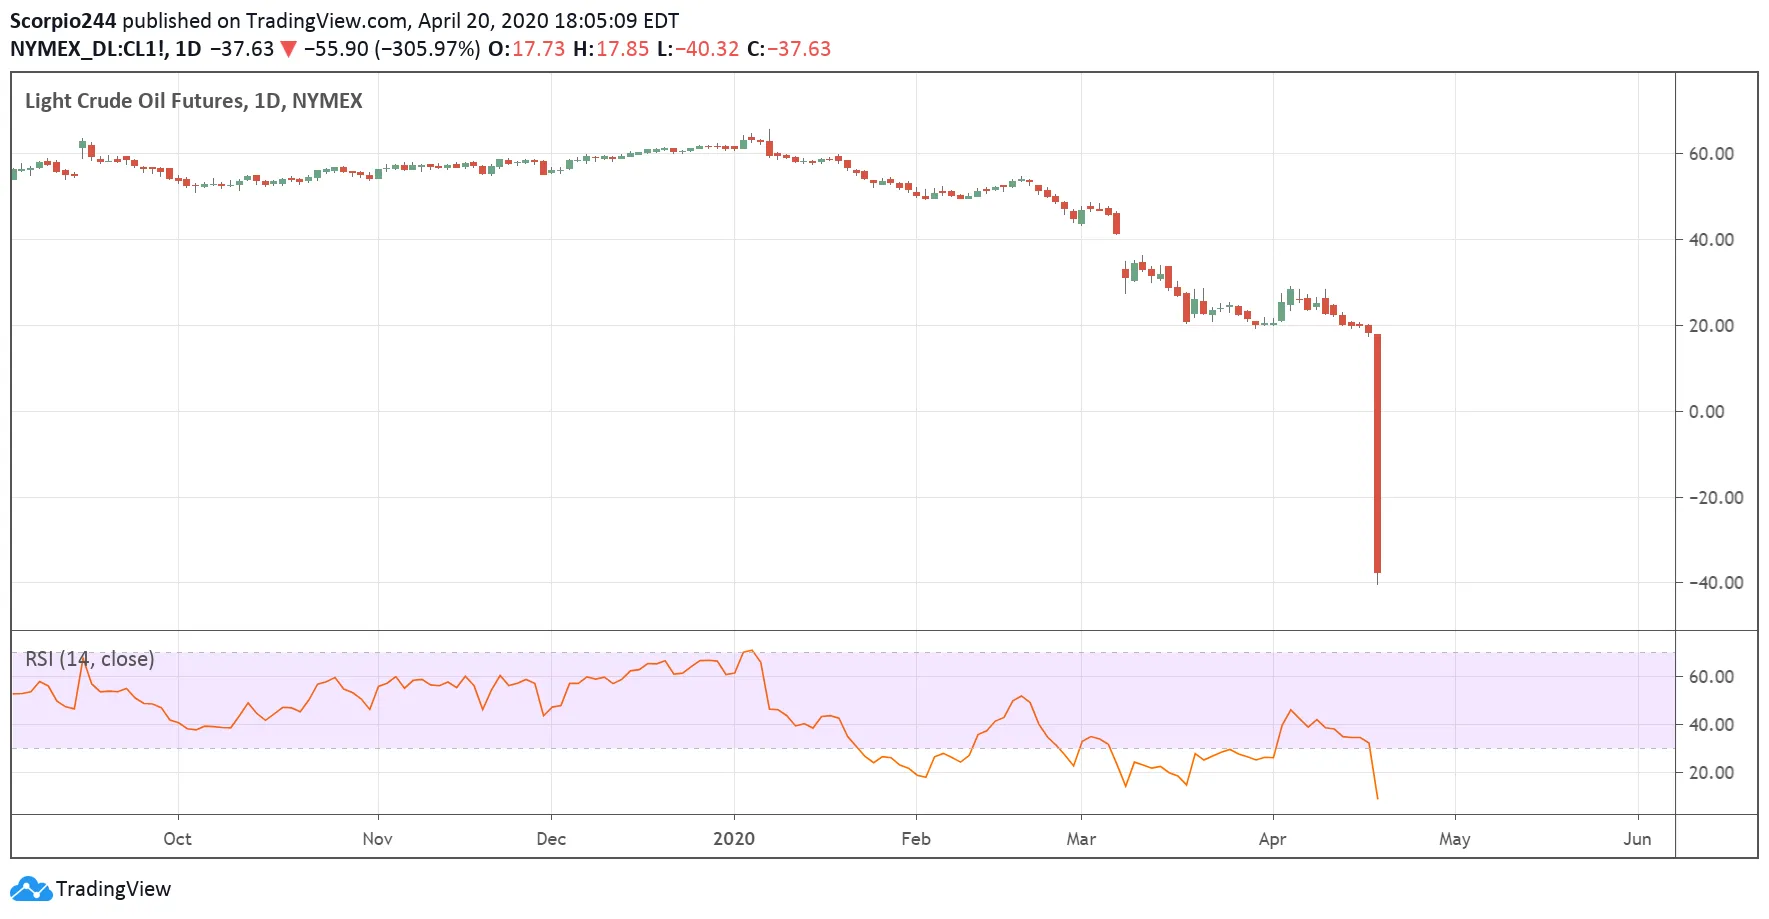
Light Crude Oil Futures Daily Chart

{{0|S&P 500 (SPY)

Anyway, the S&P 500 managed to finish the day at 2,823. Again, I am no fan of this market, and the chart appears as if maybe finally ready to roll over. You can see yet another rising wedge pattern forming for the S&P 500, and one these days, it most certainly is going to lead to a decline. But don’t worry, the first leg lower shouldn’t be too bad, there is some support around 2,761.
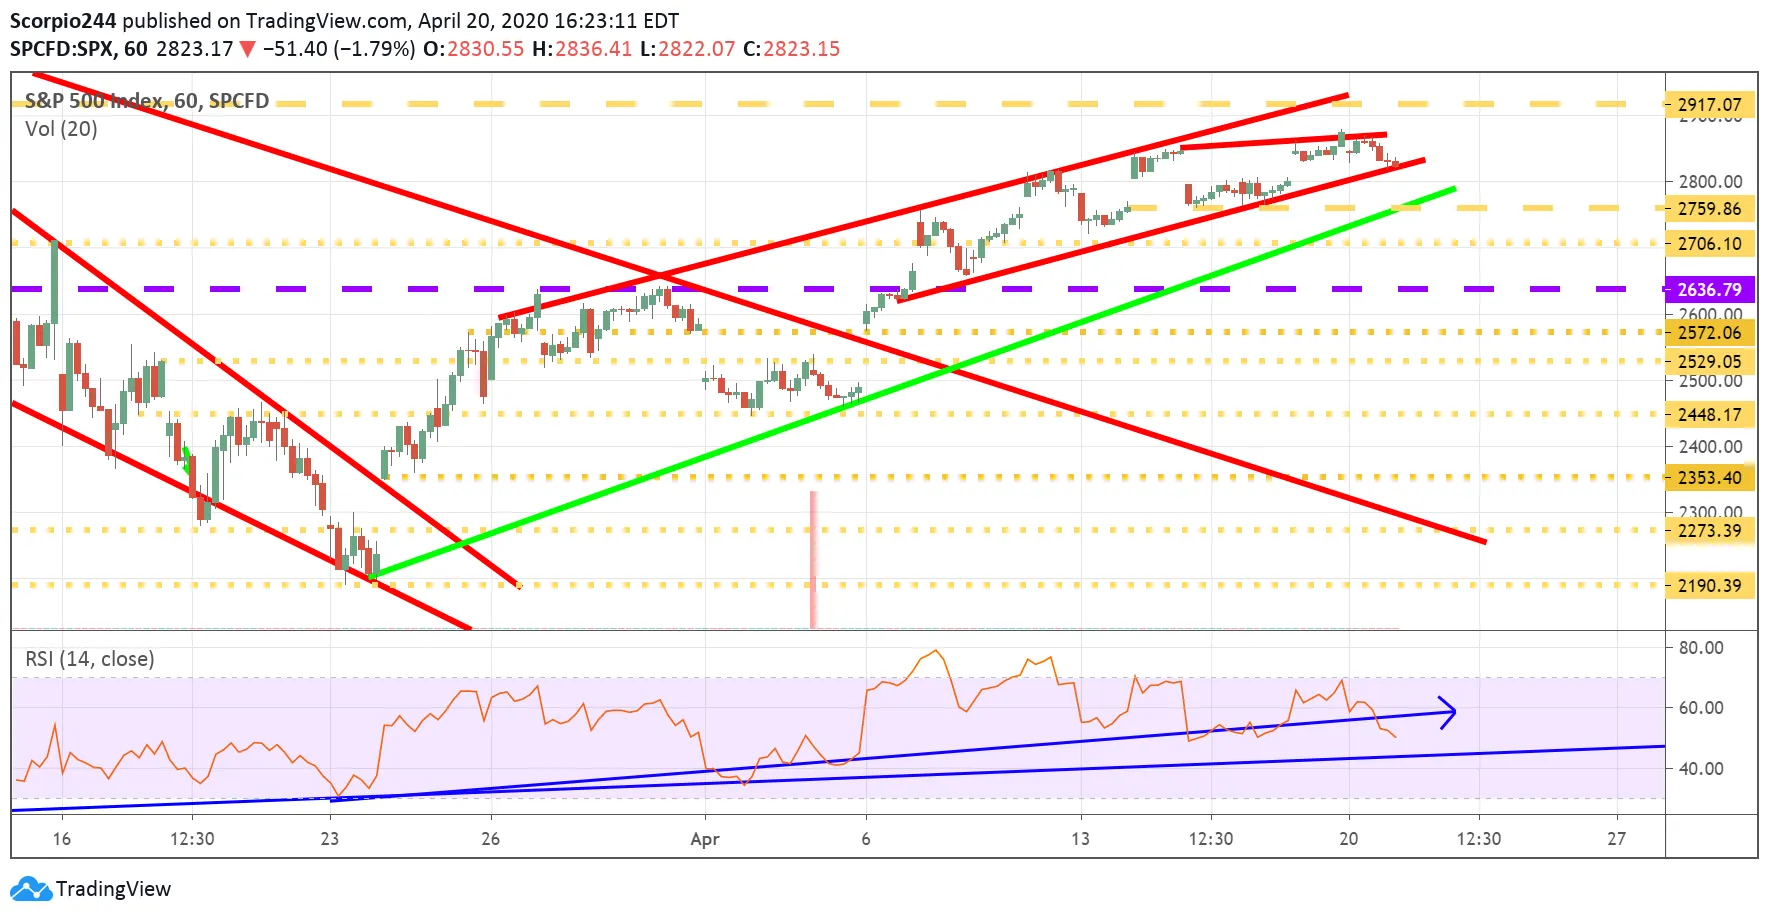
S&P 500 Index - 60 Min Chart

NASDAQ (QQQ)

The QQQ also finished the day lower, but just 1%. More importantly, the NASDAQ broke a significant uptrend, and it could result in a drop back to around 8,185.
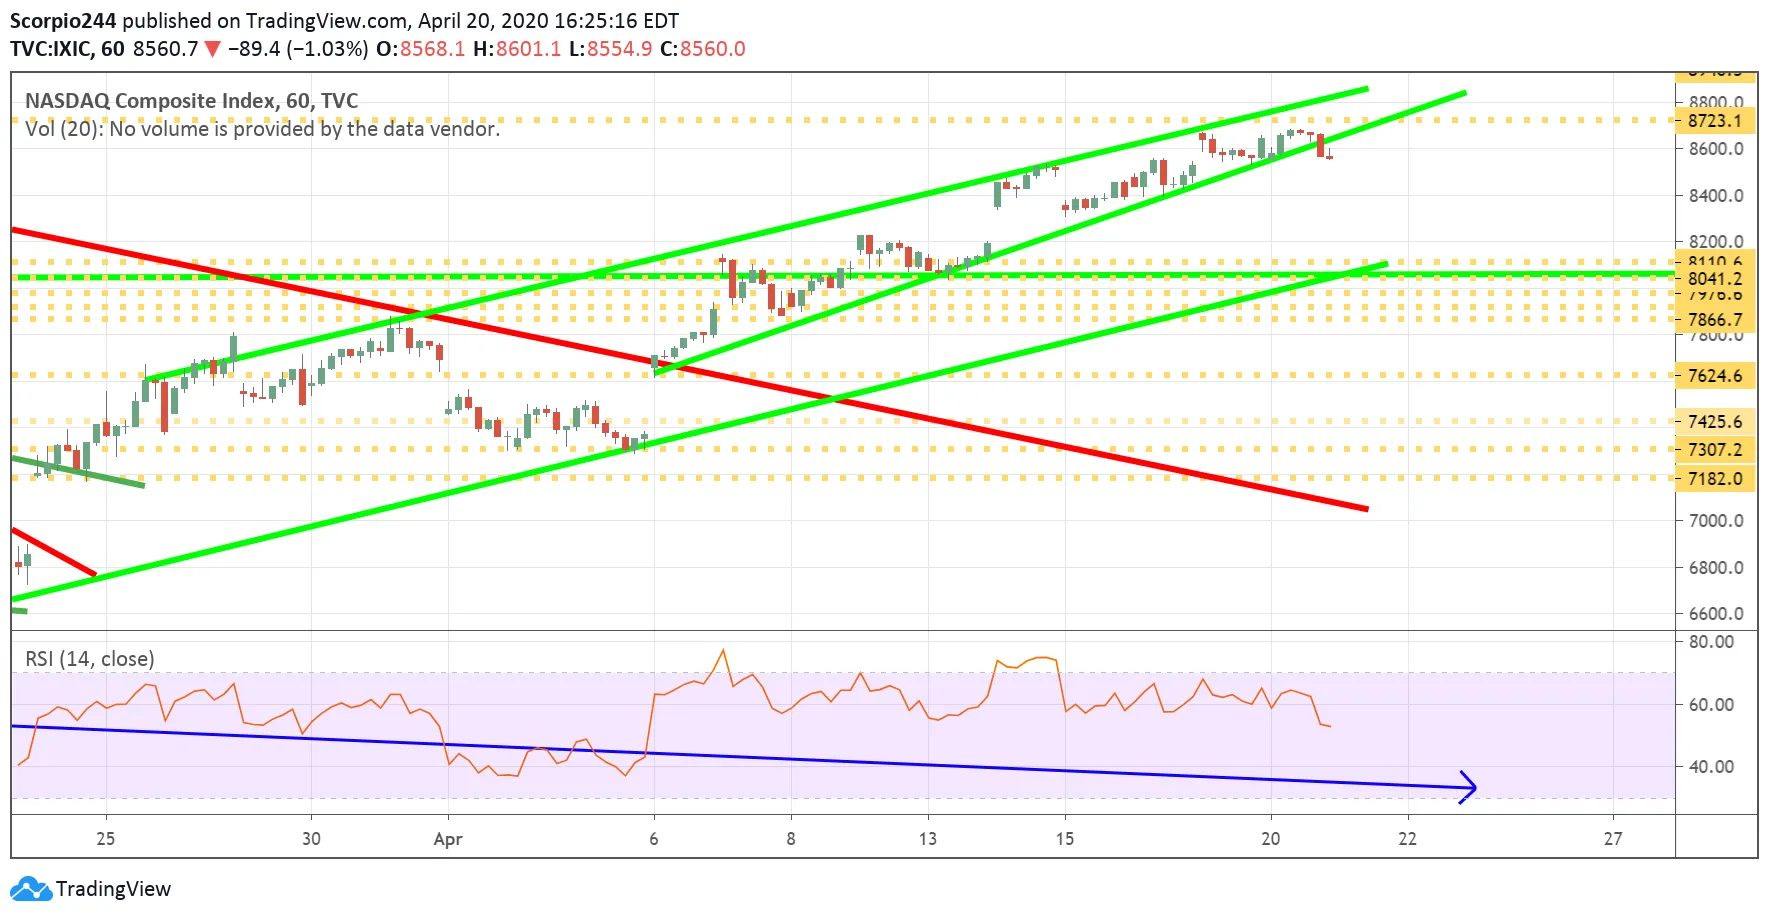
Nasdaq Composite Index - 60 Min Chart

Square (SQ)

At least for yesterday, I saw some bullish options betting in Square (NYSE:SQ). The chart looks constructive, but again this market is hard to get right these days.
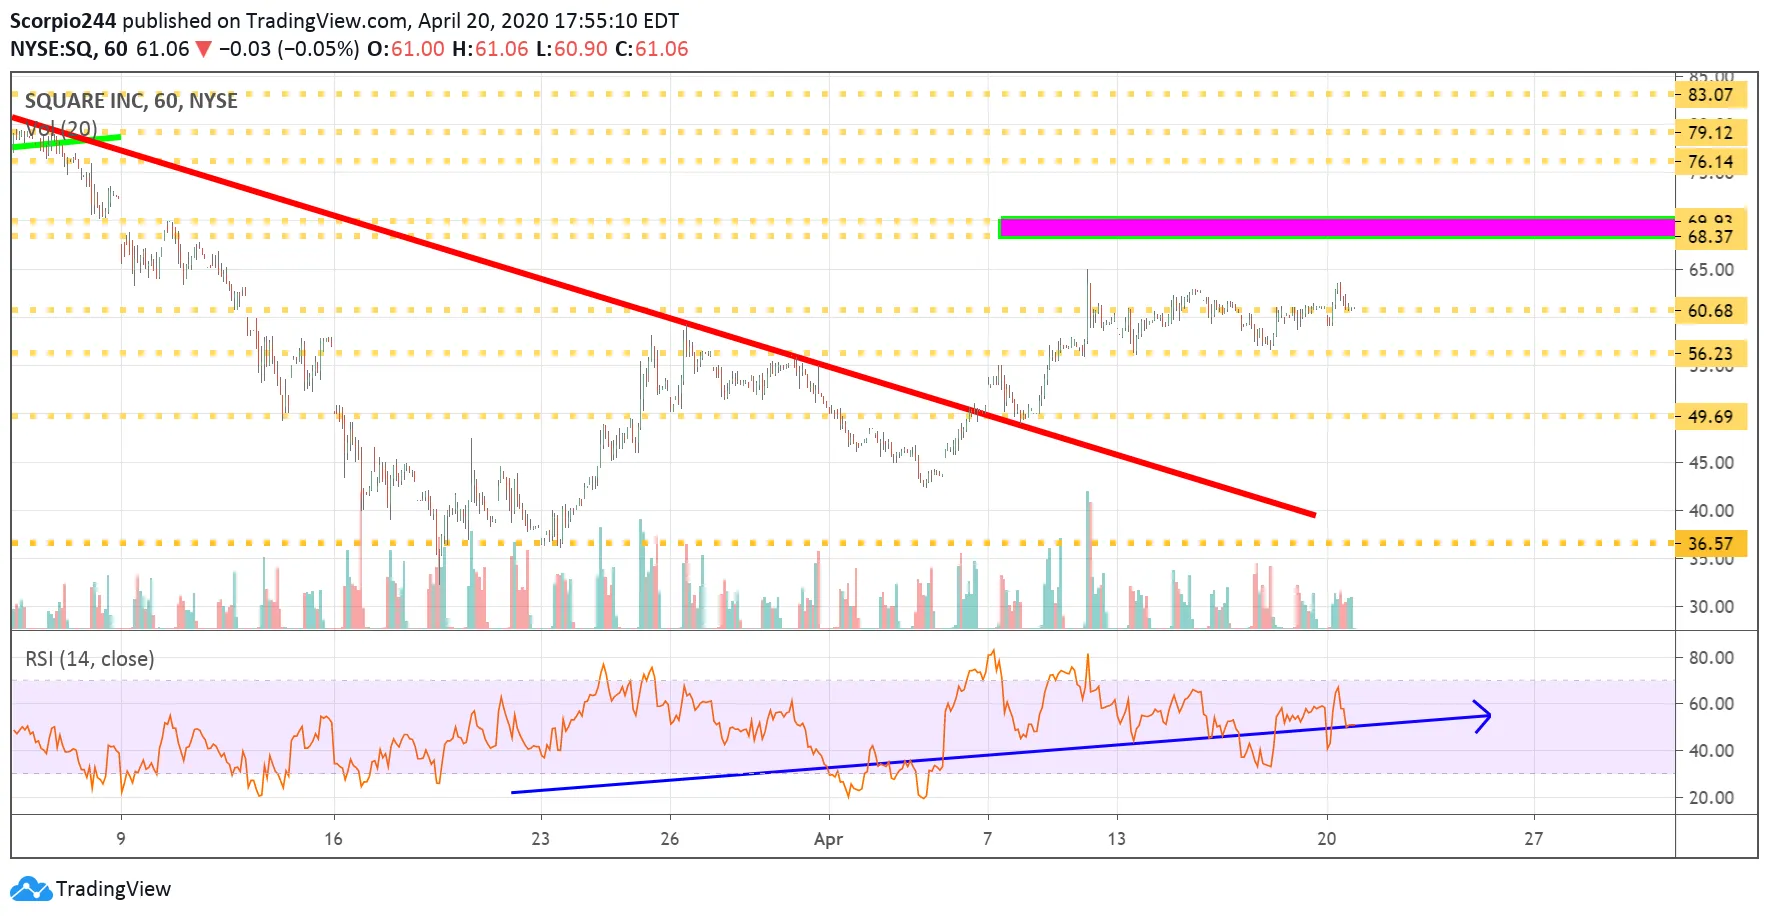
Square Inc - 60 Min Chart

Amazon (AMZN)

Amazon.com (NASDAQ:AMZN) is still showing signs of topping out, with an RSI declining, and now volume levels waning. The first level of support comes at 2,275.
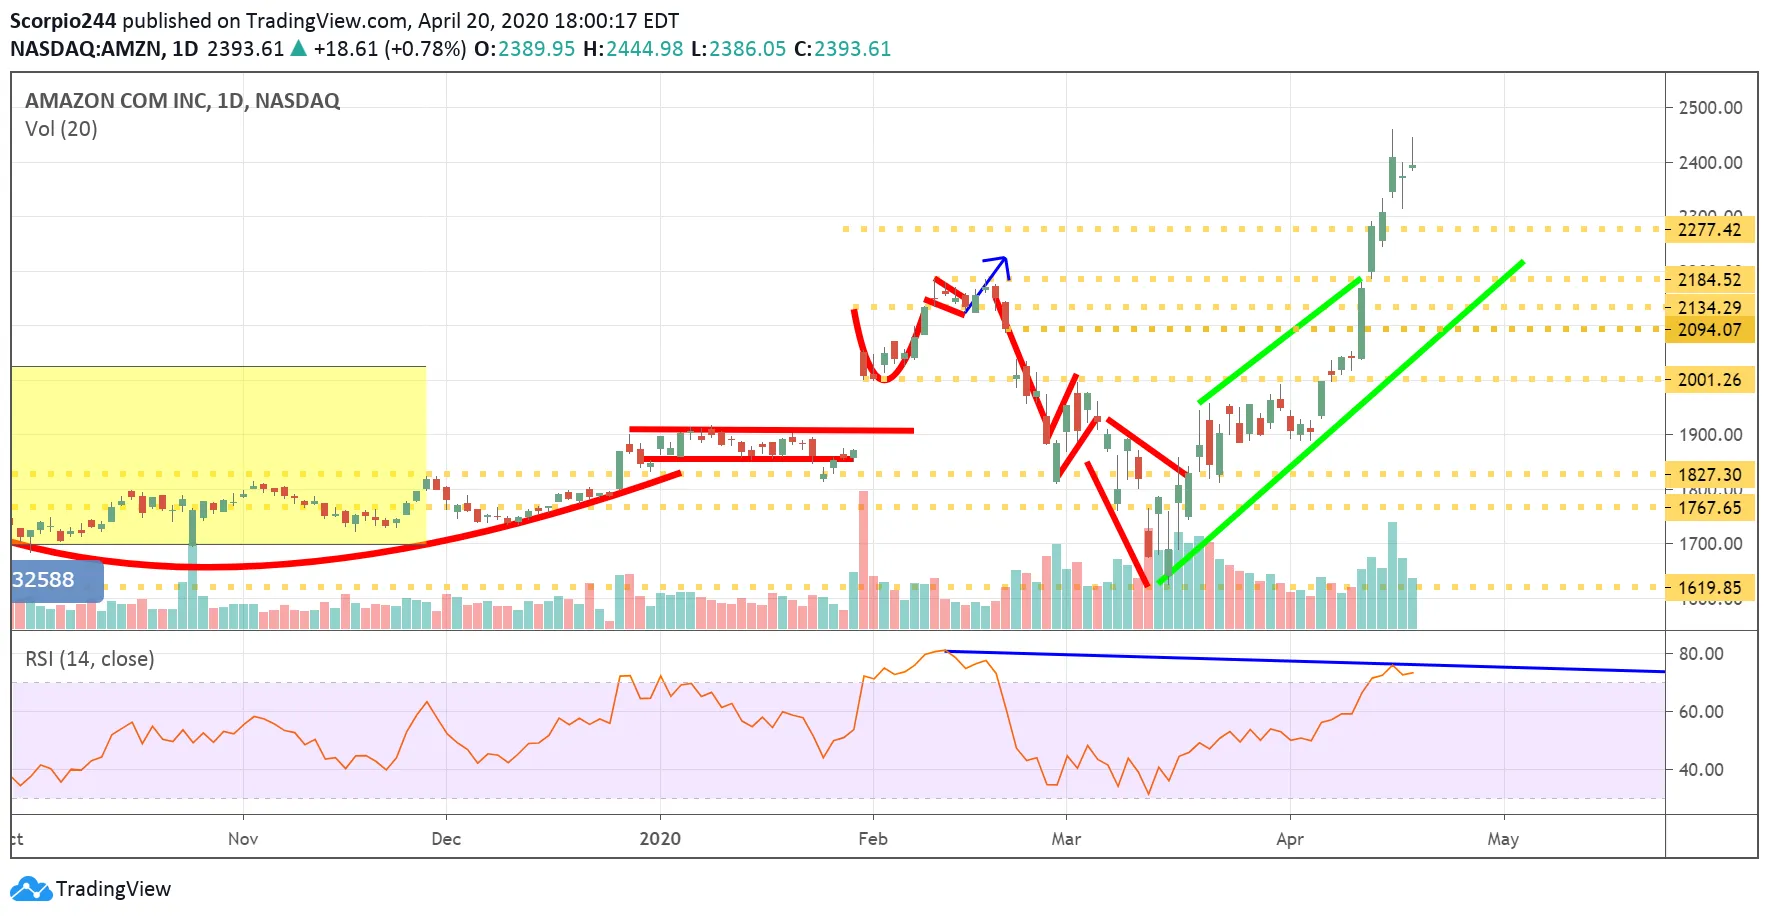
Amazon Inc Daily Chart

Netflix (NFLX)

Netflix (NASDAQ:NFLX) will report results today, and I think everyone would be surprised if subscriber growth weren’t healthy. The big question is, how long will it be until they resume production and what is their free cash flow. Remember, they carry a decent amount of debt. Like Amazon, Netflix has an RSI trending lower, and volume levels are also falling. They report results tonight.
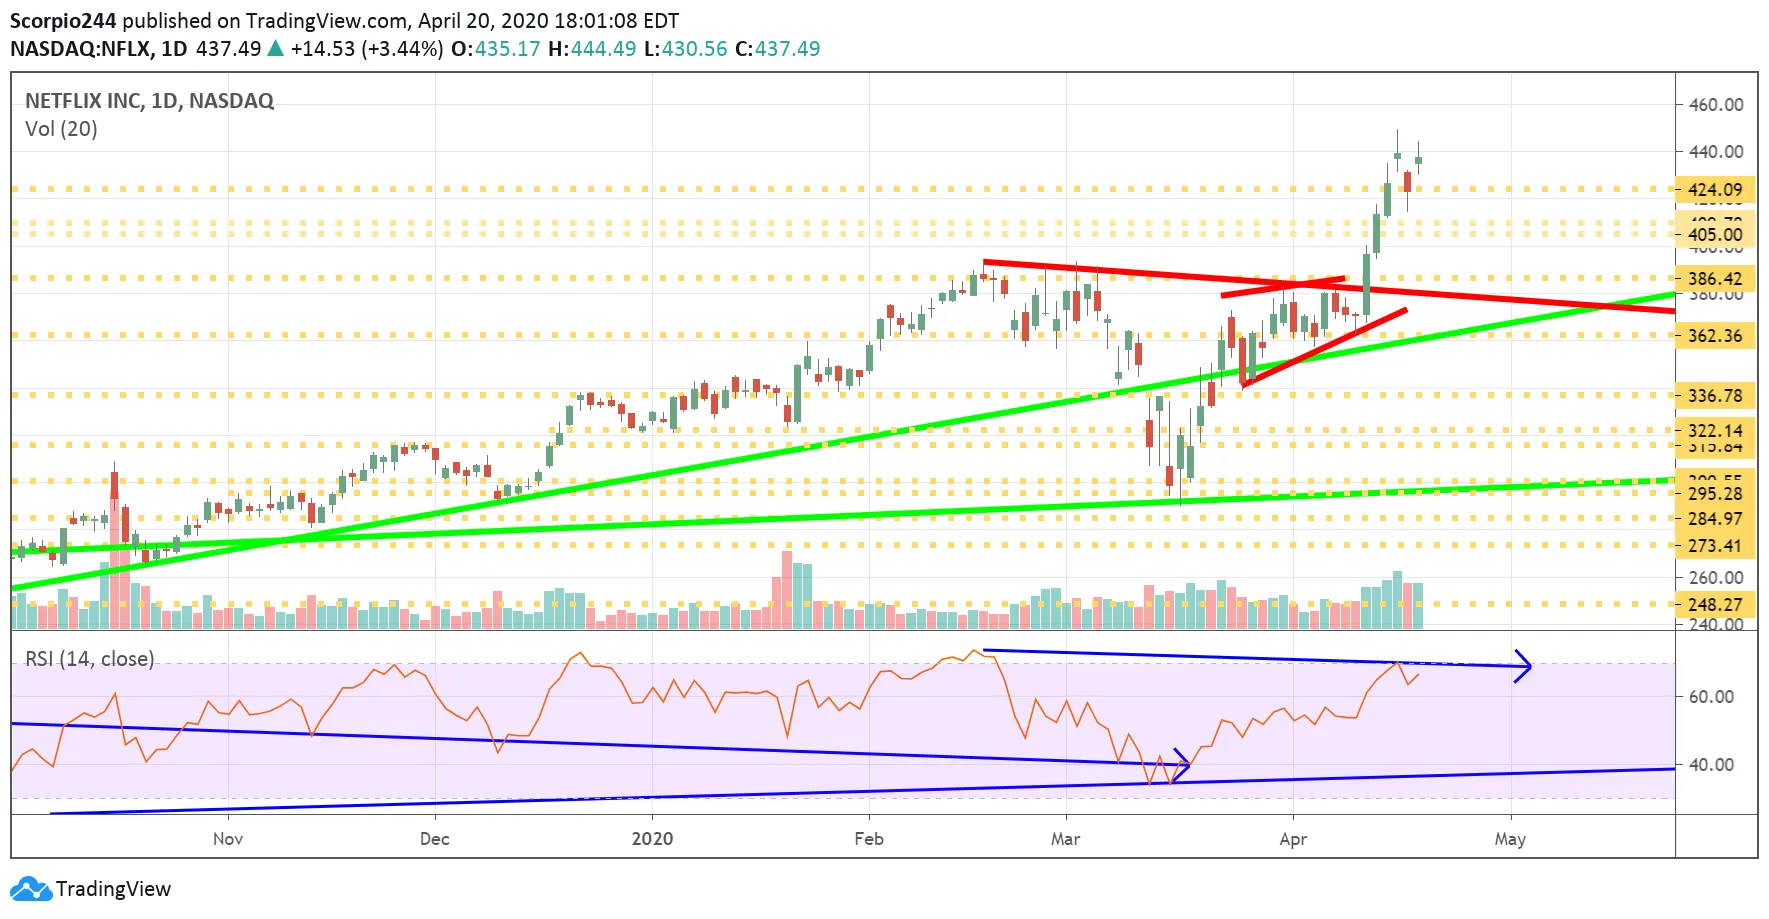
Netflix Inc Daily Chart

Intel (INTC)

We should keep an eye on Intel (NASDAQ:INTC) today, the stock fell through the uptrend yesterday, and that could set up a test of support at $55.90. They report results this Thursday.
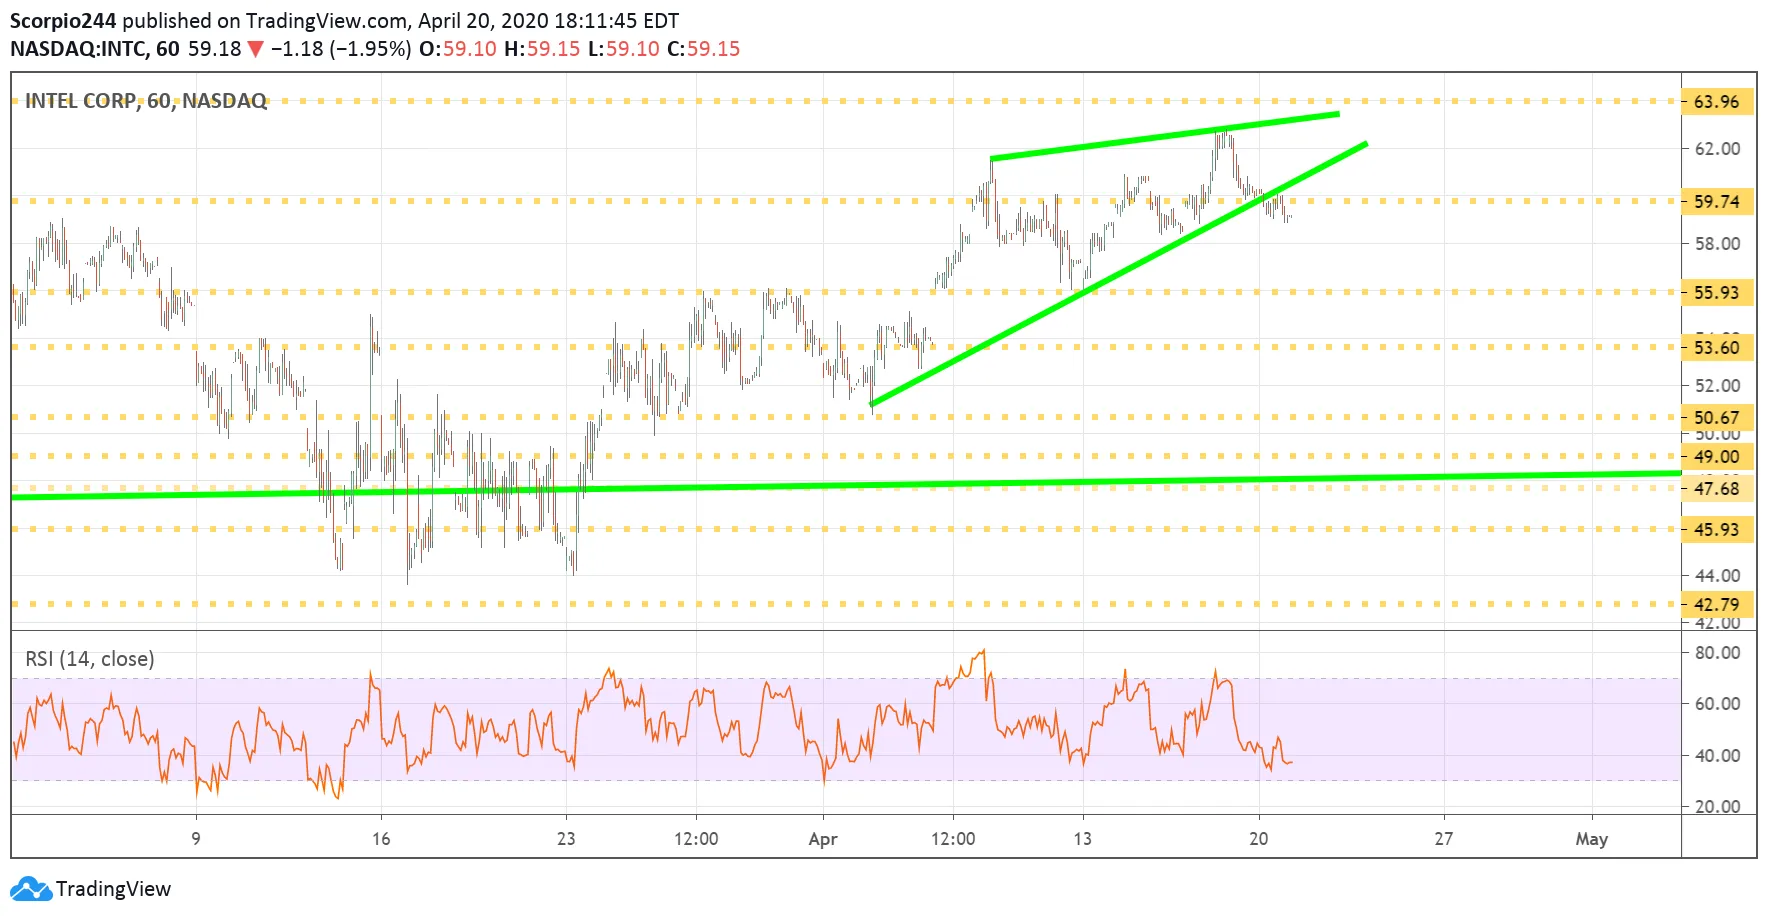
Intel Corp Chart

JPMorgan (JPM)

The chart for JPMorgan (NYSE:JPM) doesn’t look very strong, and the uptrend in the RSI appears to be at risk. I’d watch closely at the uptrend around $88. A break of that trend sends the stock back to its recent lows.
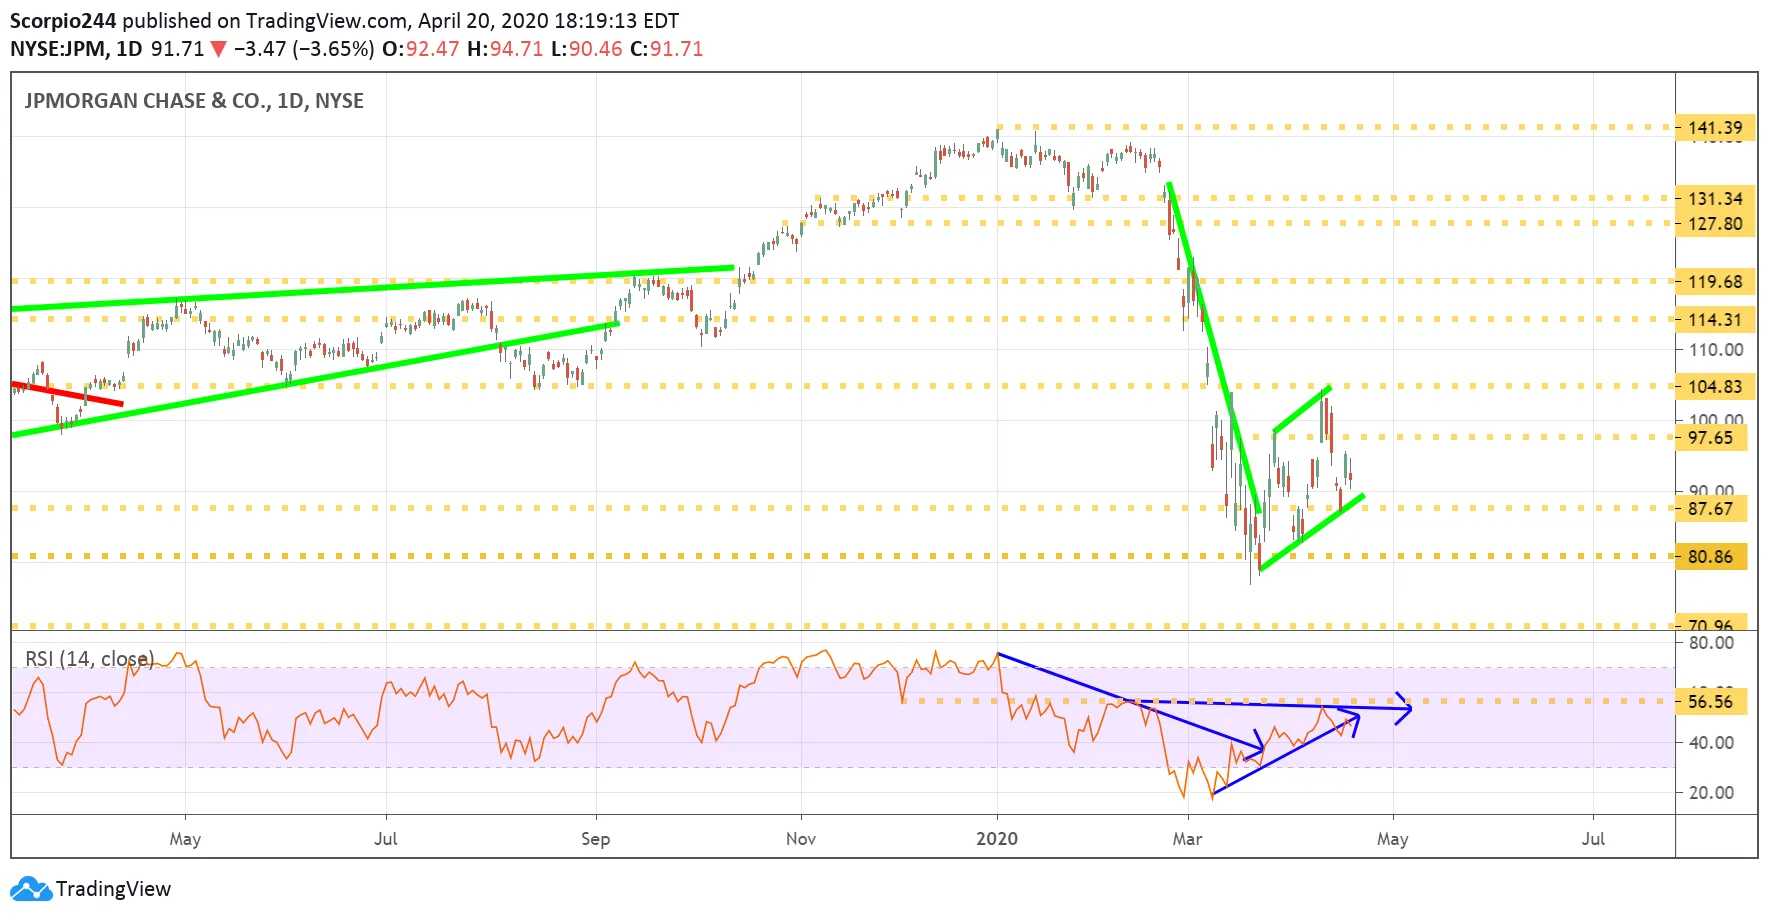
JPMorgan Chase Daily Chart

Original Post

Latest comments

Loading next article…
Risk Disclosure: Trading in financial instruments and/or cryptocurrencies involves high risks including the risk of losing some, or all, of your investment amount, and may not be suitable for all investors. Prices of cryptocurrencies are extremely volatile and may be affected by external factors such as financial, regulatory or political events. Trading on margin increases the financial risks.
Before deciding to trade in financial instrument or cryptocurrencies you should be fully informed of the risks and costs associated with trading the financial markets, carefully consider your investment objectives, level of experience, and risk appetite, and seek professional advice where needed.
Fusion Media would like to remind you that the data contained in this website is not necessarily real-time nor accurate. The data and prices on the website are not necessarily provided by any market or exchange, but may be provided by market makers, and so prices may not be accurate and may differ from the actual price at any given market, meaning prices are indicative and not appropriate for trading purposes. Fusion Media and any provider of the data contained in this website will not accept liability for any loss or damage as a result of your trading, or your reliance on the information contained within this website.
It is prohibited to use, store, reproduce, display, modify, transmit or distribute the data contained in this website without the explicit prior written permission of Fusion Media and/or the data provider. All intellectual property rights are reserved by the providers and/or the exchange providing the data contained in this website.
Fusion Media may be compensated by the advertisers that appear on the website, based on your interaction with the advertisements or advertisers.
© 2007-2025 - Fusion Media Limited. All Rights Reserved.