Stocks Fall on July 16
Stocks fell some on July 16, but I don’t expect this trend to last. If there hadn’t been a negative comment from President Trump about the China trade, we probably would have had a flat day.
S&P 500 (SPY)
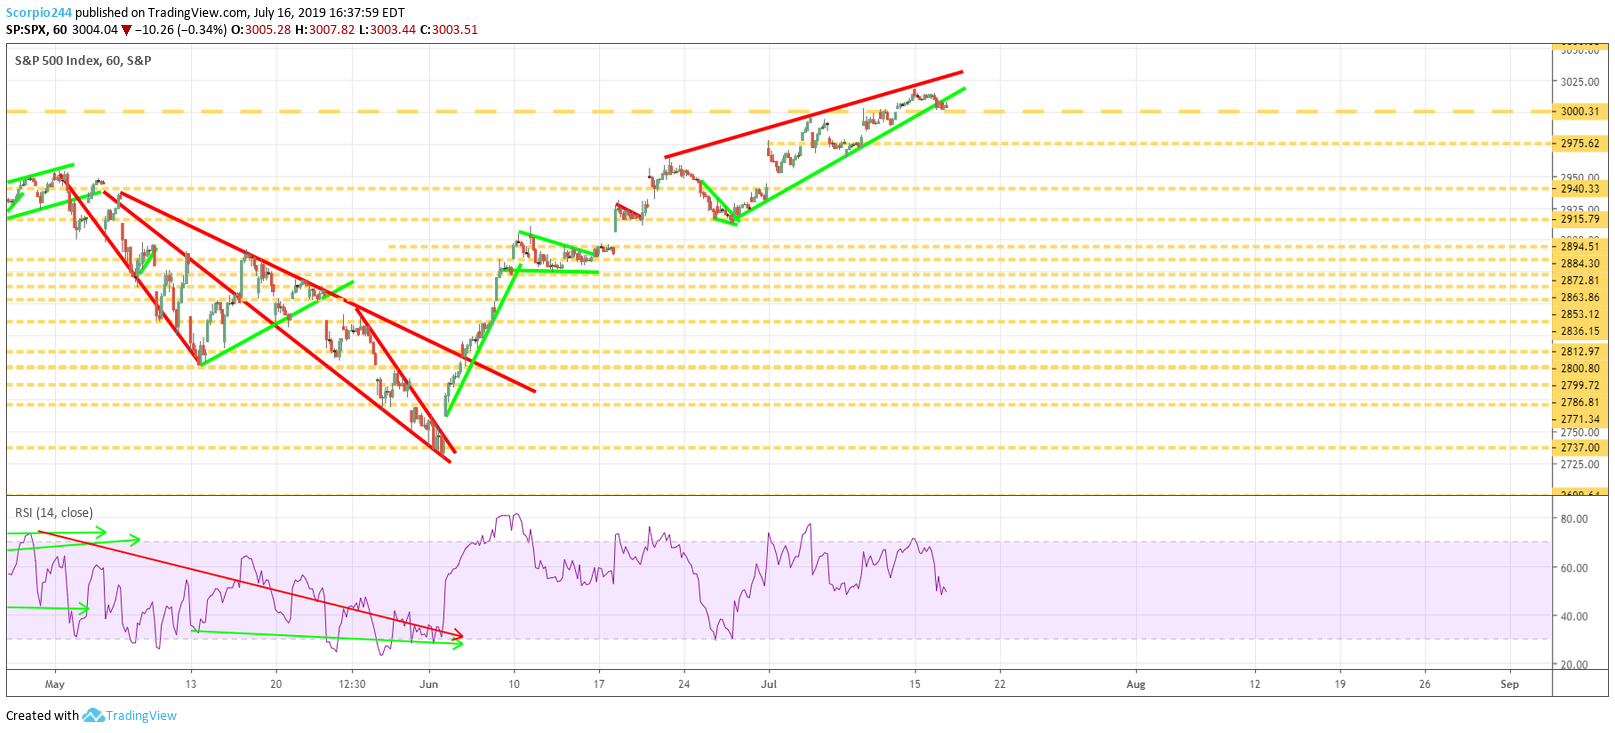
The S&P 500 stalled some on July 16, falling by about 35 basis points. The index managed to hold on to support at 3,000, which is good a start. As a reader pointed out to me last night, it looked as if the index is forming a rising wedge. While I can’t say I haven’t been tracking the same thing the last few days, I have been hesitant to call it, because I am seeing a different variation of it forming across differing indexes. However, I decided we should draw it, make it official and see how it develops. This has been the one short-term wrinkle in my other bullish assessment.
Should the index fall, it is likely to drop to around 2,940. At this point, I’m not ready to give a signal.
Housing (HGX)
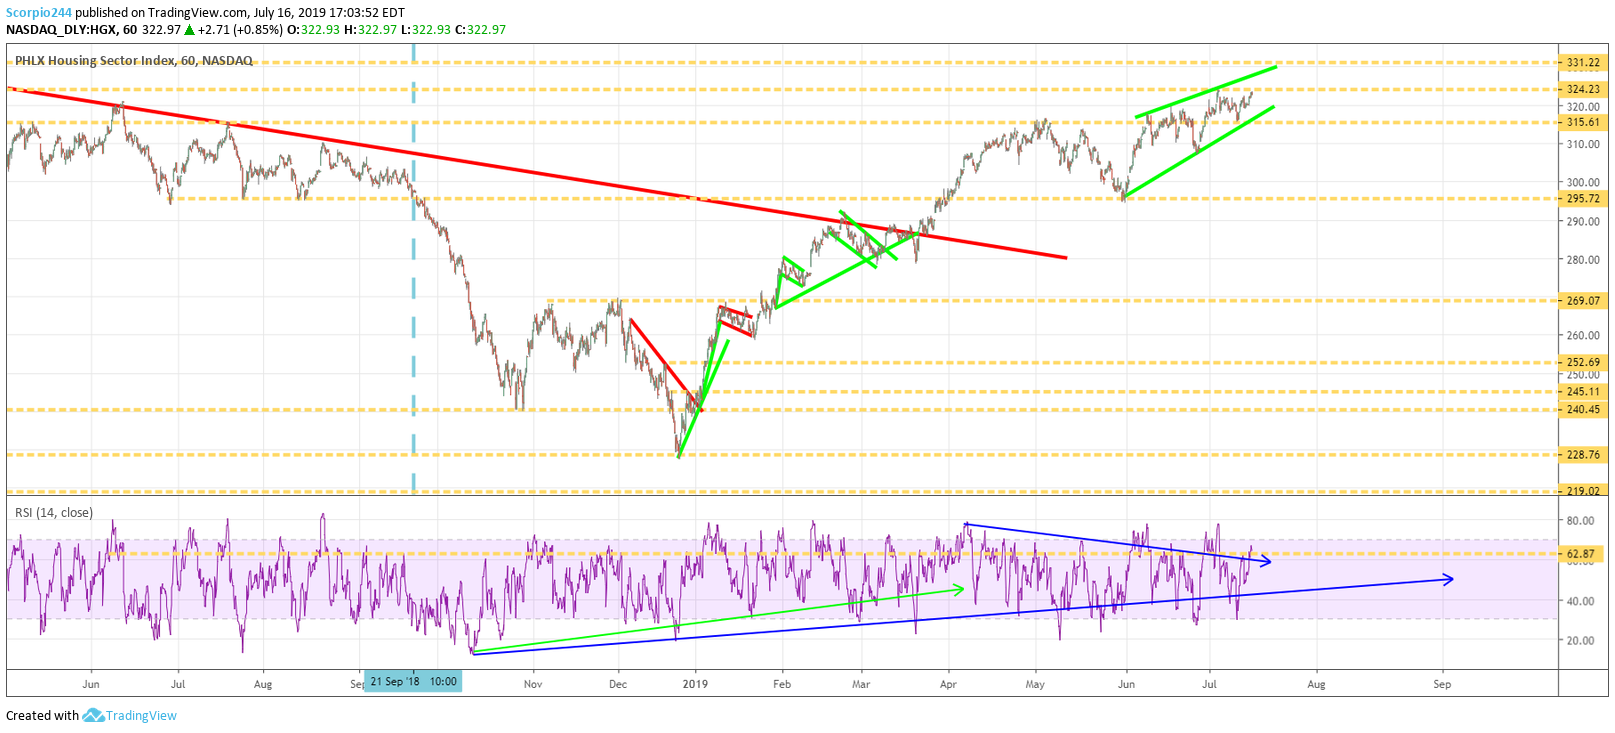
The HGX housing index is once again flirting with a break out at 325. Still, this has been a powerful leading indicator to the S&P 500 in the past. There is a clear uptrend in this index. This is one reason why I am hesitant about the S&P 500 falling.
Biotech (XBI)
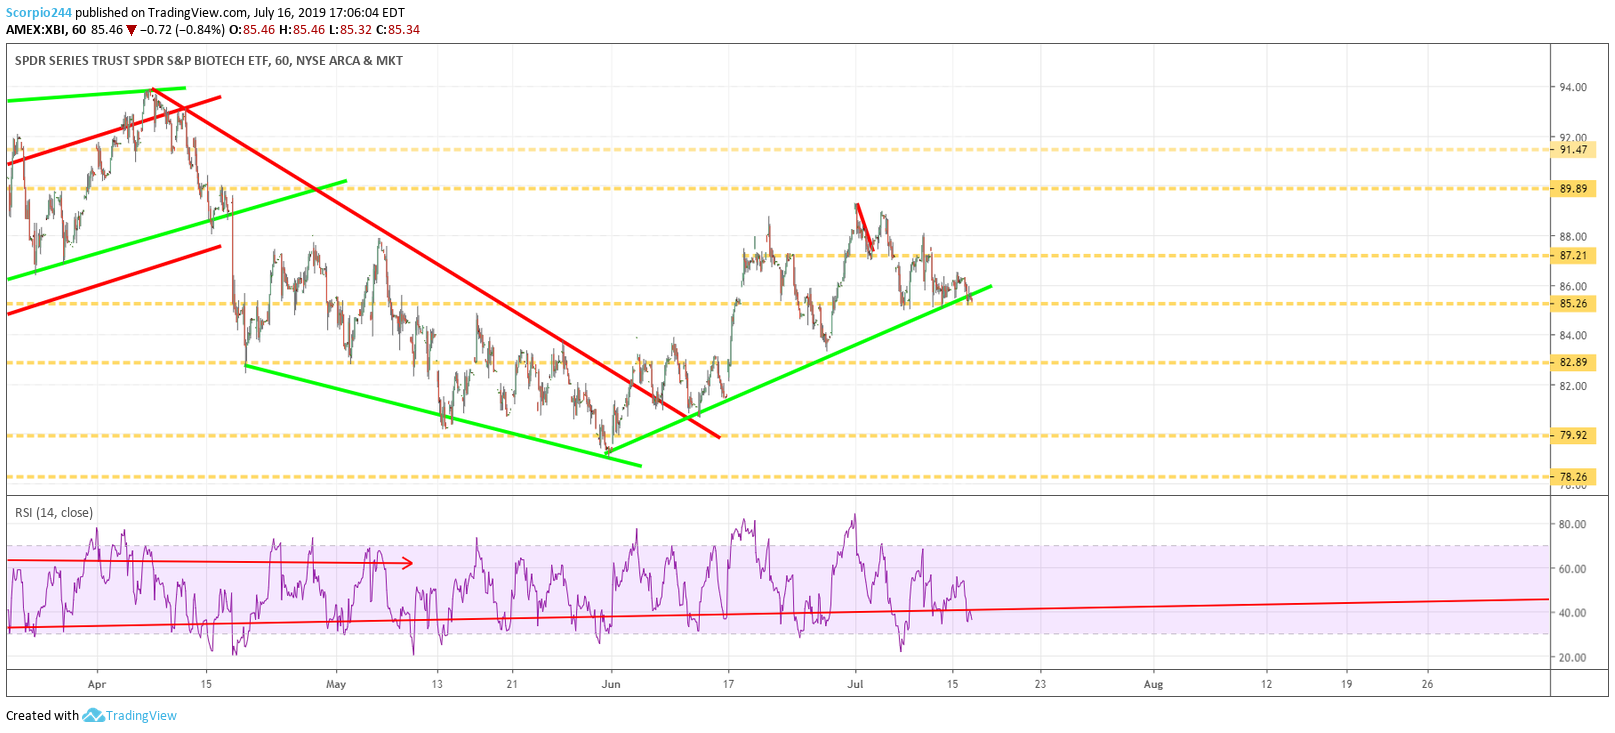
The biotech XBI ETF has been holding support at $85.25, I just wonder for how much longer. The uptrend is has broken as the ETF has traded sideways through it, which is not a great sign. A break below $85.25 sends the XBI down to $82.90.
Qualcomm (QCOM)
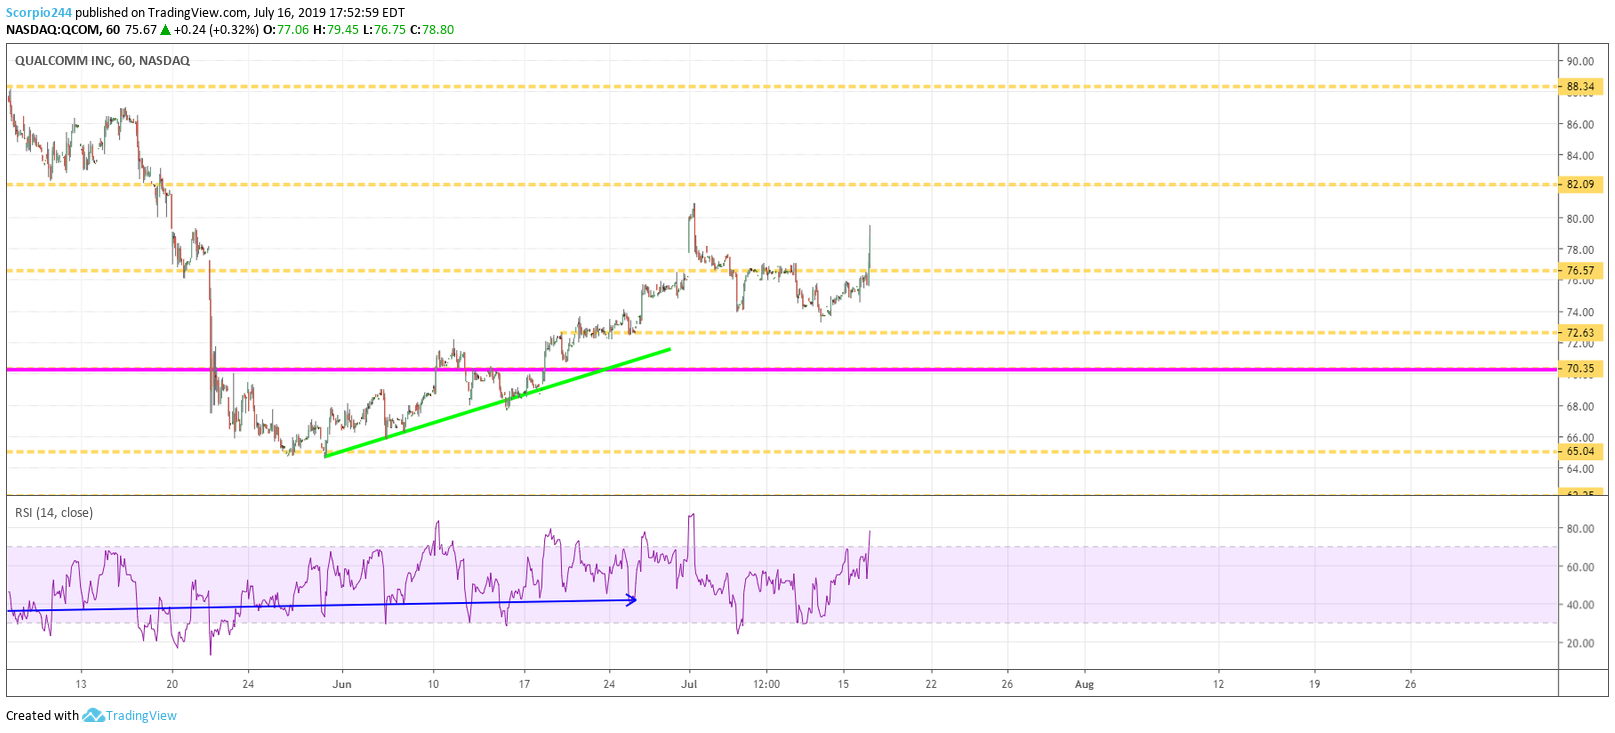
Qualcomm (NASDAQ:QCOM) is rising in the after-hours after the DOJ has requested to pause its antitrust lawsuit. It looks the stock could rise to around $83.
Roku (ROKU)
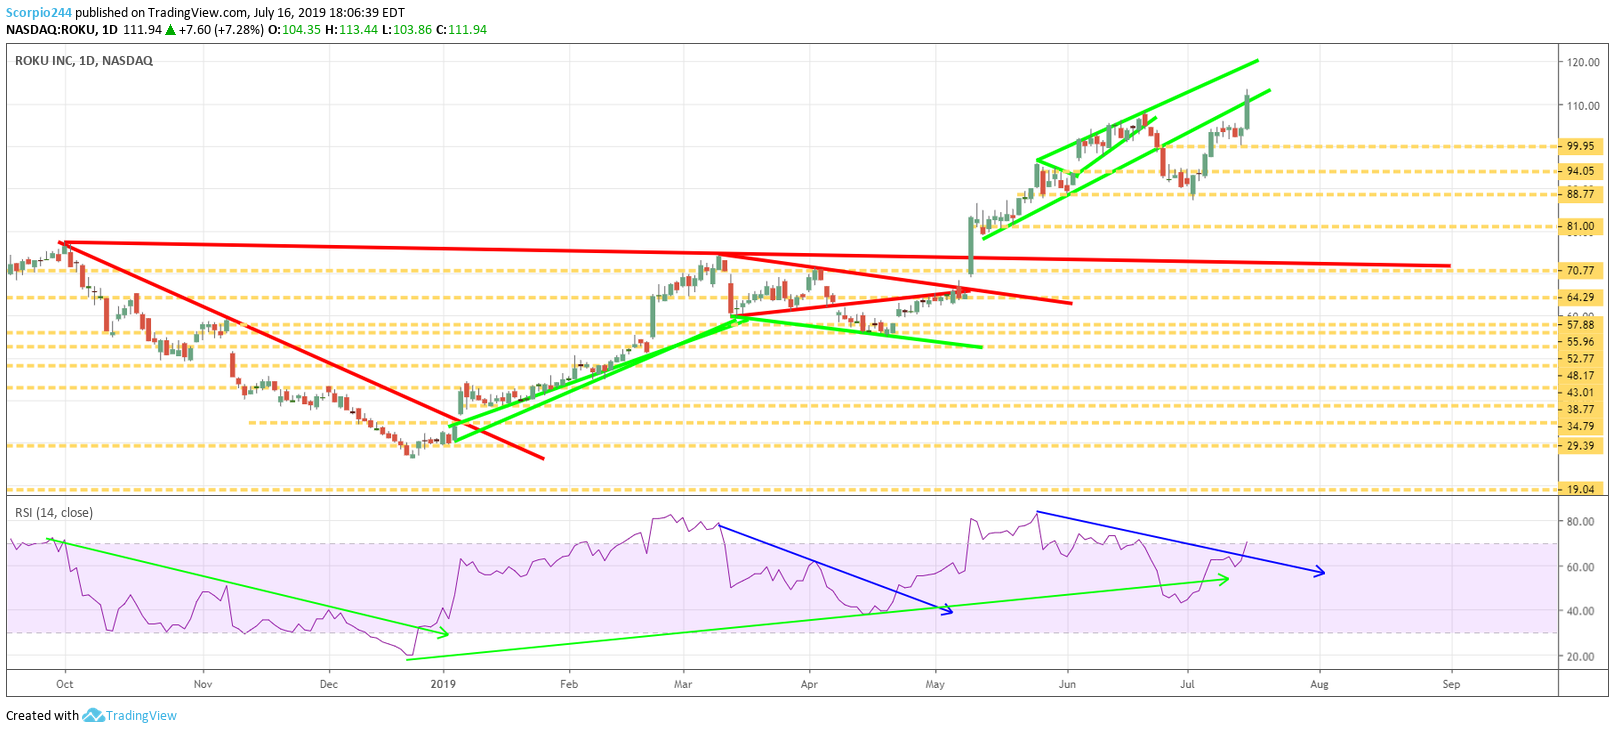
Roku (NASDAQ:ROKU) now has a valuation of almost $13 billion, and it is currently trading at a valuation that is 40% higher than Netflix (NASDAQ:NFLX), with a one-year forward price to sale ratio of 9, versus Netflix at 6.4. If you want to pay that valuation be my guest. My best guess at this point is that ROKU rise to around $120, I guess you can’t stop the momentum.
JD (JD)
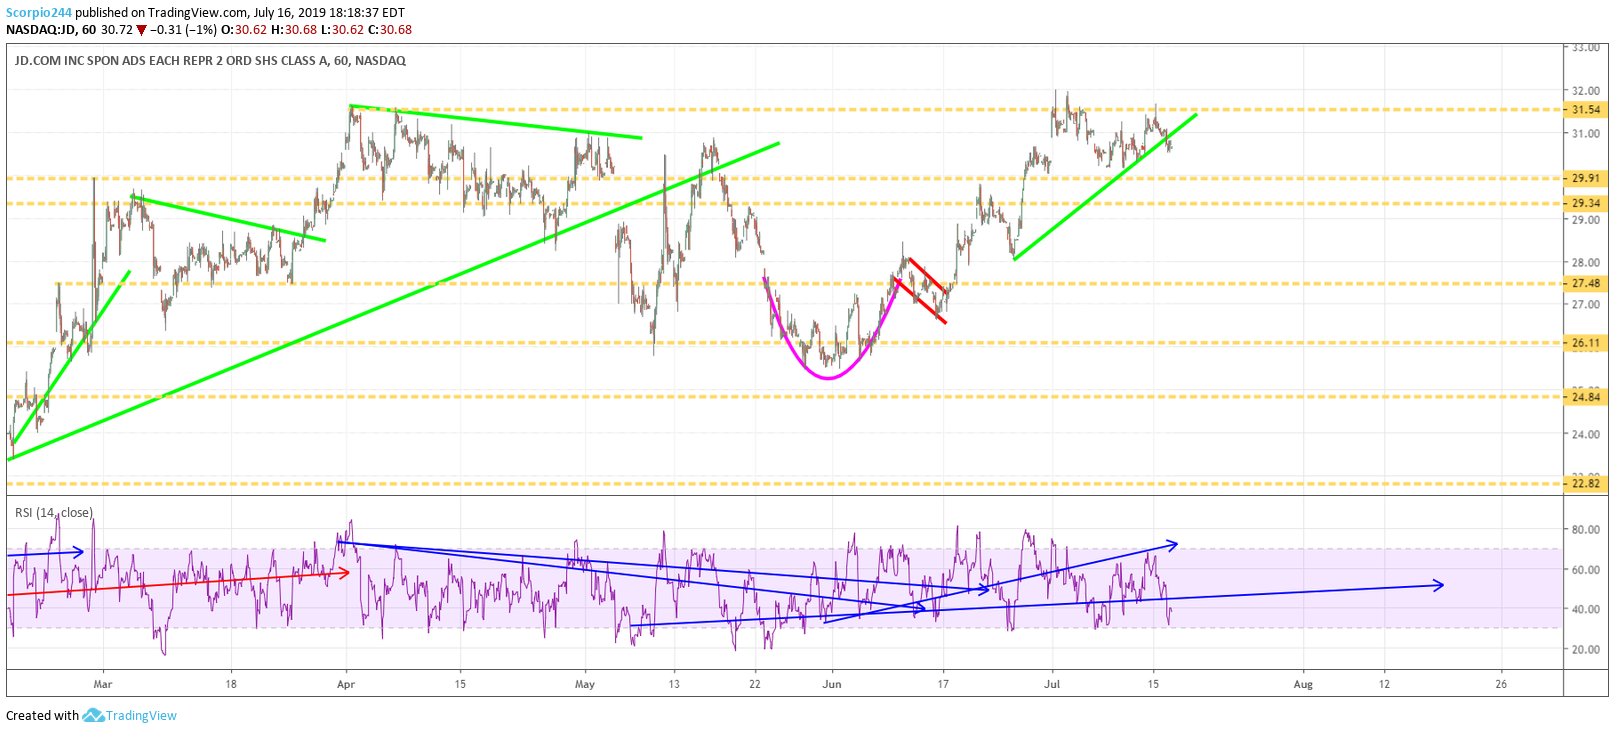
Jd.Com (NASDAQ:JD) is not working out the way I anticipated. The stock has stalled out at resistance at $31.50, and it is now testing the uptrend. A break below $29.90 will cause me to re-evaluate my thinking.
AMD (AMD)
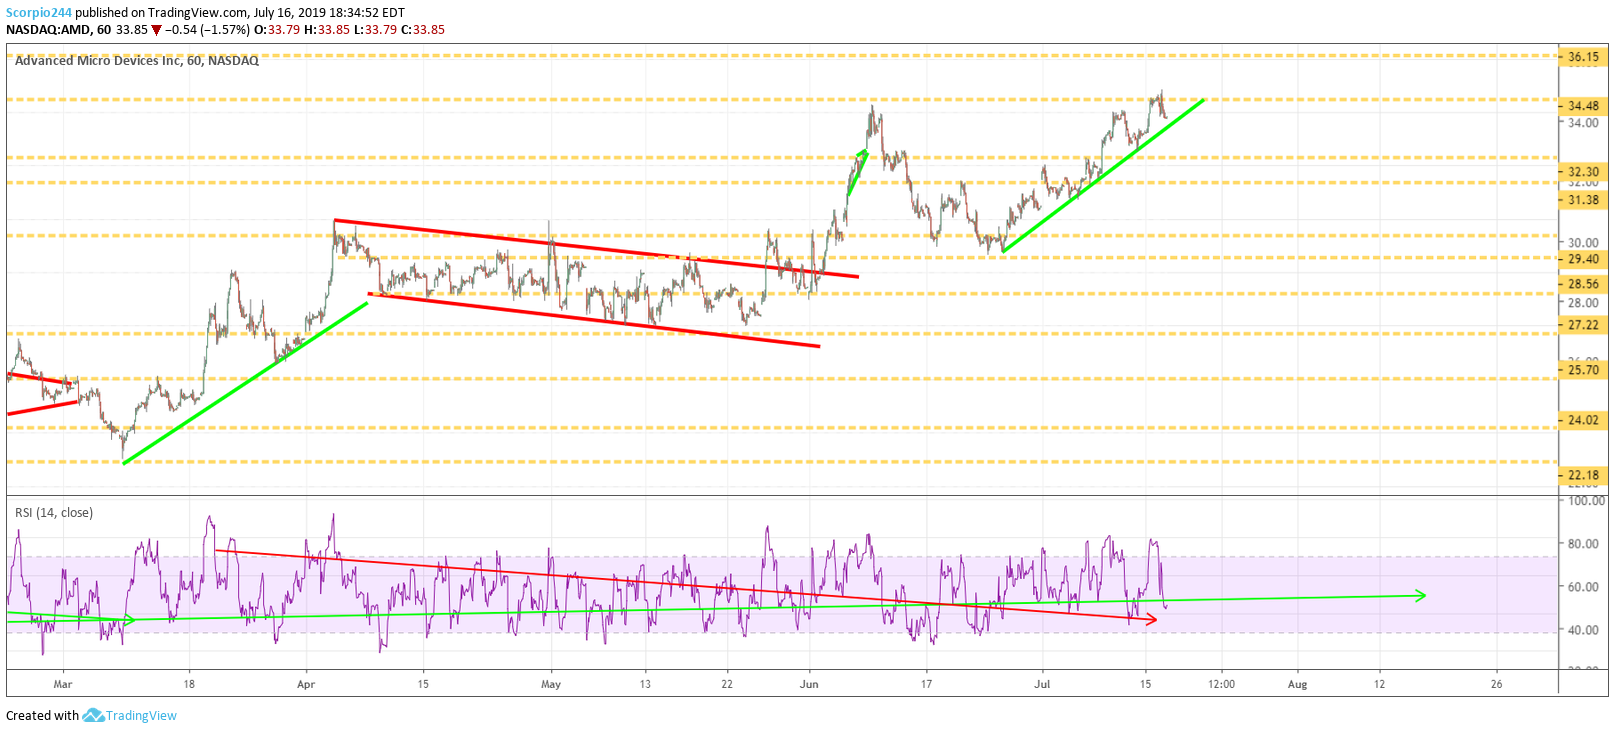
AMD fell some, but the uptrend remains in place, therefore the march to $36.15.
Nvidia (NVDA)
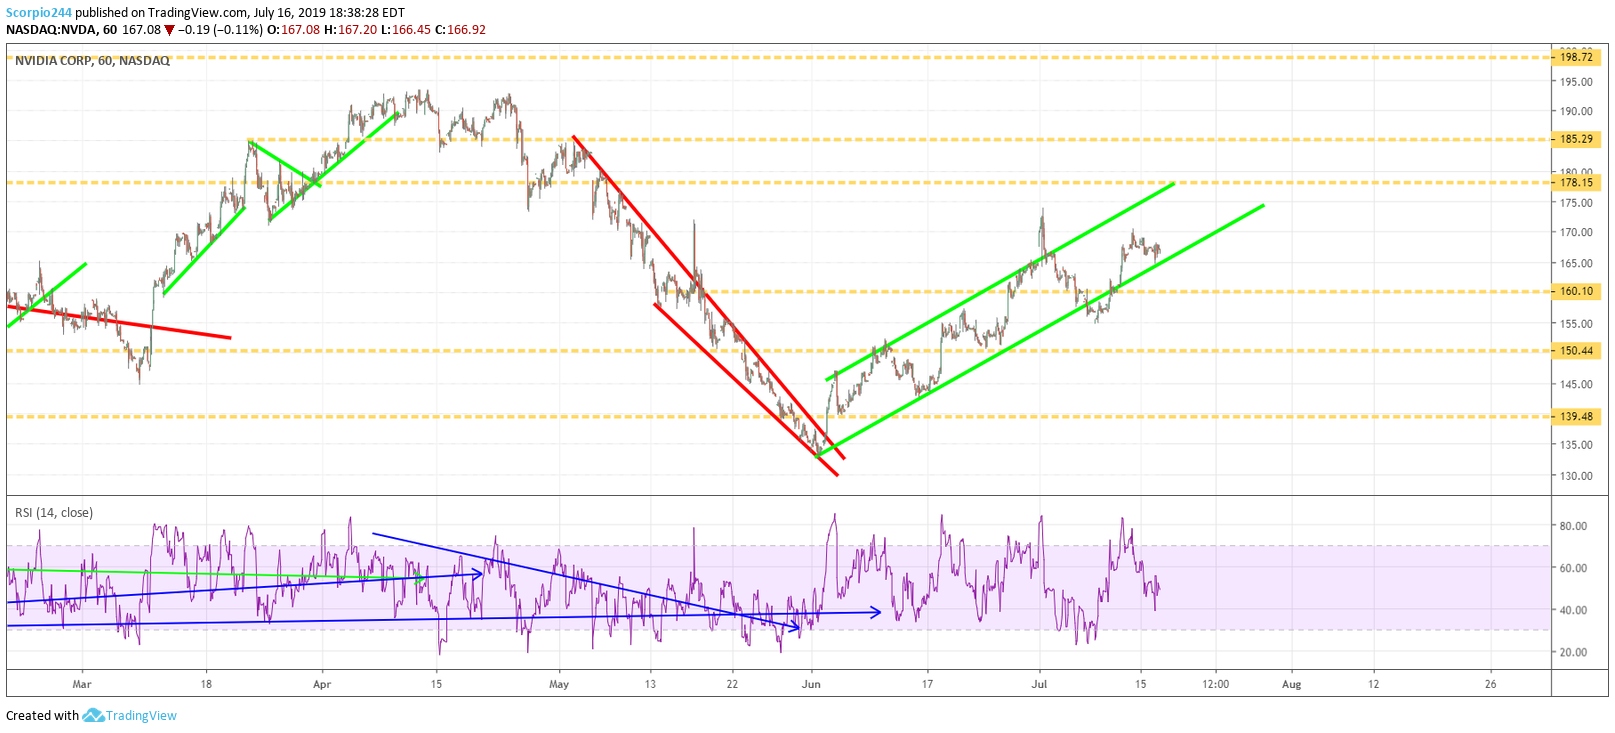
Meanwhile, NVDA continues to stay within a trading range moving higher. I still think NVDA goes to $178.

