Investing.com’s stocks of the week
S&P (SPY)
Stocks had a kind of strange day yesterday, falling midday on headlines that not all tariffs on China would be rolled back until after the election. It resulted in a pretty quick sell-off that the market couldn’t recover.
I’m not sure why this was even newsworthy, to be honest. It was never said that all the tariffs would be rolled back immediately, so why did the market fall?
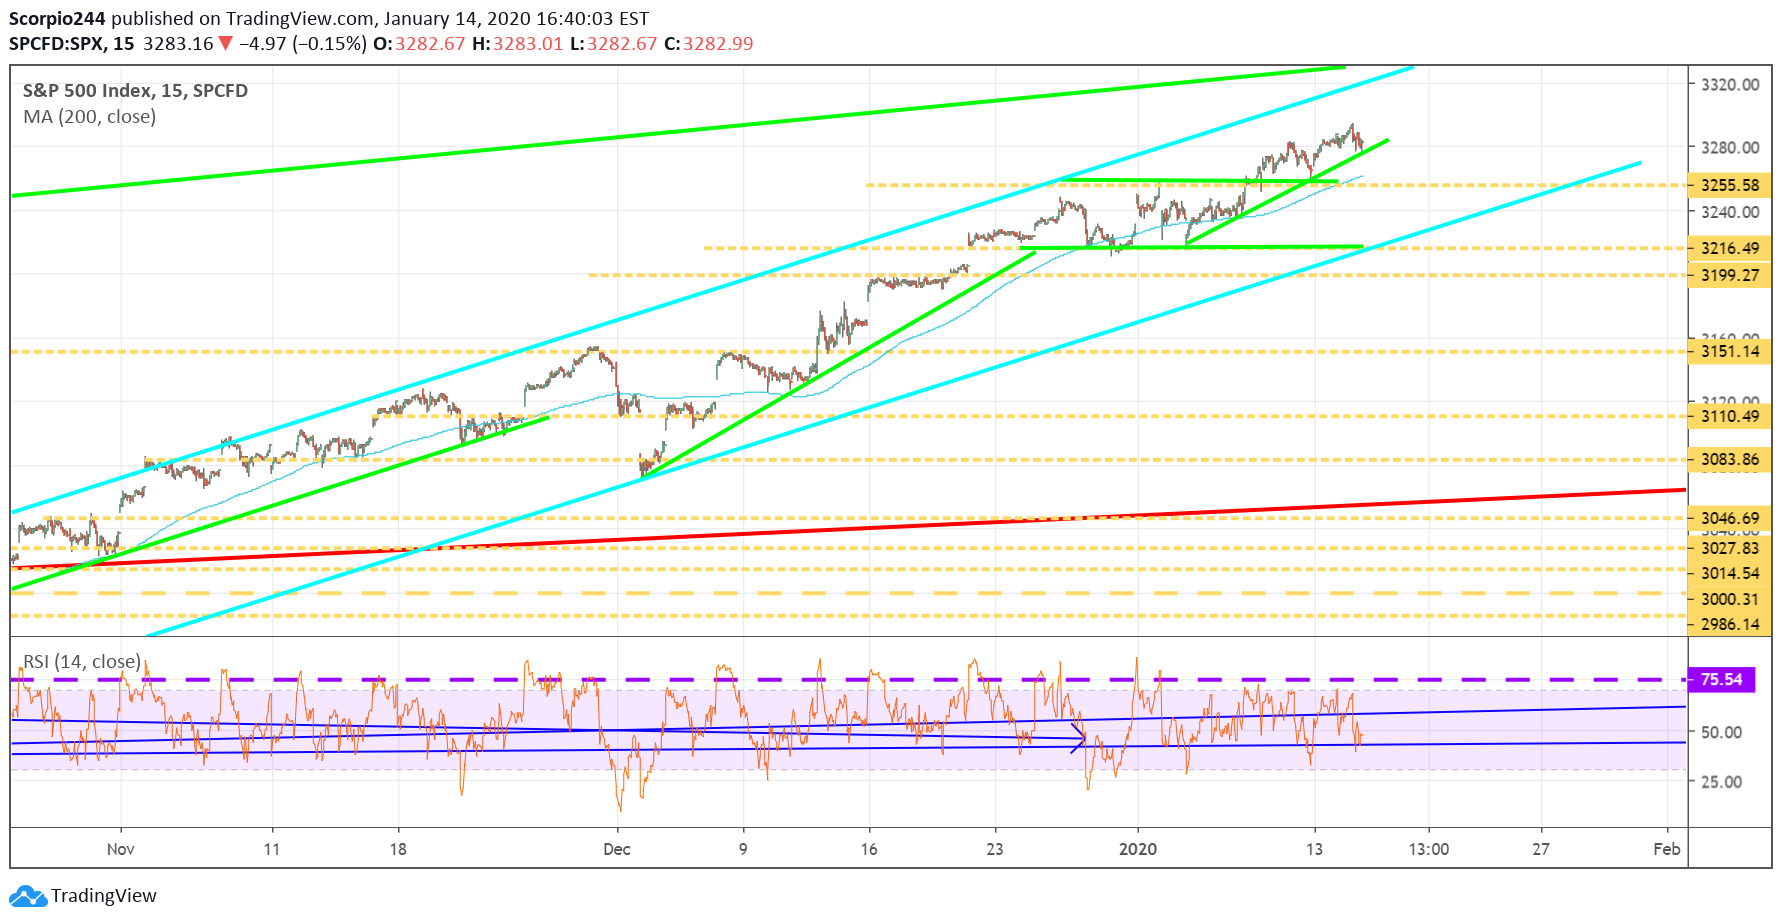
Regardless, absolutely nothing changed from a technical perspective with the S&P 500 well entrenched in the last uptrend off the break out last week.
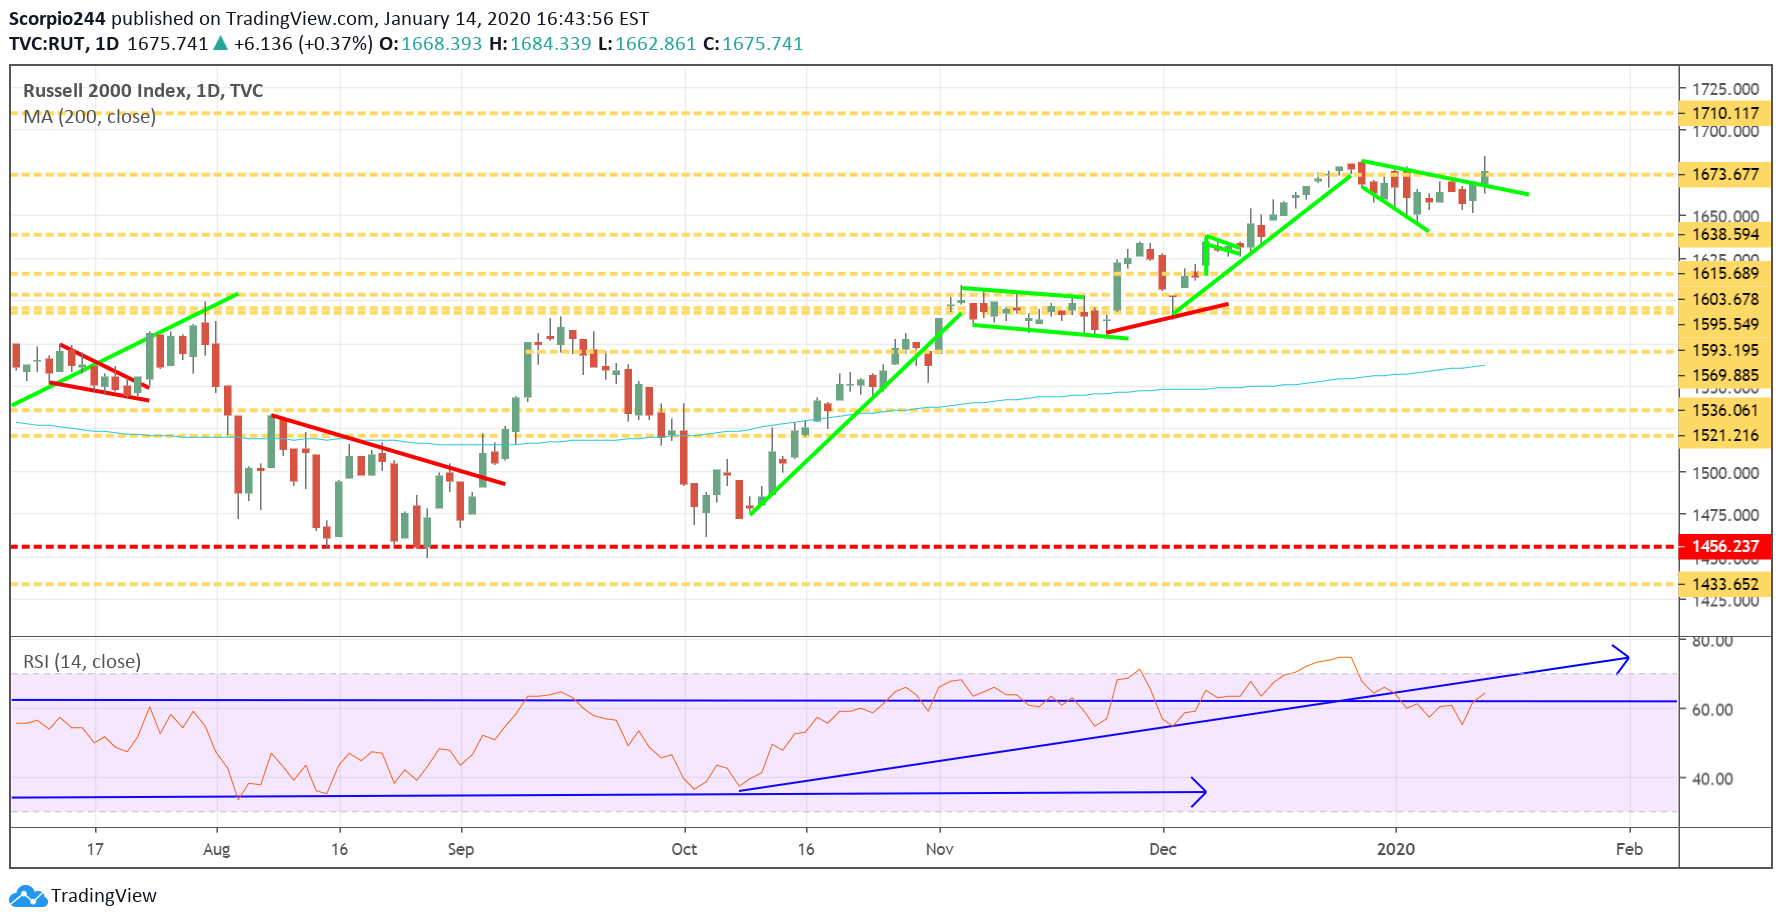
The Russell 2000, on the other hand, rose by almost 40 basis points to close at 1,675. The index soared about the megaphone pattern I have been highlighting and above resistance yesterday, 1,673. While I was excited by the price action and I bought some February calls on the IWM, but then the tariff news took the wind out of my sails. Today is another day, and I think this one is starting its run higher.
Acadia (ACAD)
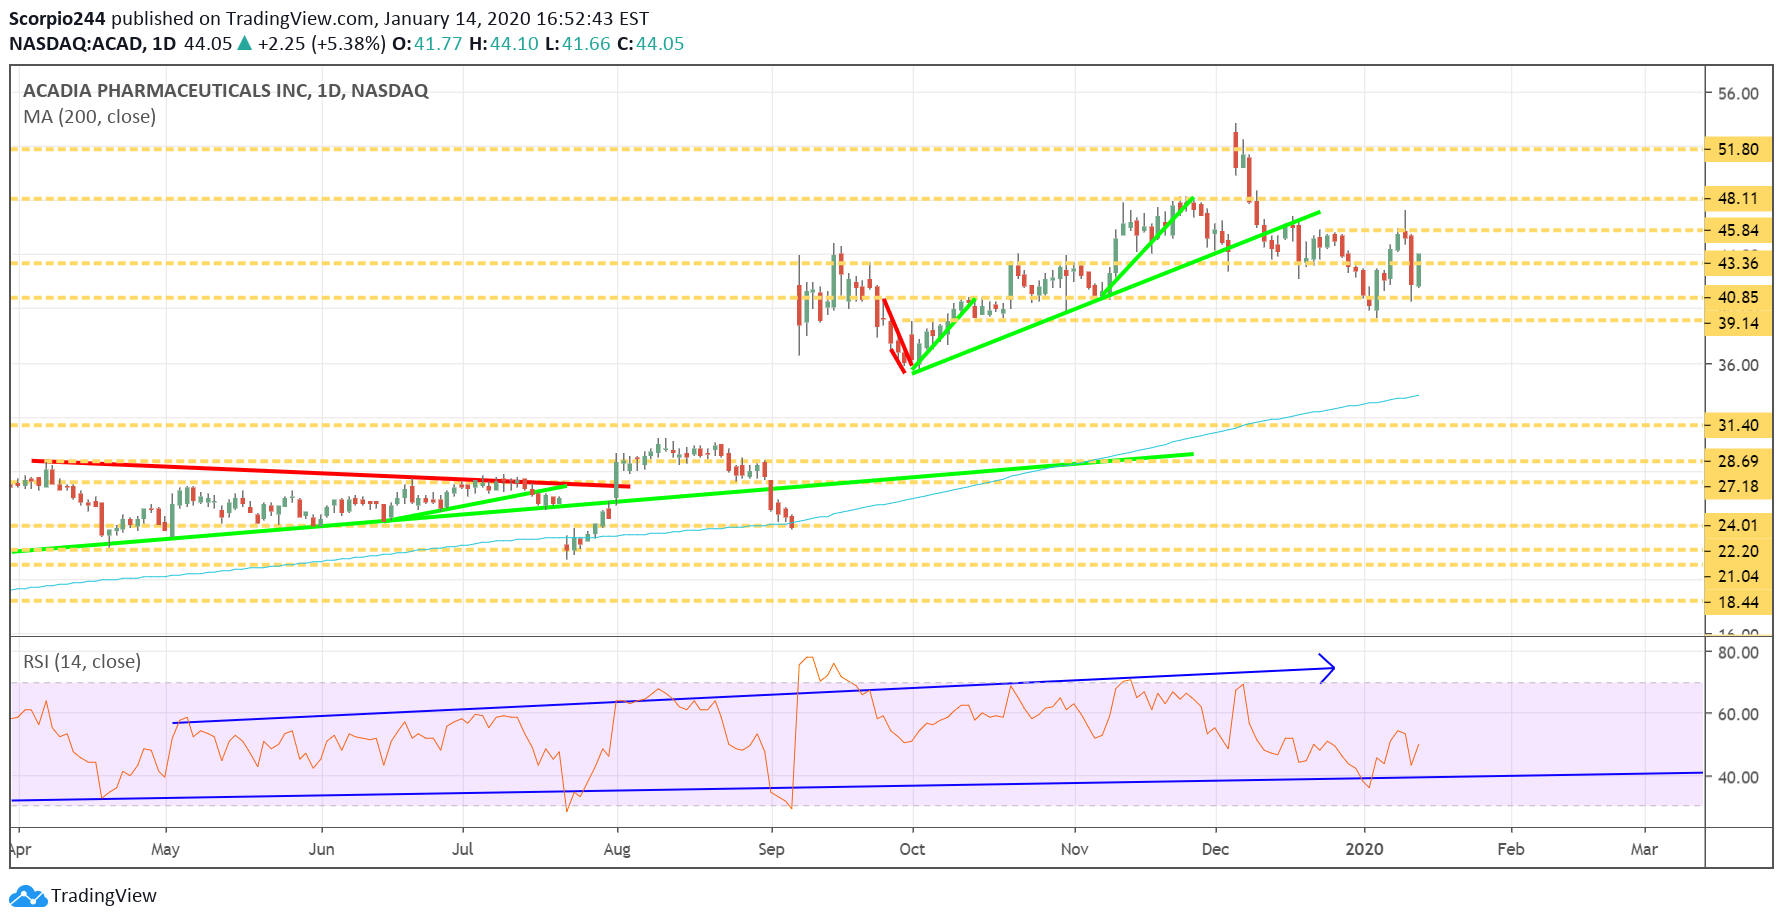
Acadia Realty (NYSE:AKR)’s presentation went off without any issues. I didn’t hear anything that should have resulted in that sharp decline yesterday. The conference yesterday confirmed my view that the MDD trials are running ahead of schedule, with a readout on one coming by the end of the year. The company reiterated that it only needs one more positive MDD trial. The stock recovered some of Monday’s losses, rising by over 5%.
Tesla (TSLA)
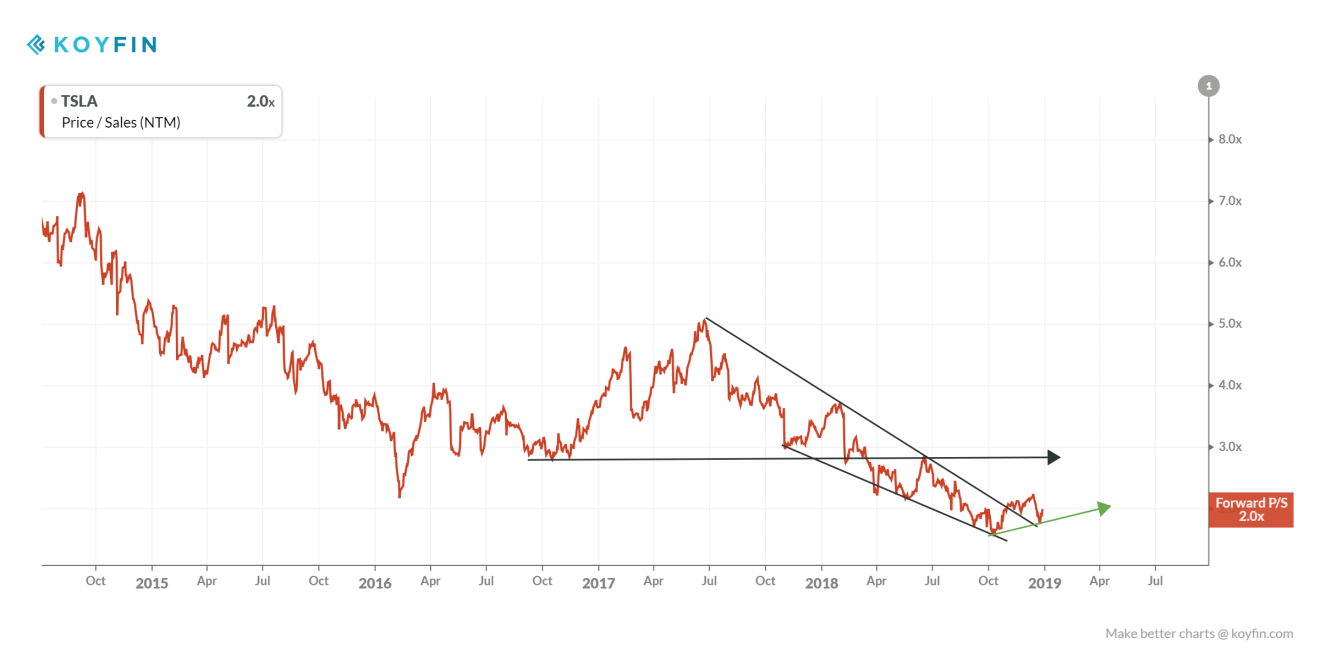
The Tesla (NASDAQ:TSLA) chart below shows that the market may be on the verge of re-rating the stock or restoring its price to sell multiple to its historical trend of about three times sales. Should that happen, the market cap would surge to around $88 billion raising the stock to roughly $492 per share.
Here is the chart:
Here is the same chart yesterday.
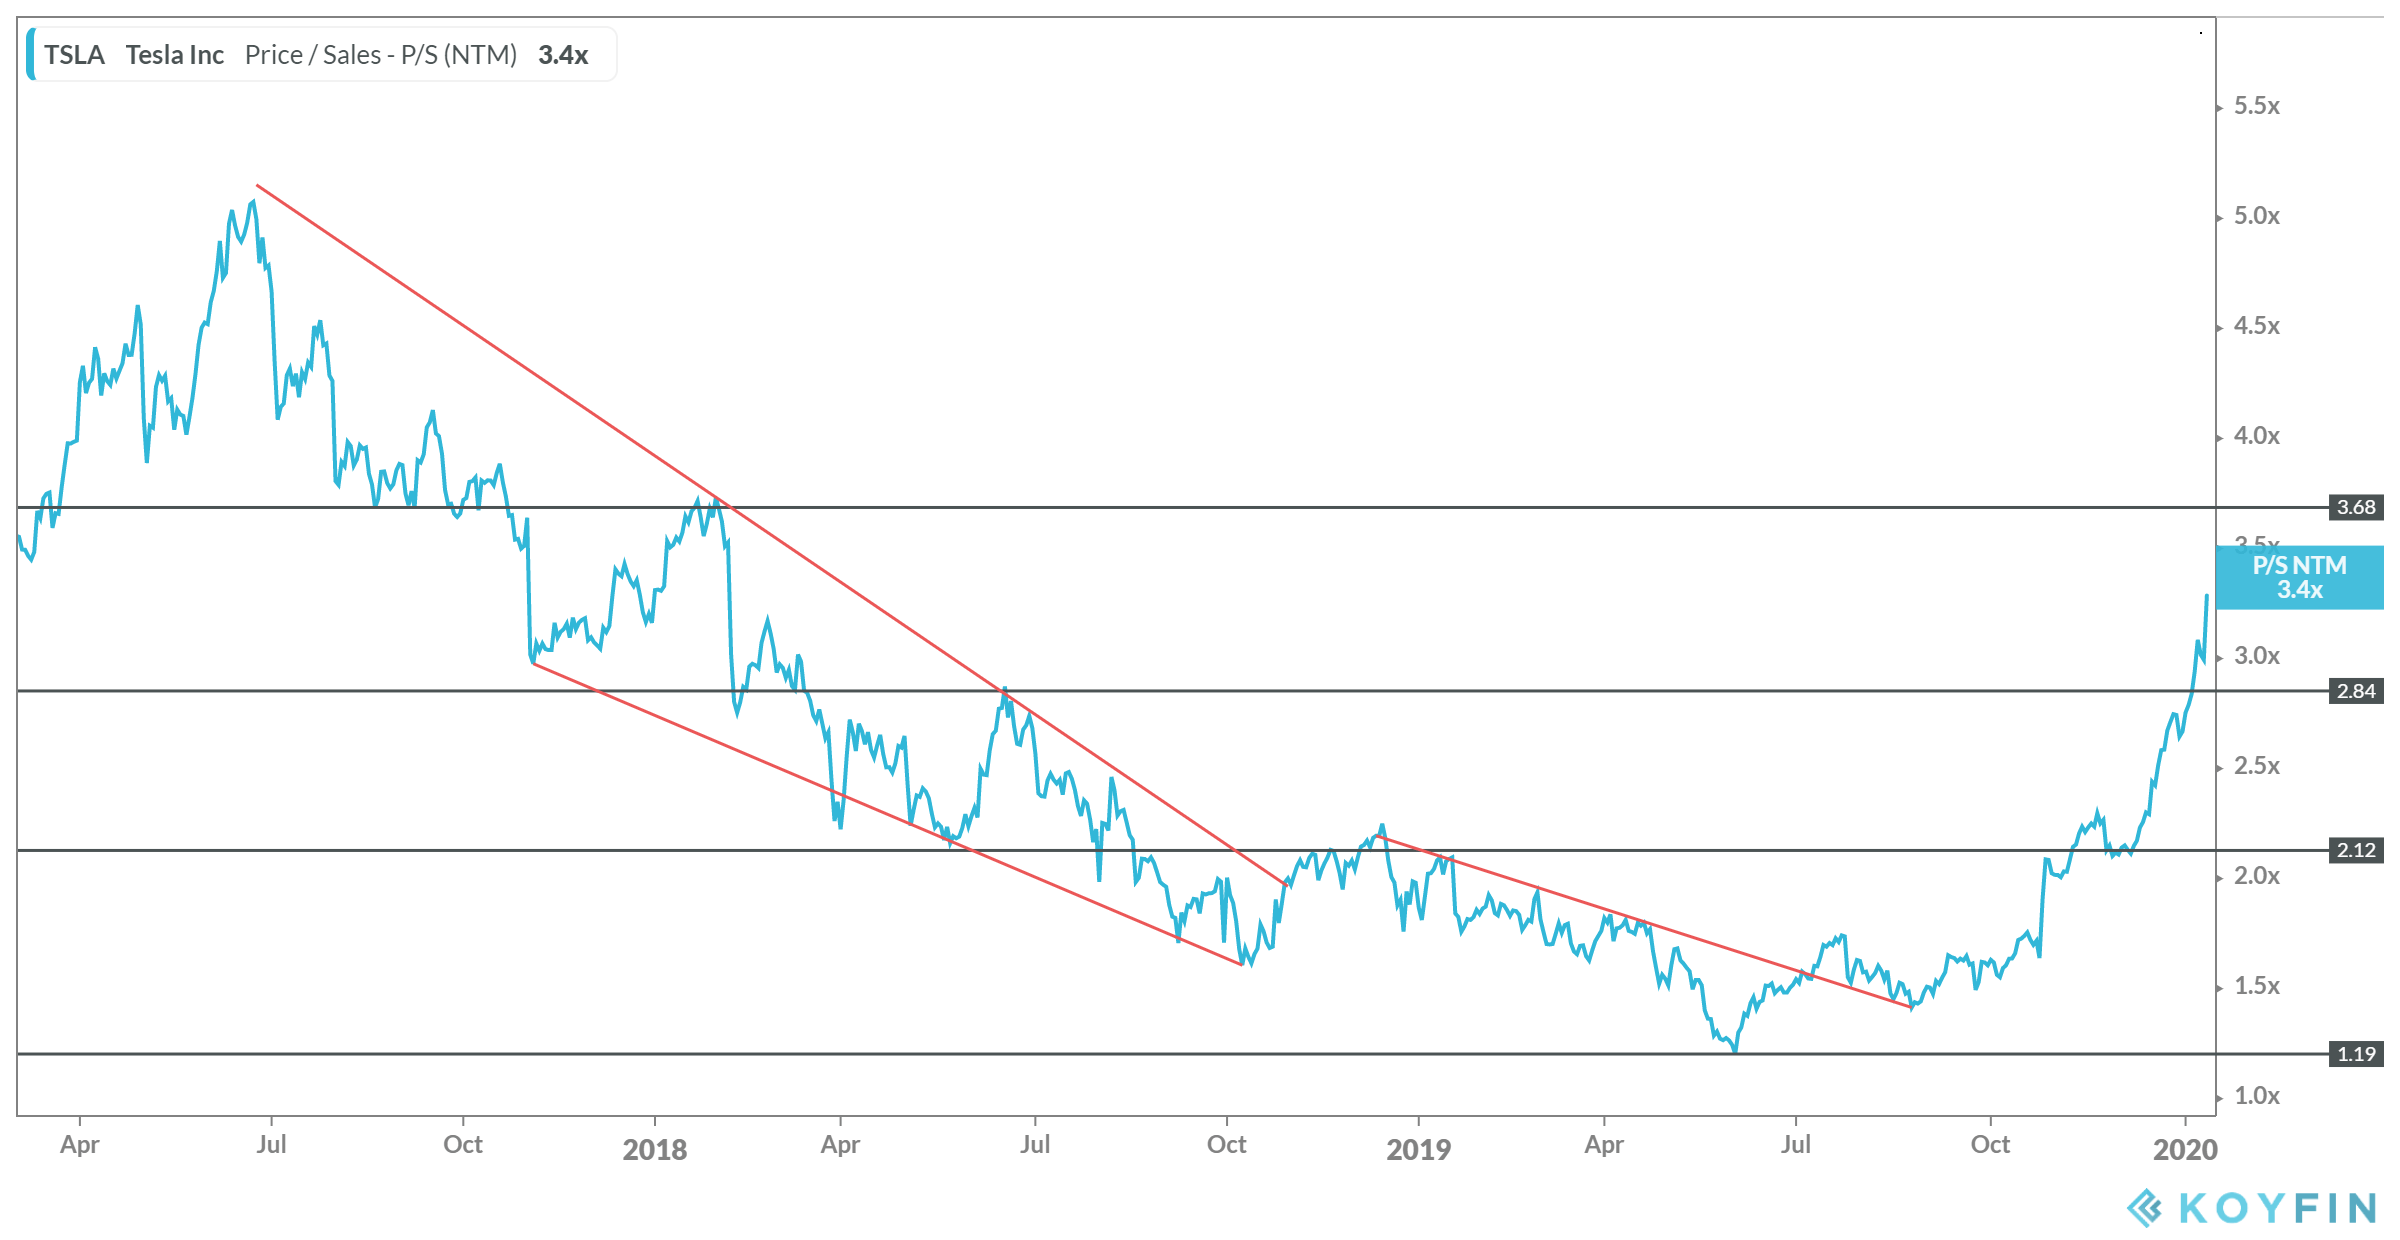
Could Tesla (NASDAQ:TSLA) continue to rise based on the price/sales ratio over the next twelve months? Sure. If revenue over the next-twelve-month is forecast at $28.9 billion and the stock stays in that range of 2.9 to 3.7 times NTM revenue estimates, the stock is likely worth between $83 billion and $107 billion in market cap, which translate to a price of about $455 to $581, assuming 184 million diluted shares outstanding.
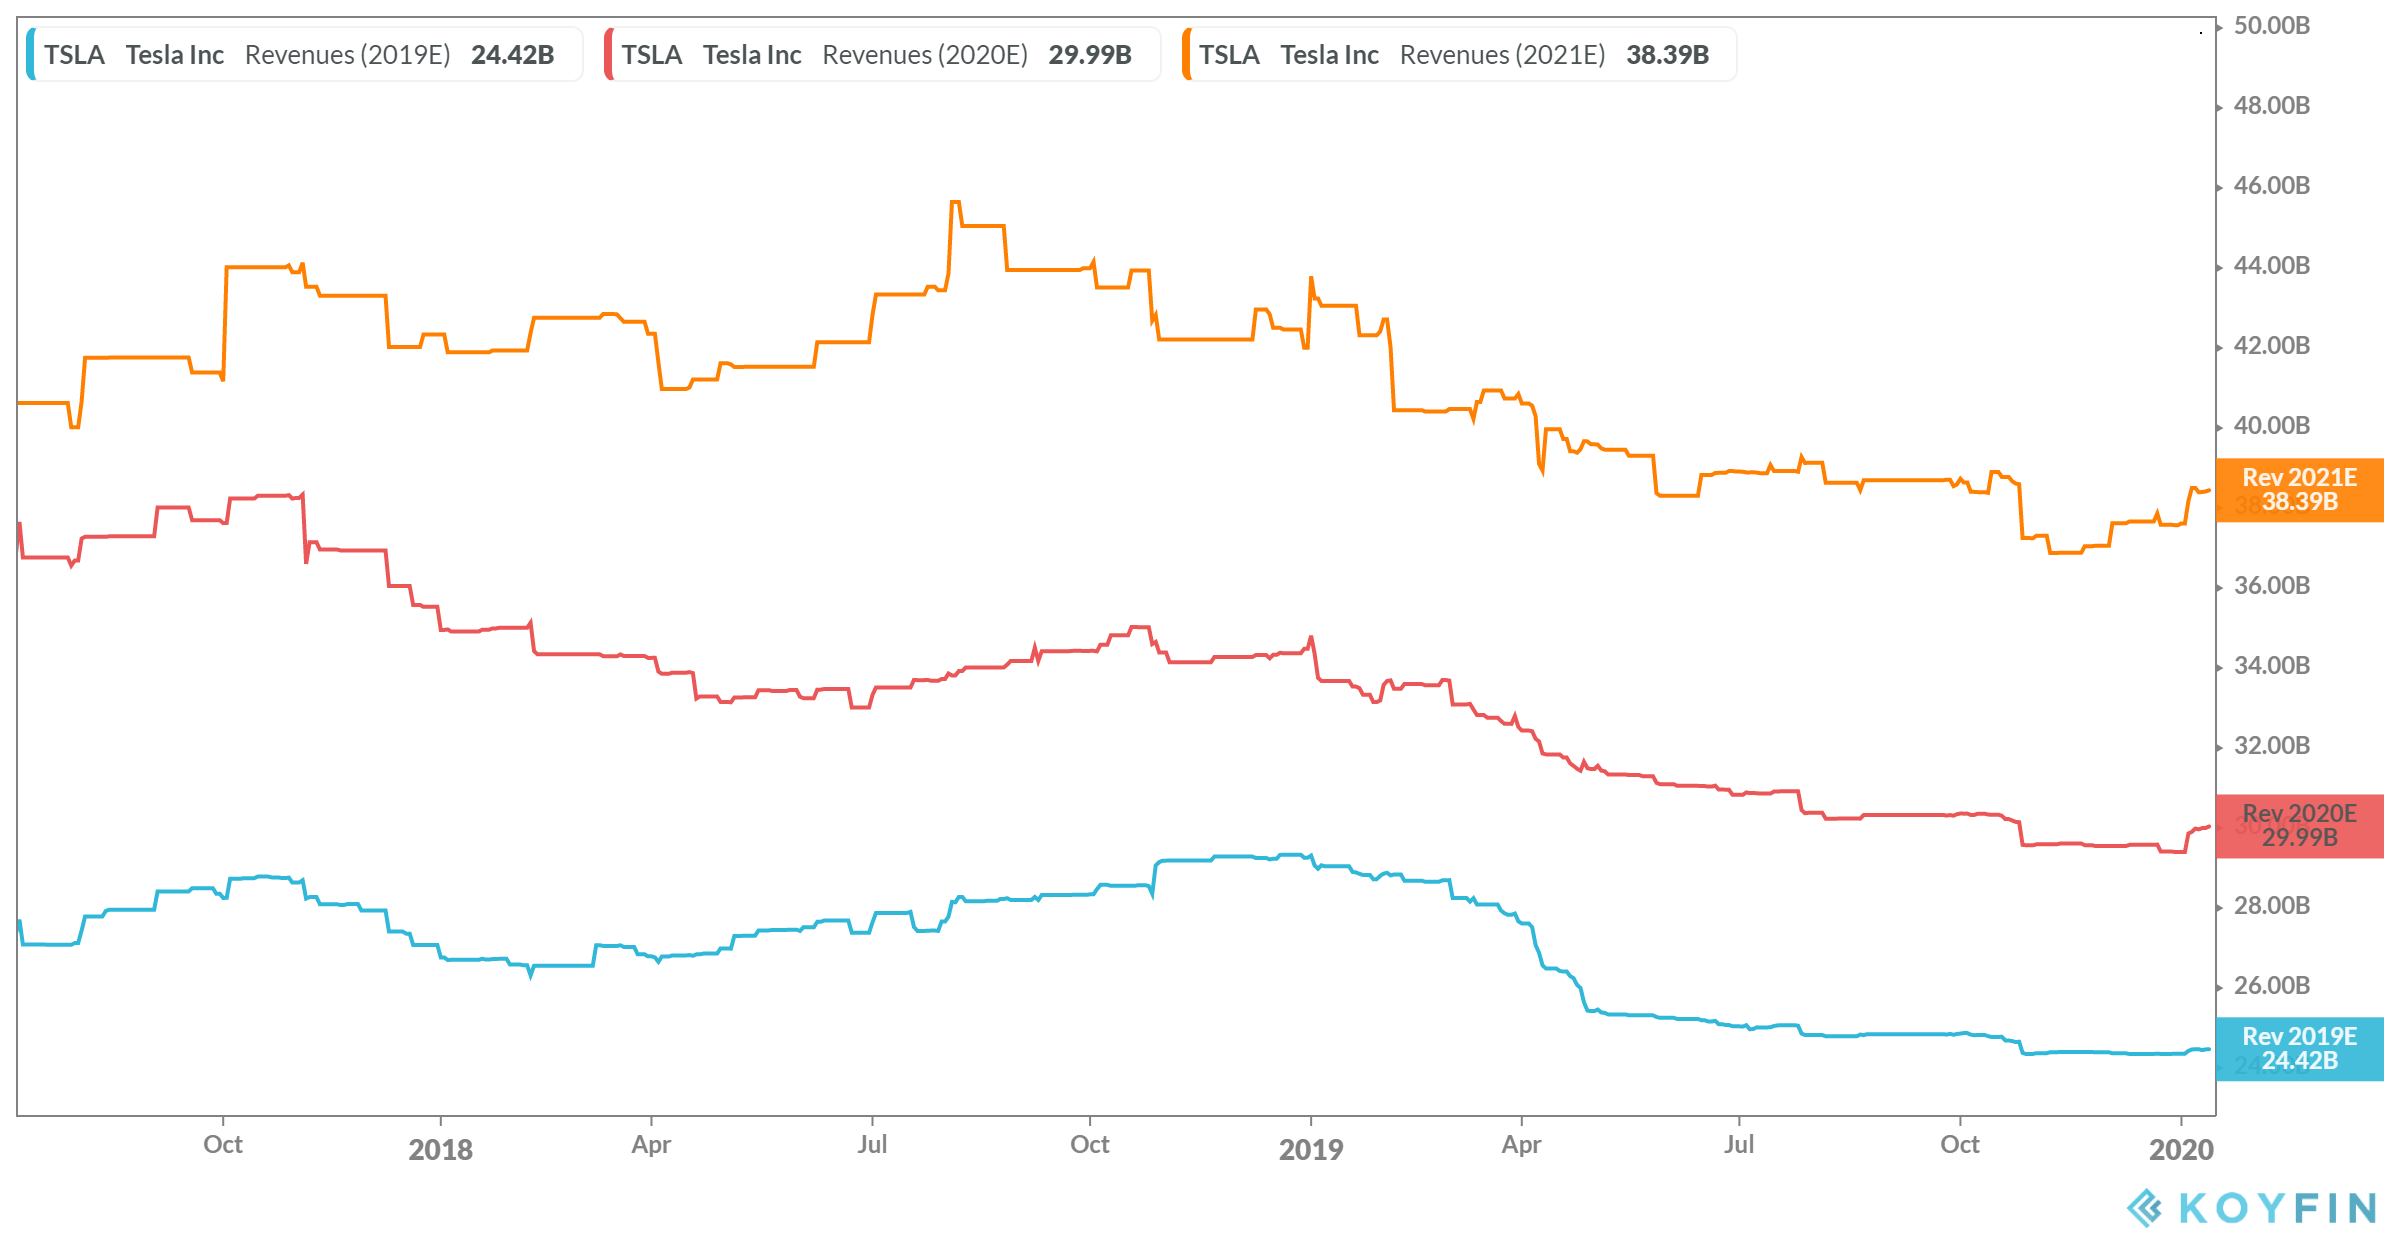
With growth ramping up and the question of sustainability out of the story, the stock likely doesn’t deserve to trade at the multiple it traded at for most of 2019. Plus, remember revenue is expected to ramp in 2020 and 2021 so that sales multiple could actually fall, unless the stock continues to rises sharply.
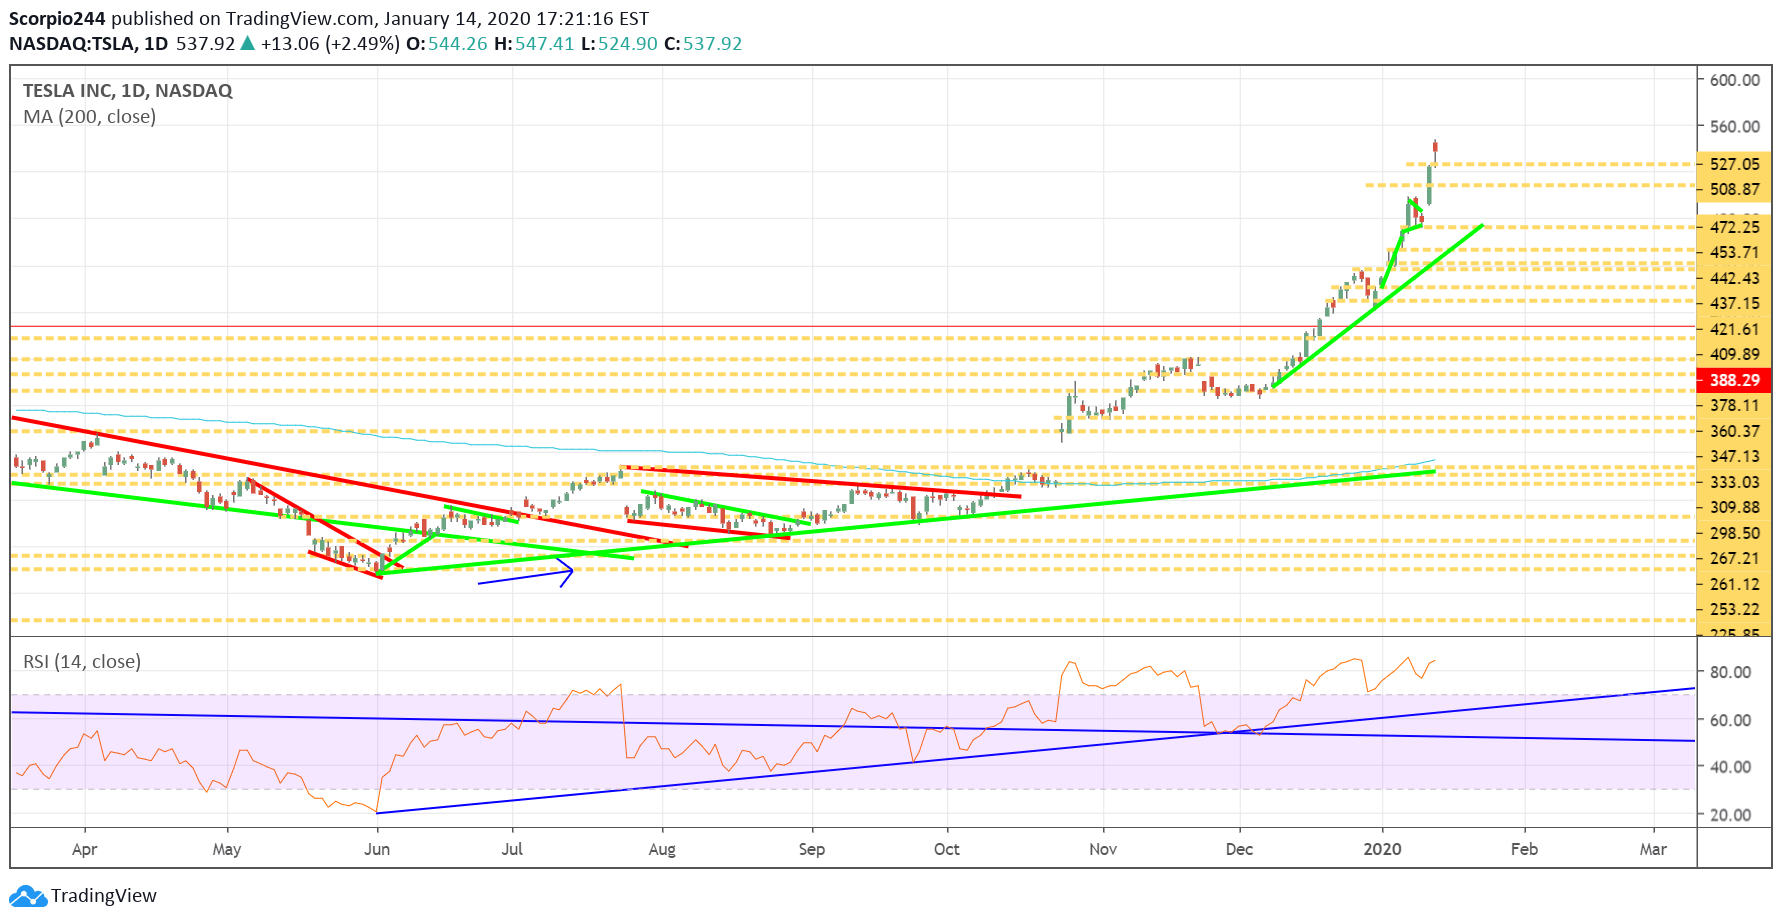
So could shares rise further? Sounds like it.
Amazon (AMZN)
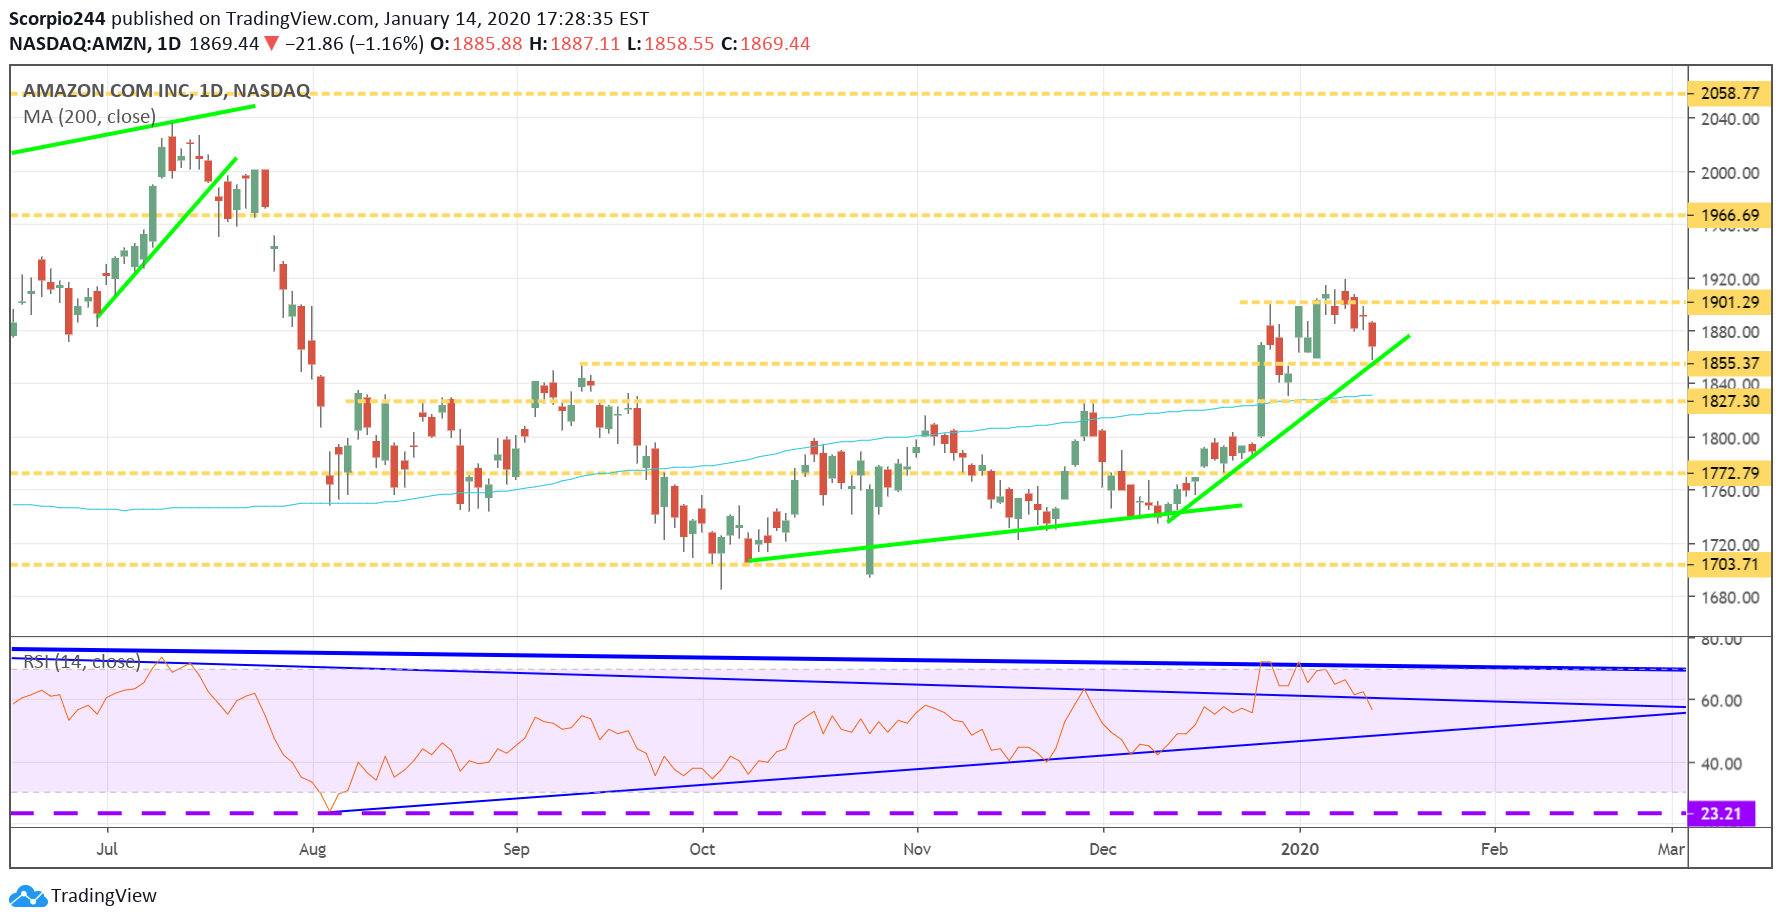
Amazon (NASDAQ:AMZN) is back to the uptrend, and now the stock needs to bounce and get above $1900, or the stock is in trouble.
Netflix (NFLX)
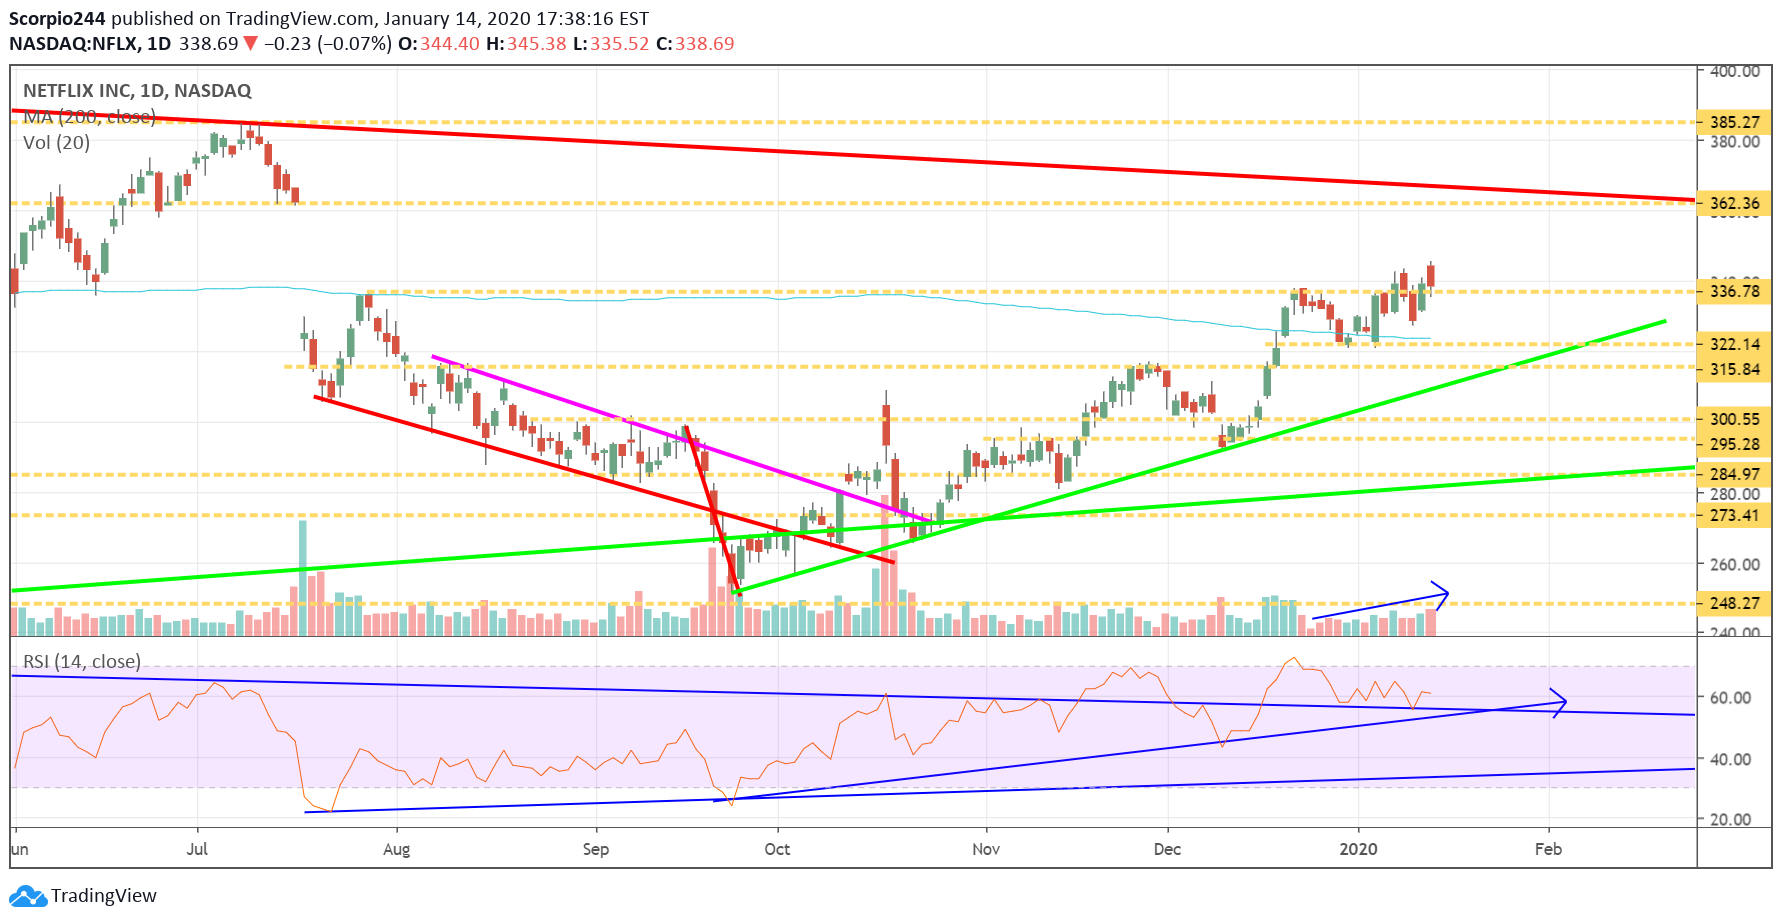
Netflix (NASDAQ:NFLX) has been struggling around $340; the bears are trying their hardest to contain the stock. Volume levels continue to rise, and the RSI is still pointing to higher prices, and so I think the stock is heading higher in an attempt to fill that gap. Maybe I need more patience.
