Who is Kevin Hassett? Wolfe looks at the Trump ally tipped to become Fed Chair.
Stocks had one of those strange days on Friday, where the strong BLS job report should have sent shares higher, but the data didn’t help. The only thing I could think of that may have played into the lack of reaction was that perhaps the strong data would sap the odds of a rate cut later this year that the market had been starting to price in, however, that appears not to be the case. In fact, the CME group is showing the same 41% chance of a cut.
Perhaps it was merely the effect of nervousness ahead of the weekend, in the middle of the coronavirus. Plus, it was coming off a big week with the S&P 500 up almost 4%. So profit-taking? It seems like a good chance that was the case.
S&P 500 (SPY)
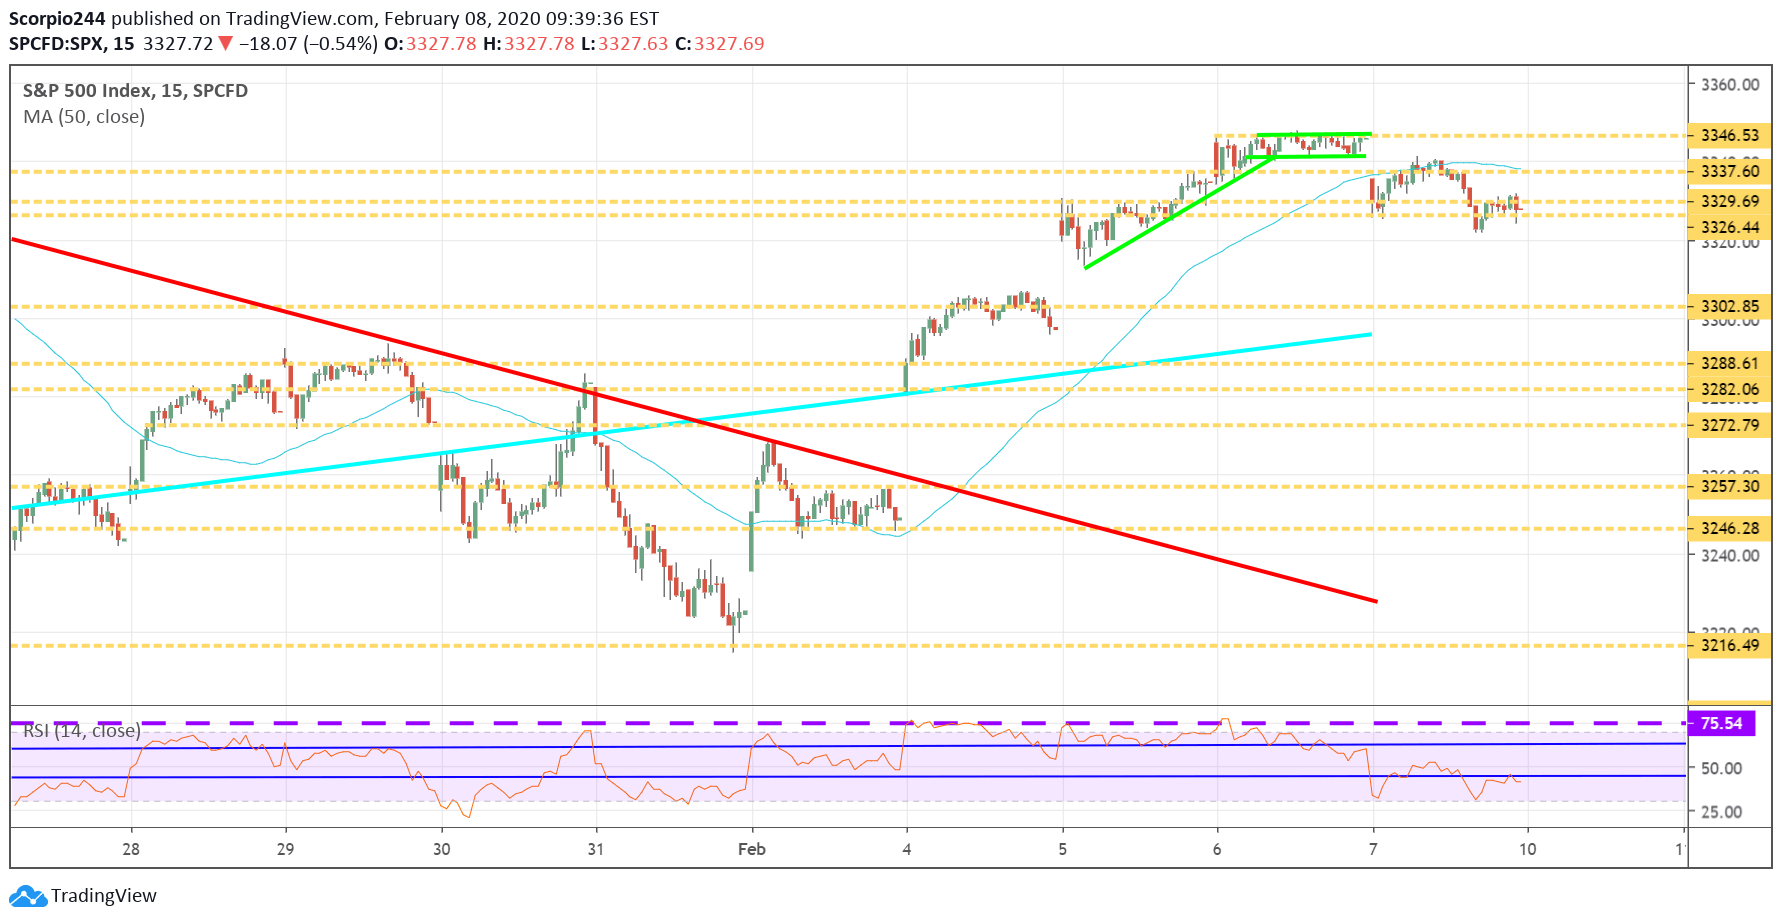
There are still some gaps to fill on the chart for the S&P 500, down at 3,300. However, the {{0|S&P 500} had a chance to fill that gap on Friday when it tested support a couple of times, and it managed to hold firm at 3,326. I think as long as the newsflow is quite over the weekend, we can see the market continue higher to start the week and push back to the highs around 3,340.
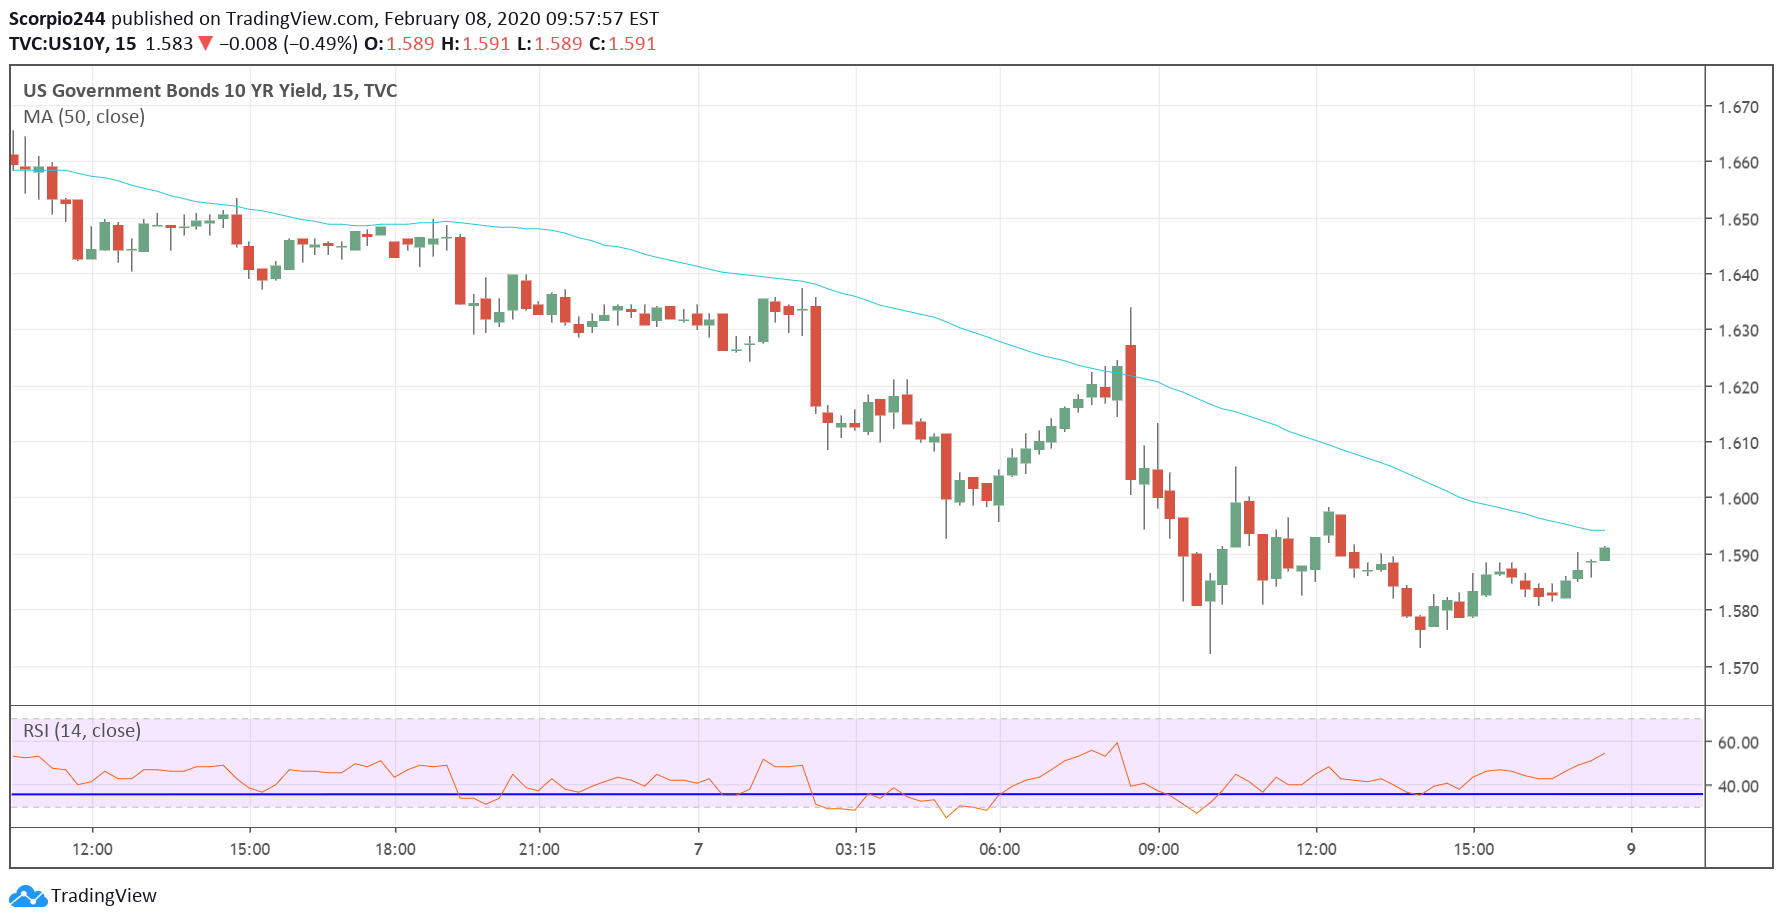
Yields moved lower as well on the 10-year, after the jobs too.
The one interesting thing was the number of people that were unemployed increased this month. This could be to due to the changes in the population totals in the household survey because the size of the overall population dropped as well.

Uber (UBER)
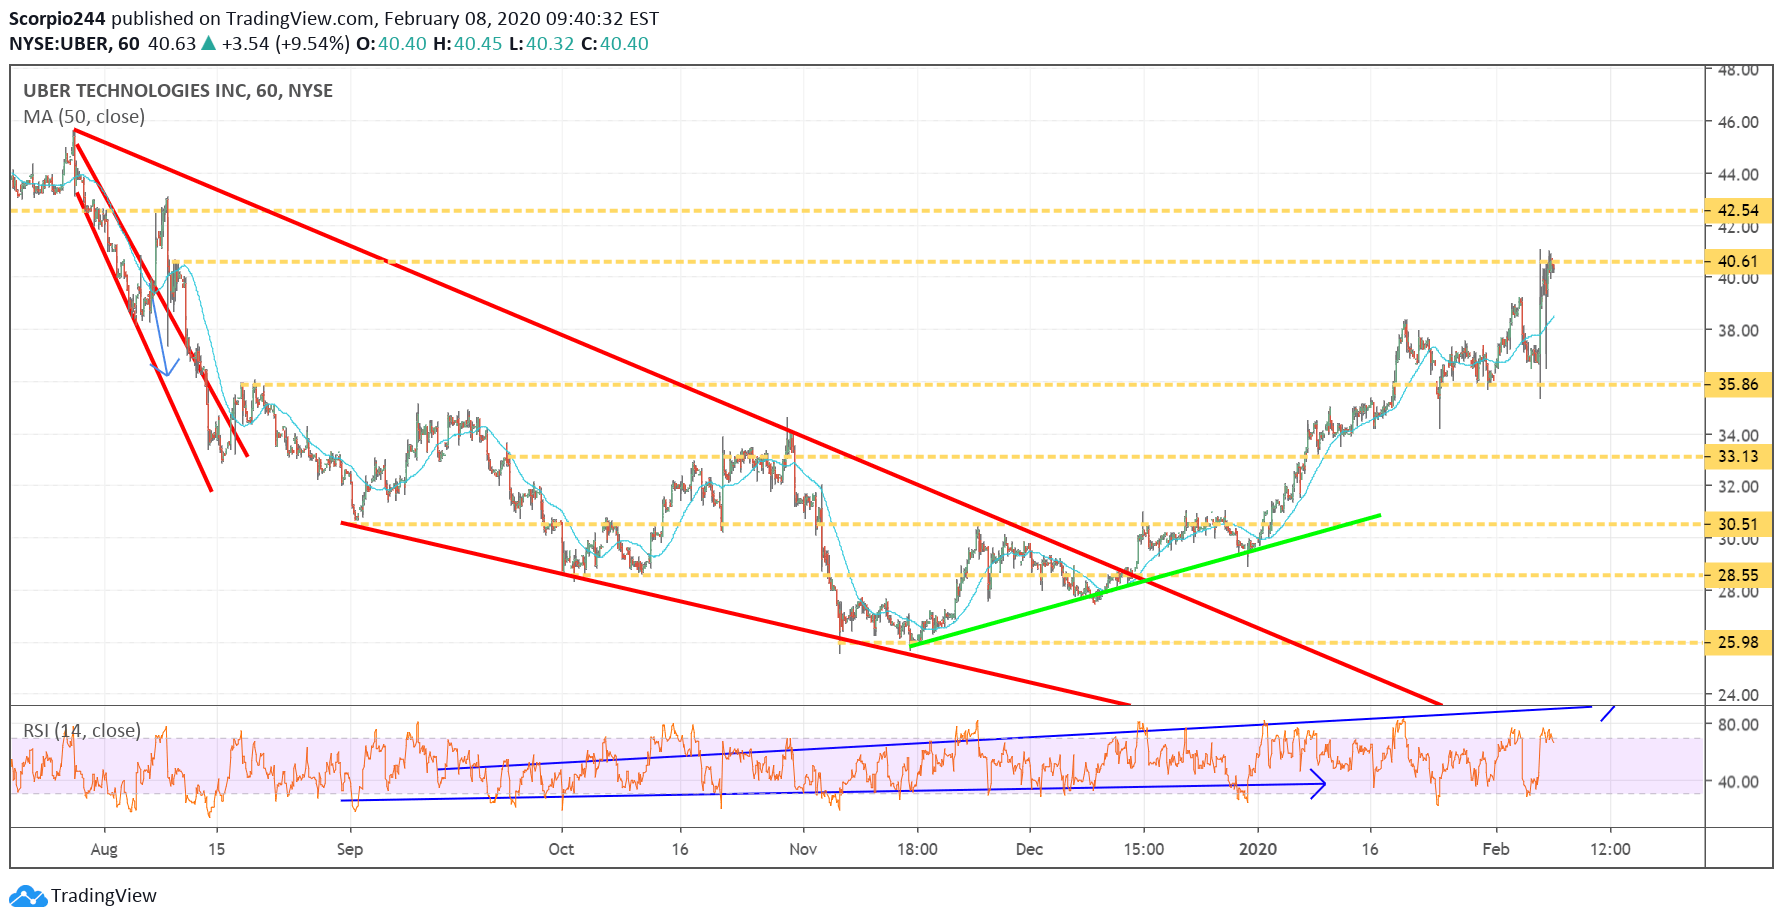
Uber (NYSE:UBER) had a big day after reporting strong results and providing a pretty rosy outlook for a path to profitability. At least for now, the bulls appear to be winning the argument, and the stock rose to resistance at $40.60.
Apple (AAPL)
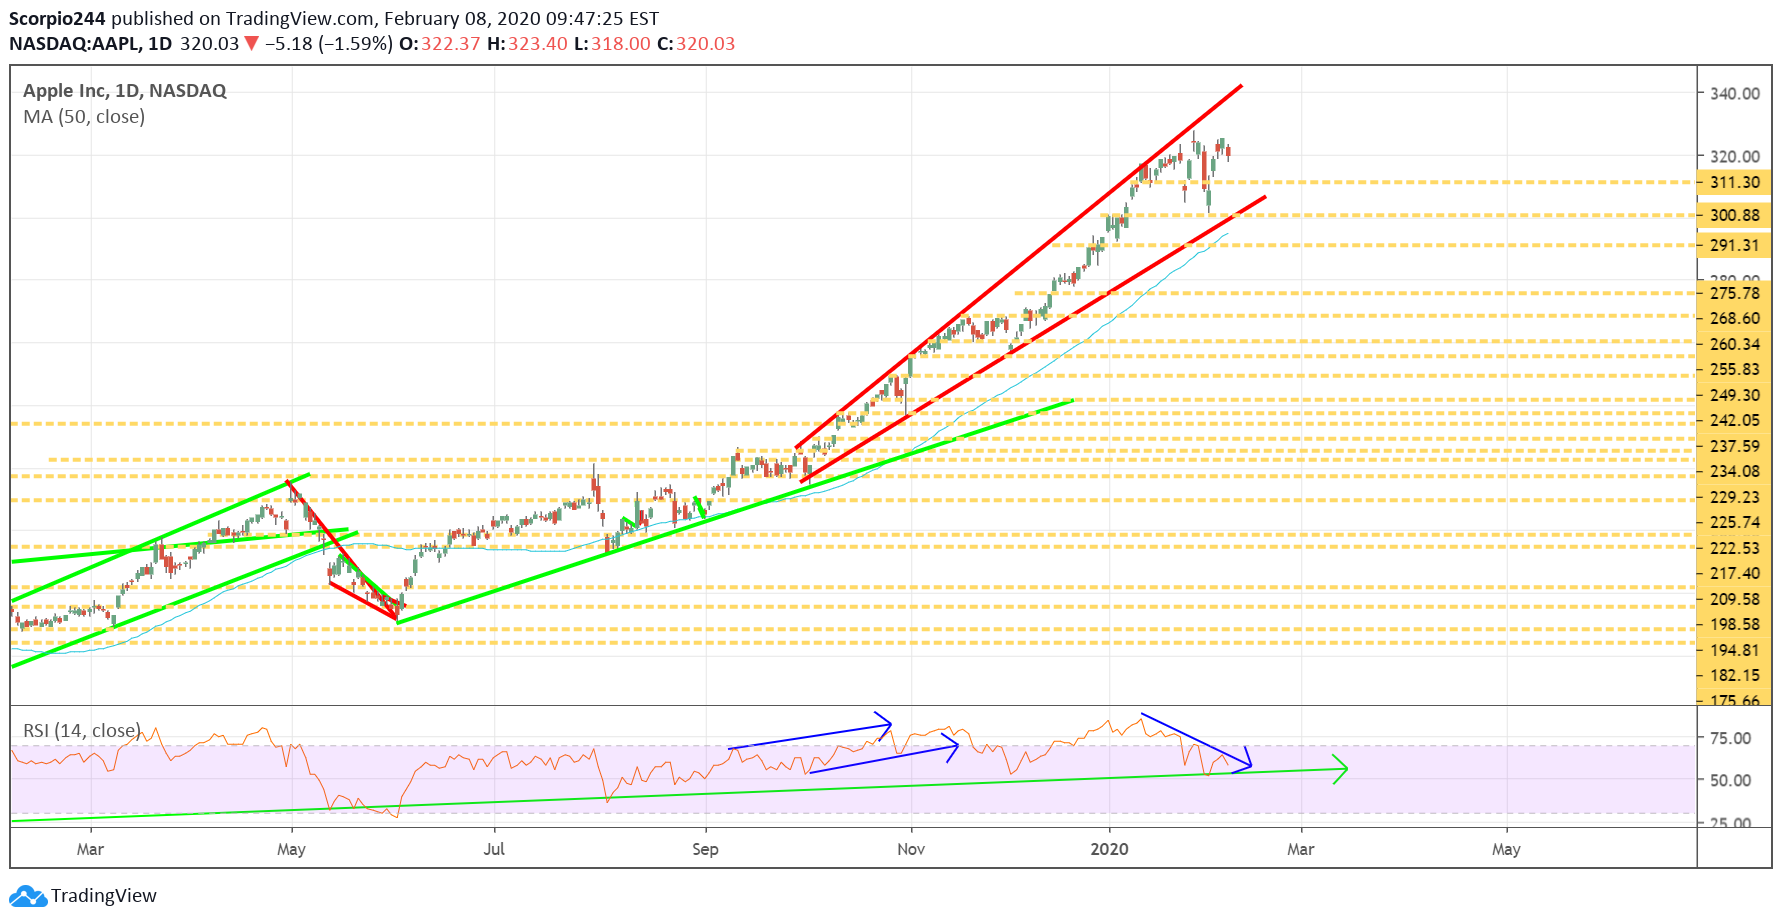
Apple Inc (NASDAQ:AAPL)’s stock for the first time is showing some fatigue, with what appears to be a bearish divergence forming, noted by the declining RSI. Should the stock fall, it is likely to drop to around $311. However, the longer-term uptrend is still firmly in place, and I think that means that instead of the stock falling, it consolidates sideways. I also noted some bullish options betting on Friday.
Facebook (FB)
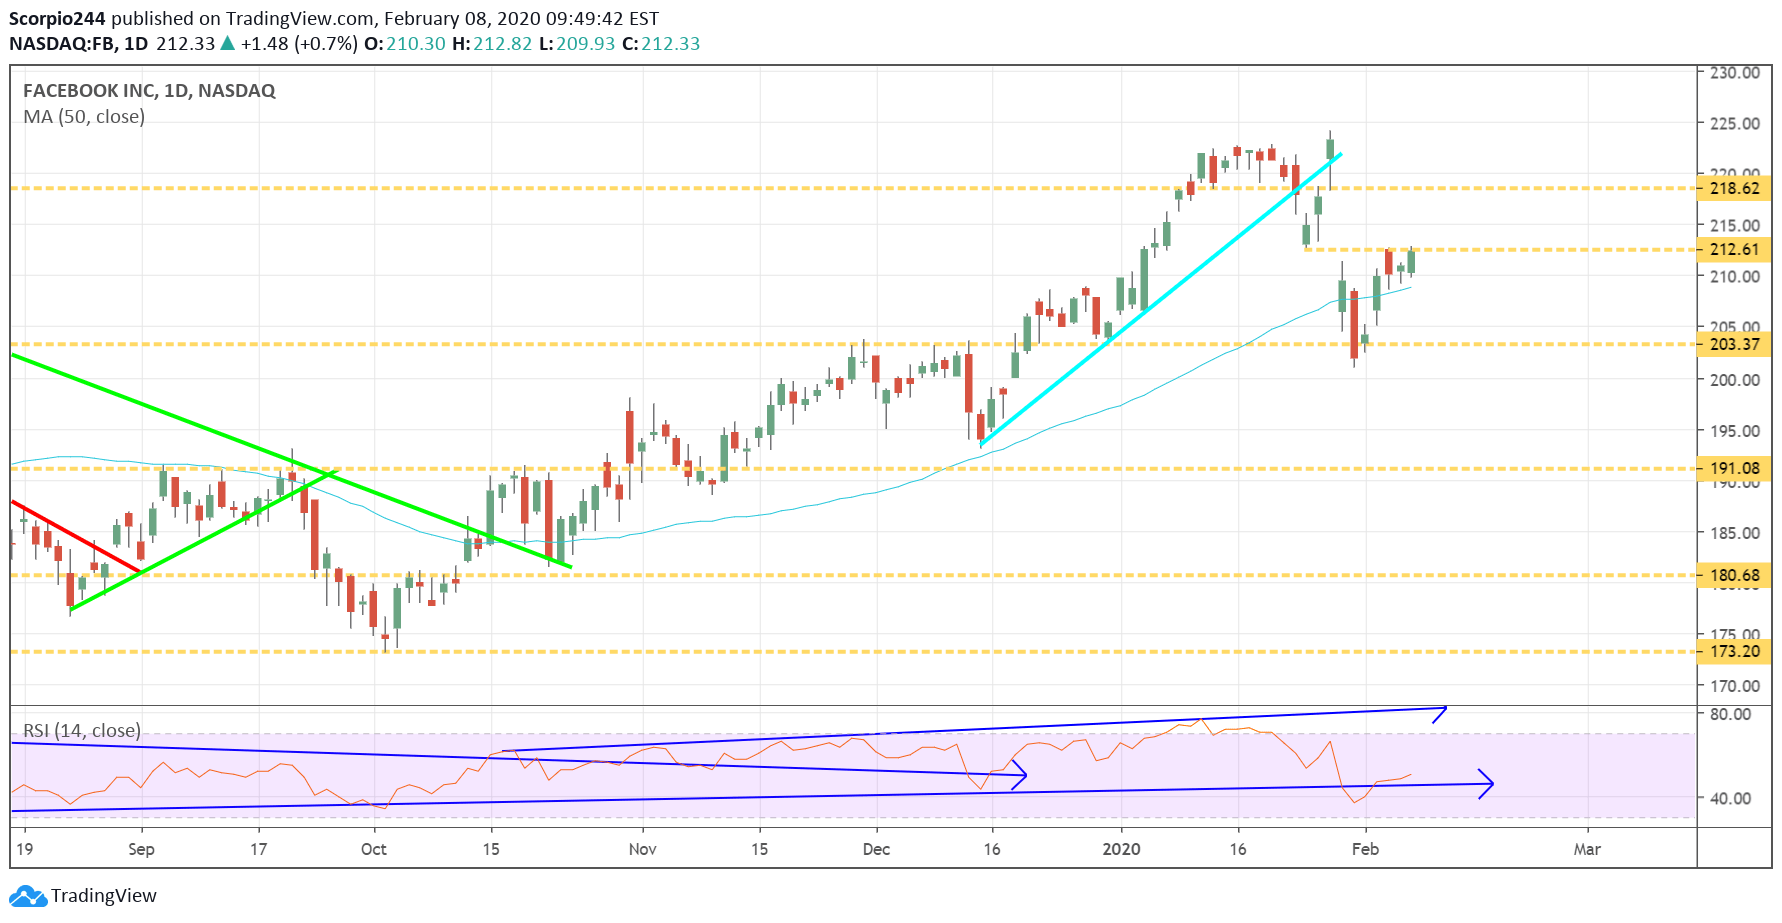
Facebook (NASDAQ:FB) has been struggling at resistance at $212, and I did see some big bearish bets placed on Facebook. I think the stock falls to $203, with a big chance it goes to around $191.
Microsoft (MSFT)
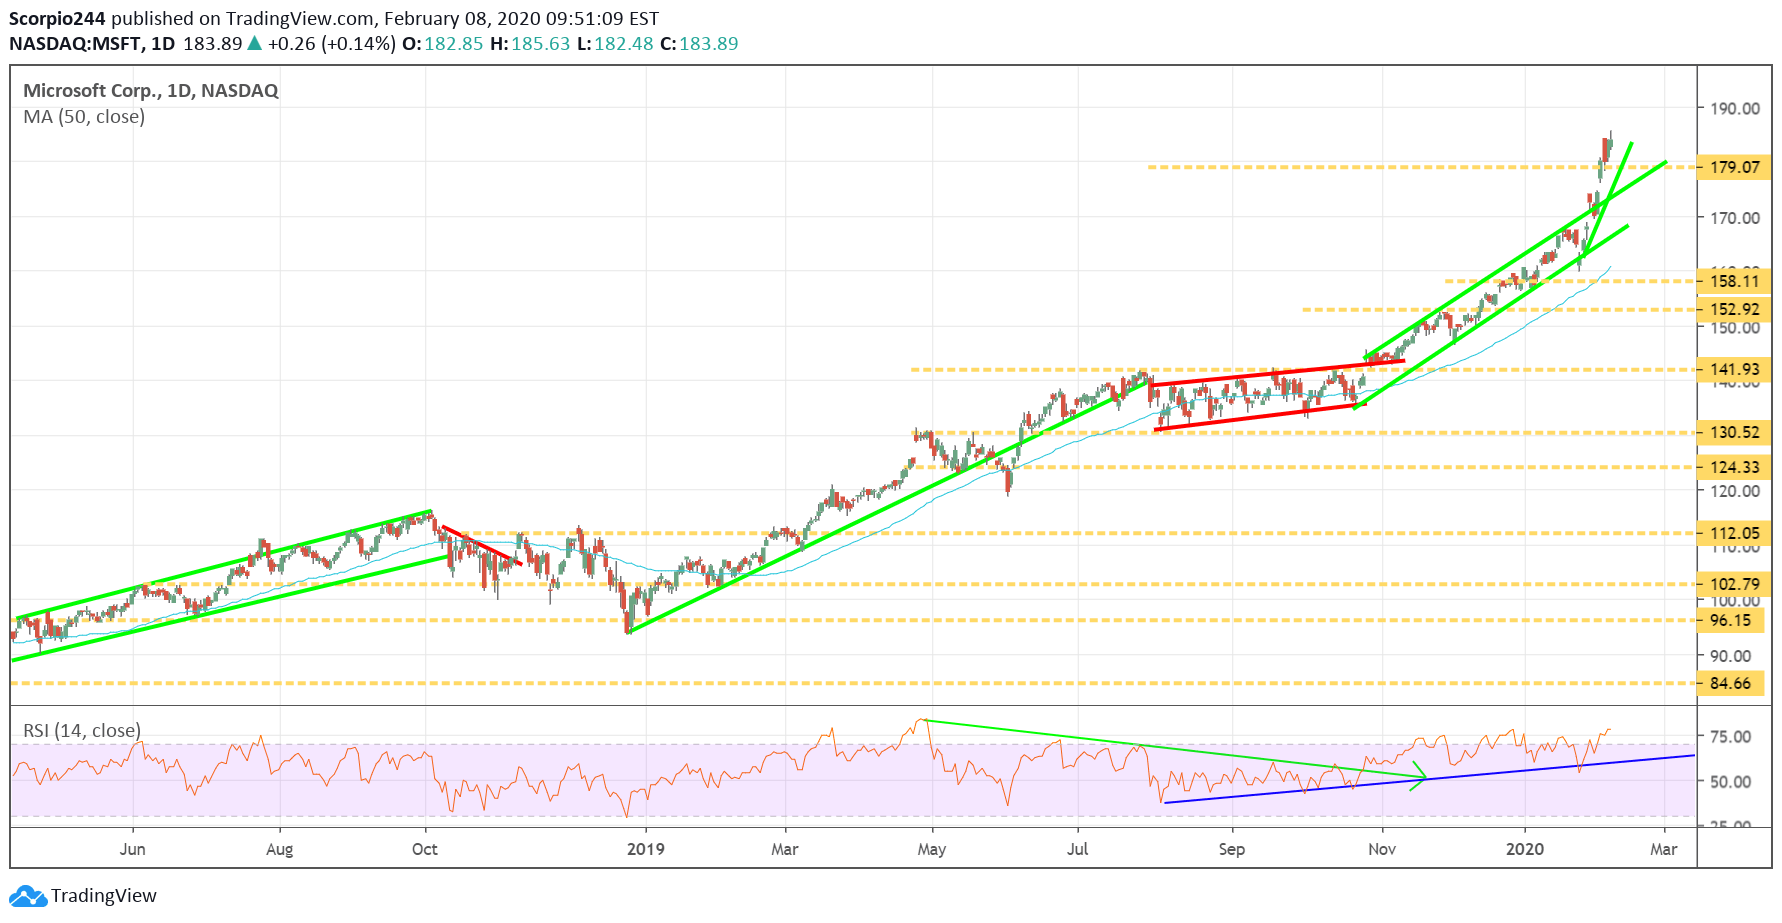
Microsoft (NASDAQ:MSFT) has been ripping lately and some significant bullish options suggest that the stock keeps climbing, perhaps to as high as $200.
Twitter (TWTR)
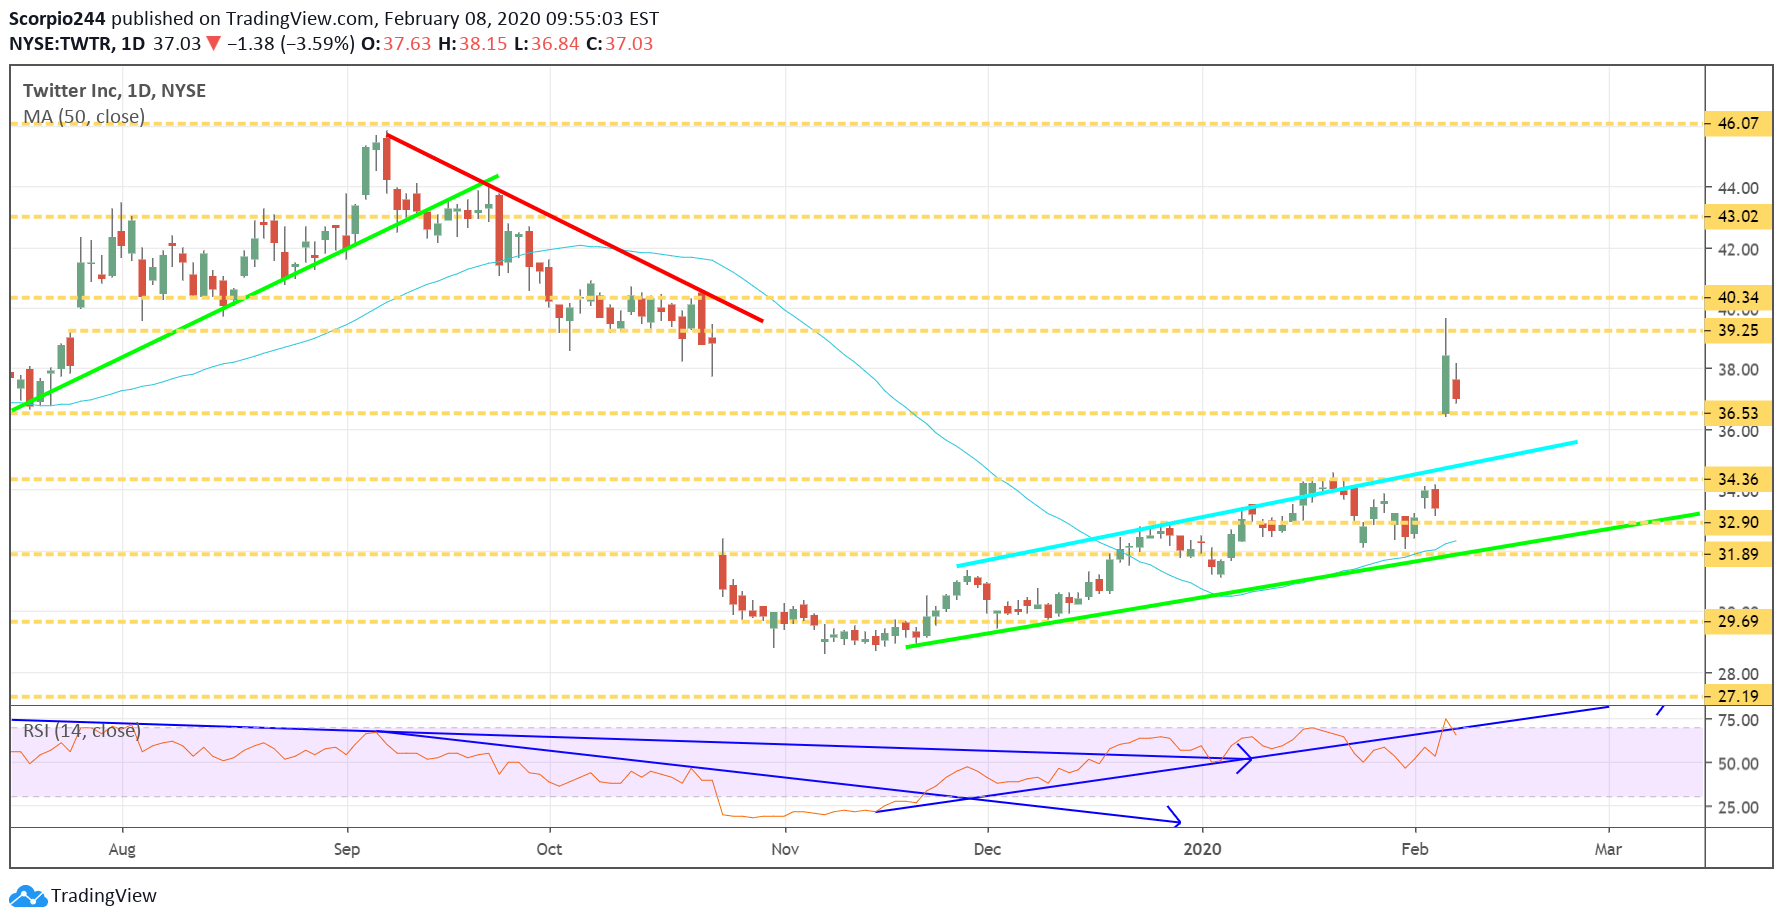
Twitter (NYSE:TWTR) did not go as expected; I had thought the stock would drop following the results, based on bearish betting. Clearly, that was wrong. The stock did fail at resistance on Thursday, around $39.25, and the gap from last quarter’s results is now filled. There is, of course, a new gap created which means shares could fall back to $34.35 in the weeks ahead.
