S&P 500
Stocks slumped on Wednesday, with the S&P 500 SPY falling by just over 2.1%, while the Invesco QQQ Trust (NASDAQ:QQQ) dropped by about 2.6%. Overall, it was a very weak day, with the Russell 2000 down 3.5%, there was no sector spared, except energy.
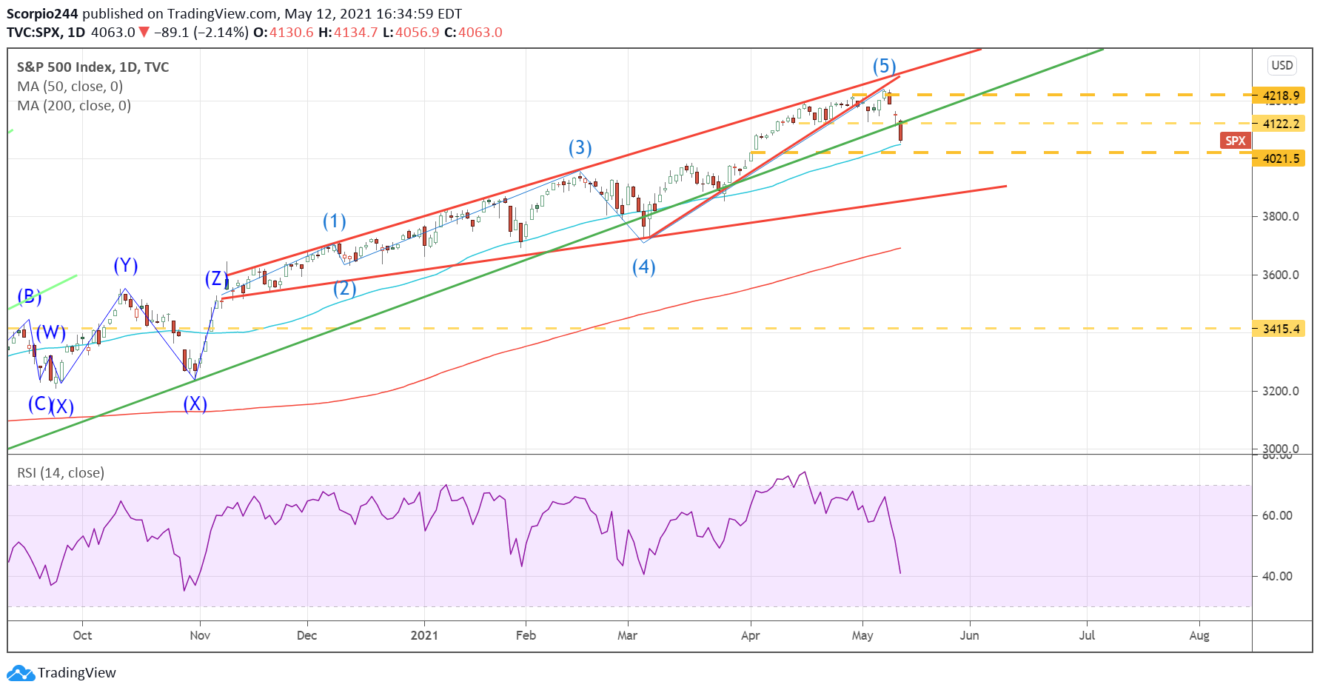
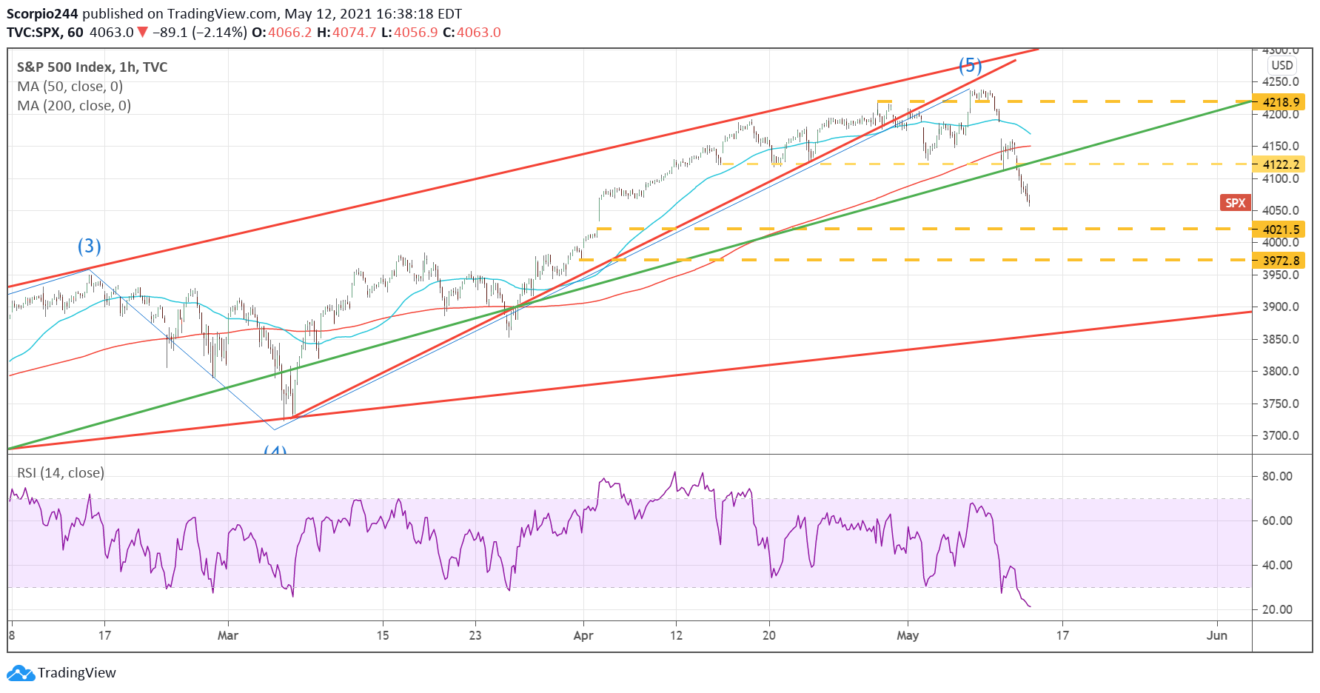
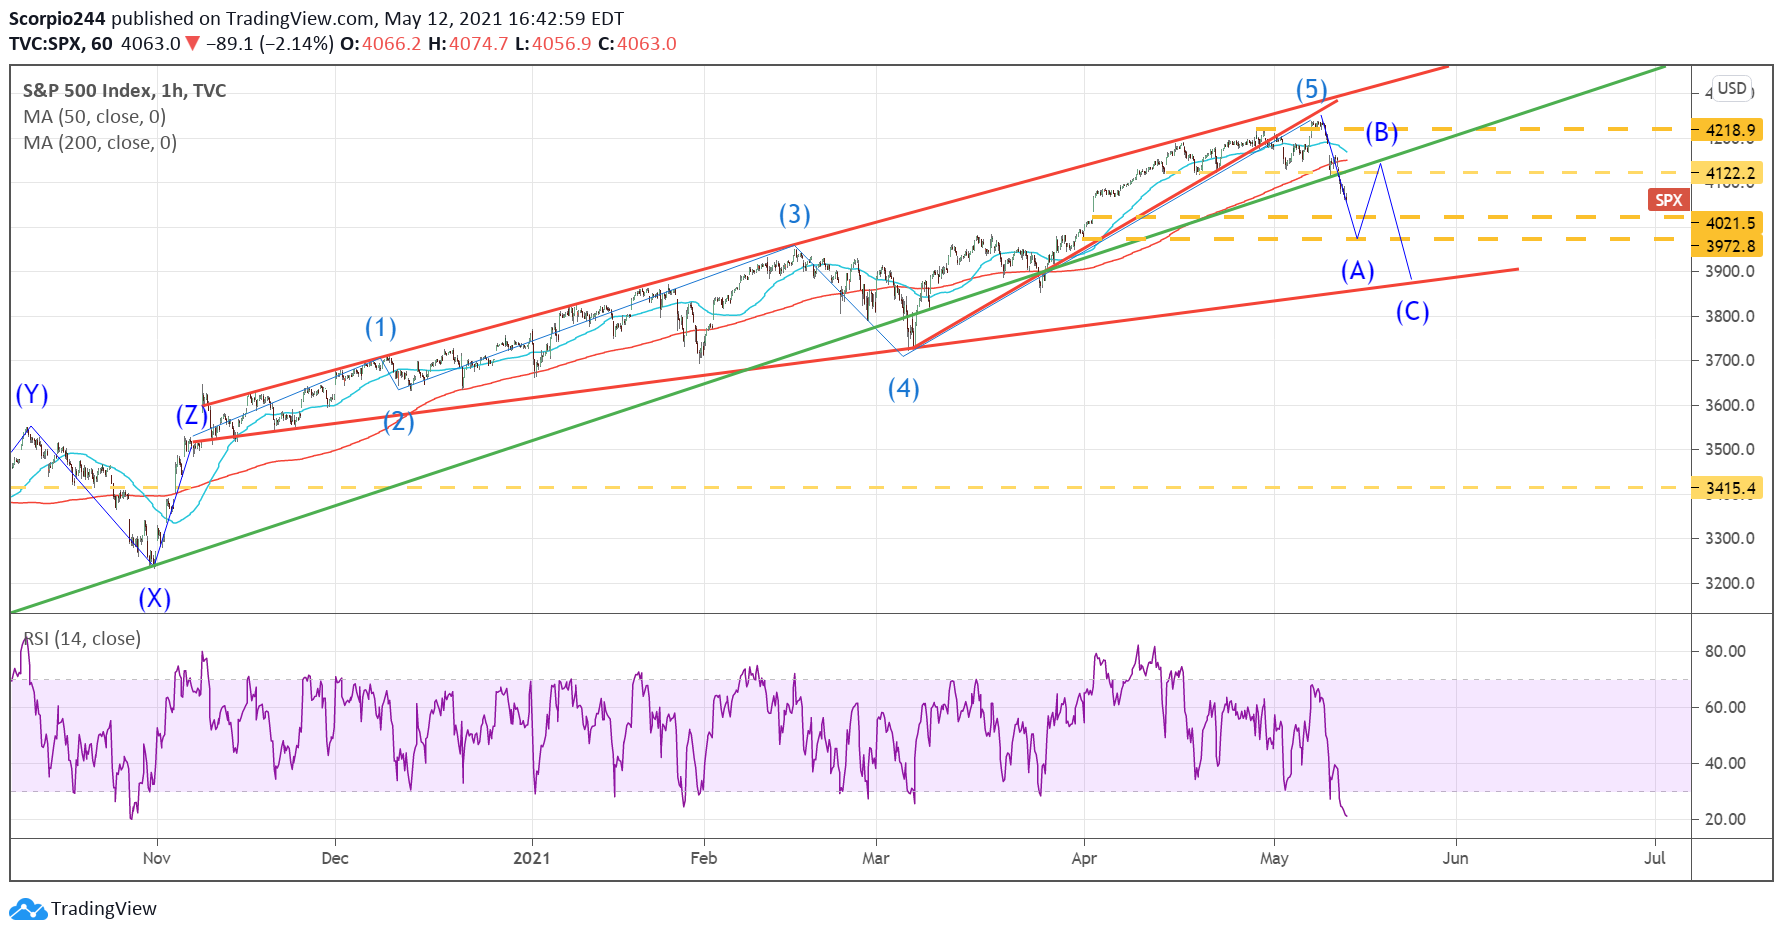
It was actually a pretty important day for the S&P 500 because we closed below the March 2020 trend line for just the second time. The last time we closed below the trend was on Mar. 4. So if we continue to move lower today, it would indicate that the trend line is broken.
It could be a significant shift in long-term trends. We also finished the day just above the 50-day moving average.
Ideally, I would like to see the index fall back to that 3960 level I spoke about in the middle of April that the market chose to ignore. It would amount to roughly 62% retracement of the wave 5 moves higher. It would make a nice place also for the completion of the first wave lower; we can call it “A.”
It would take the index to the base of the broadening wedge pattern formed in the chart around 3,800 over time.
Russell 2000
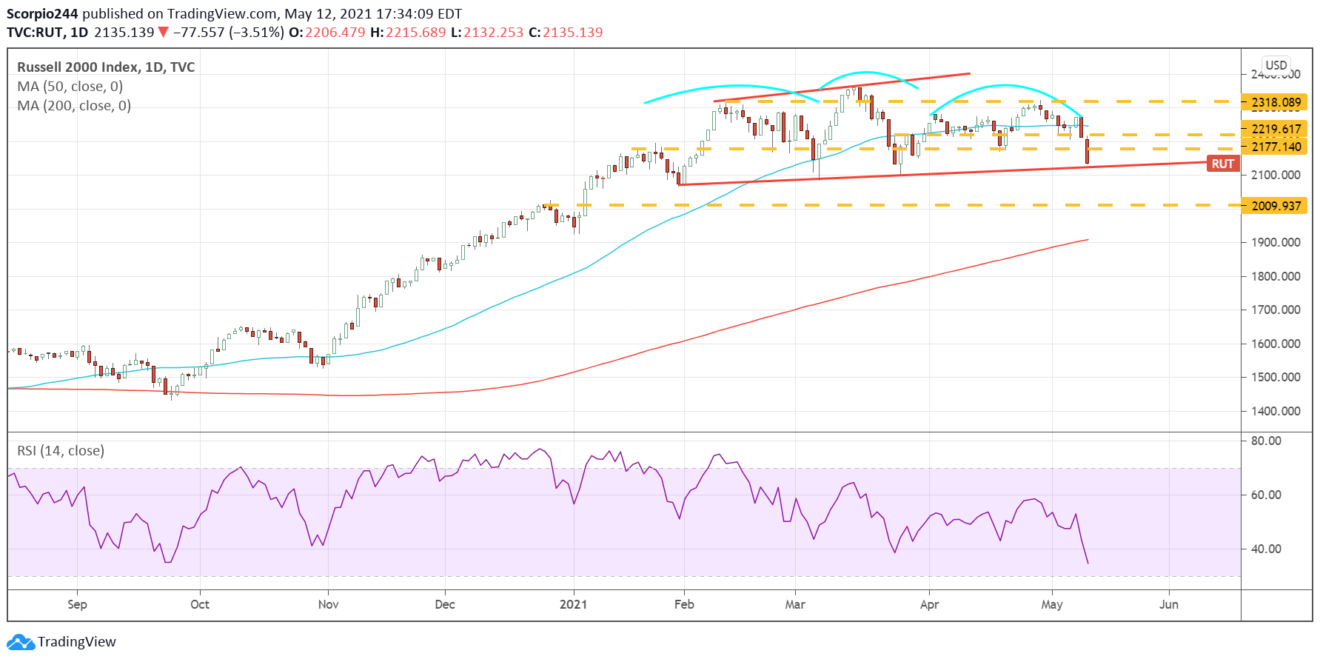
The Russell 2000 (IWM) was very close to breaking the next line in the head and shoulders pattern. A drop to 2000 would be the next level of support. However, it is likely that would only be the first stop of a much lower trip.
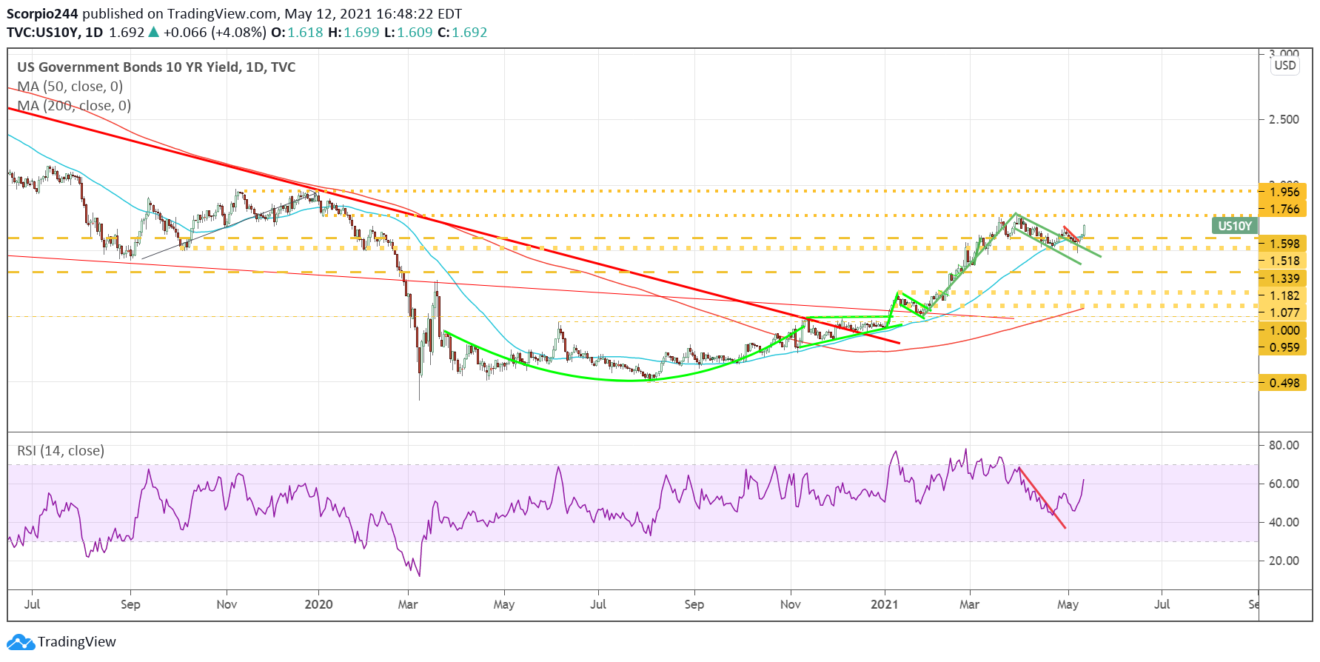
I know many people are making calls for the market to go higher or buy the dip, but I believe rates are just beginning to go higher, with the United States 10-Year potentially moving to as high as 2.35%, with or without inflation.
The economy is recovering, GDP growth should resume either in the second or third quarter of this year, and rates on the 10-year should move higher. The 10-yr breakeven inflation rate of 2.56% implies a 10-year nominal rate of 2.5% at some point unless the United States 10-Year TIP is permanently fixed at -86 bps.
Maybe that is the Fed’s plan, but otherwise, I can’t see how the TIP doesn’t rise back to 0% at some point. The 10-year nominal rate has much further to go, in my opinion.
The 10-year has broken out of its bull flag, and this time I think it will get to 1.95%, and I think it will happen sooner than later.
Lemonade
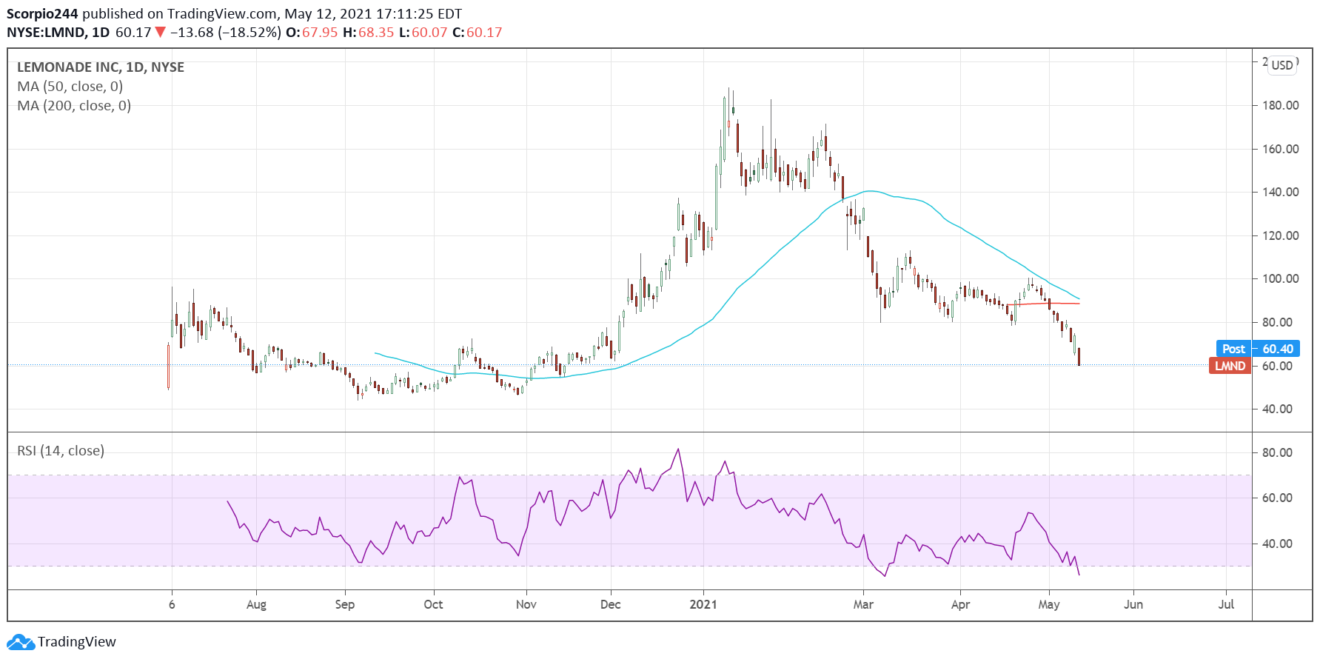
Lemonade (NYSE:LMND)—not a good day. There is nothing to say. The assumptions that were priced into this stock were not reasonable. I don’t know where it will go from here, but it will be coming off my screen; it is over in my book. See: The Lemonade Squeeze Grows More Insane
Square
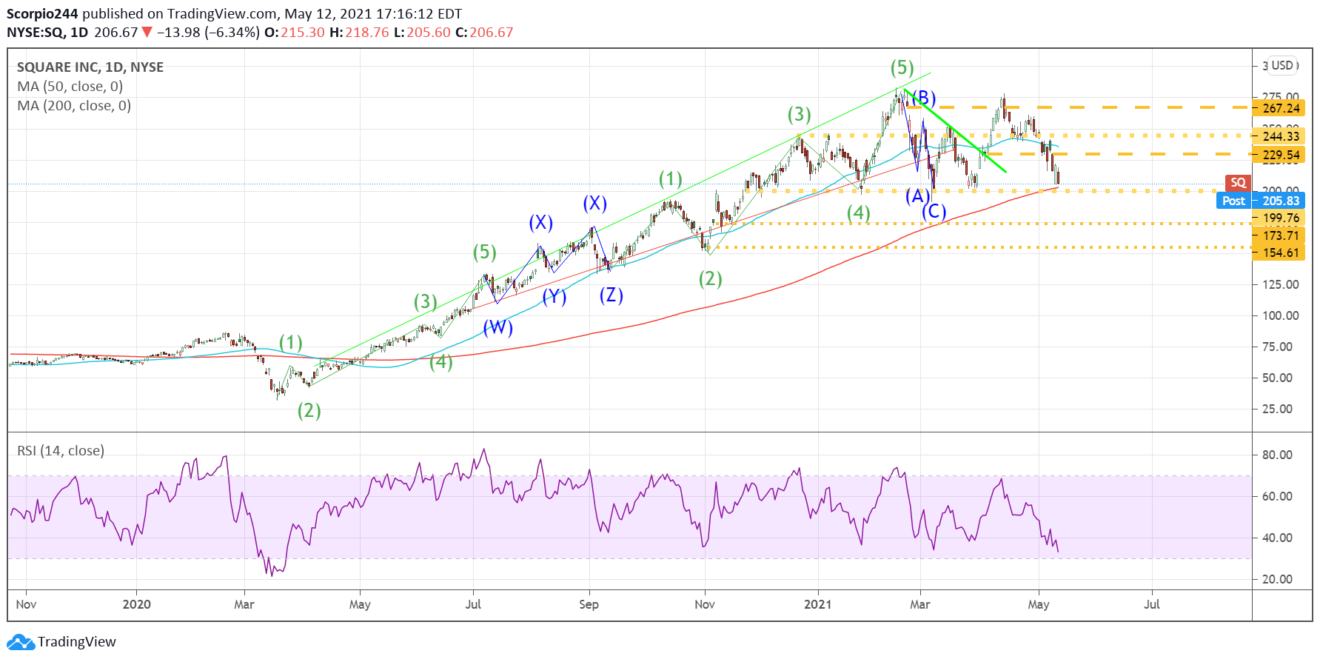
The moment of truth has arrived for Square (NYSE:SQ) too. It is a cool company that makes it easy to transact, sure. Is it the way people are going to “bank” in the future or replaces VISA and Mastercard? Probably not… I know –I don’t understand, sure.
Anyway, the stock sits on support at $200, which is also its 200-day moving average. If that breaks, the stock will likely be on its way to $175 and probably much lower.
Micron
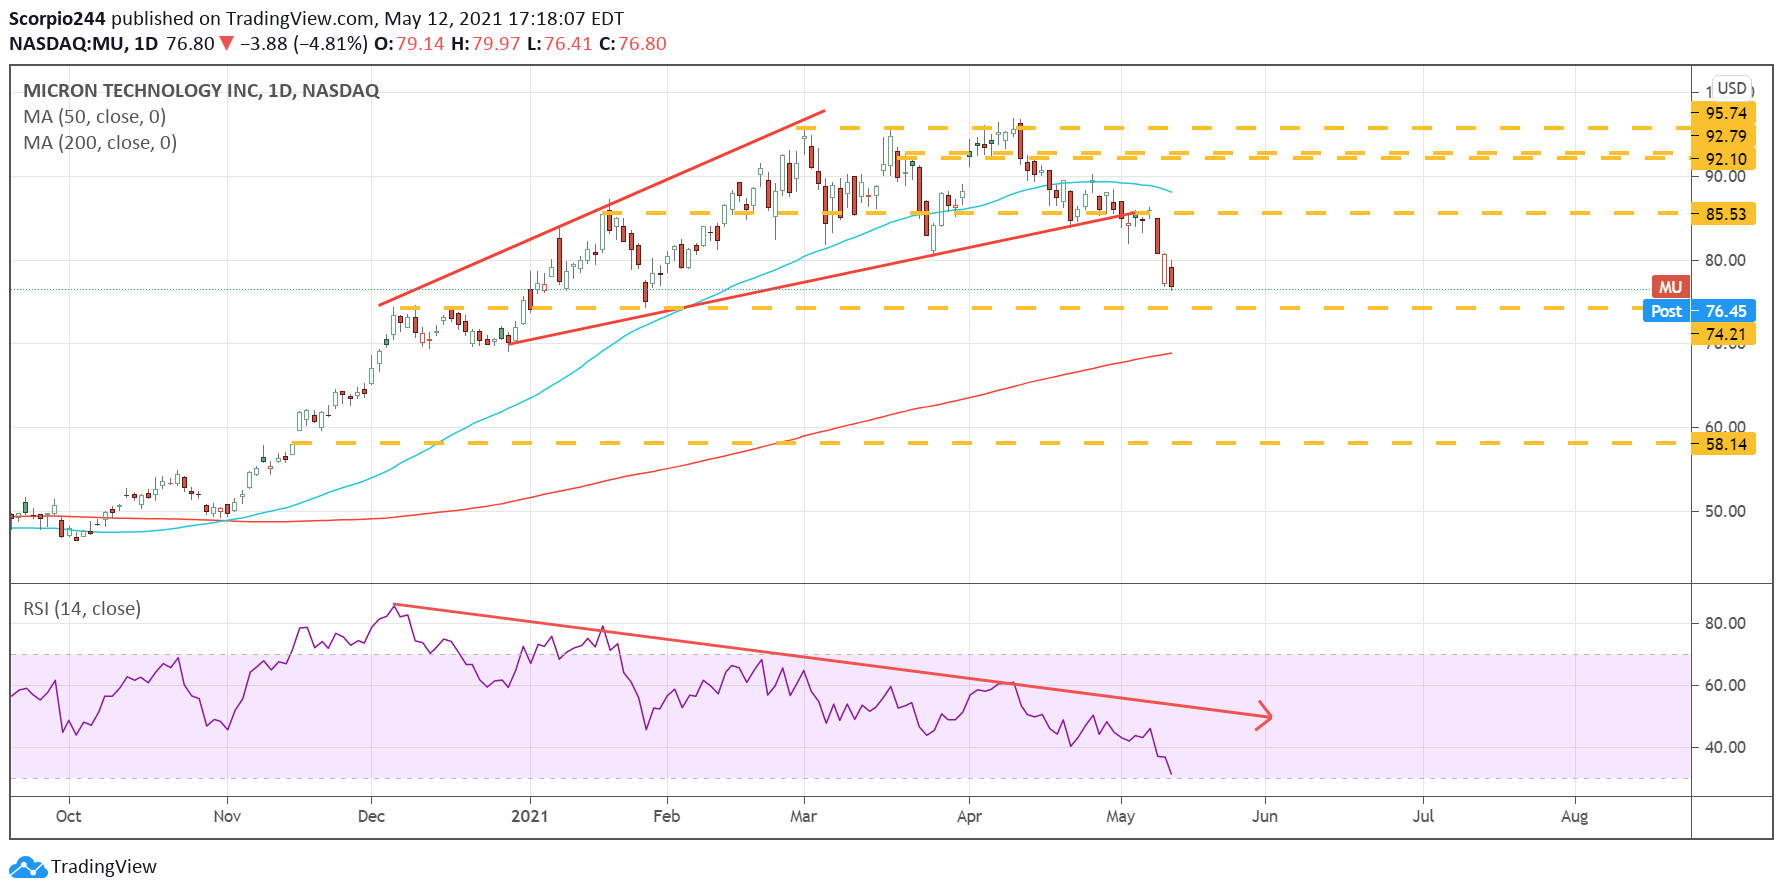
Anyway, Micron Technology (NASDAQ:MU) fell again yesterday, around $76.50. Close enough in my book to the $74.50 we have been talking about.
Qualcomm
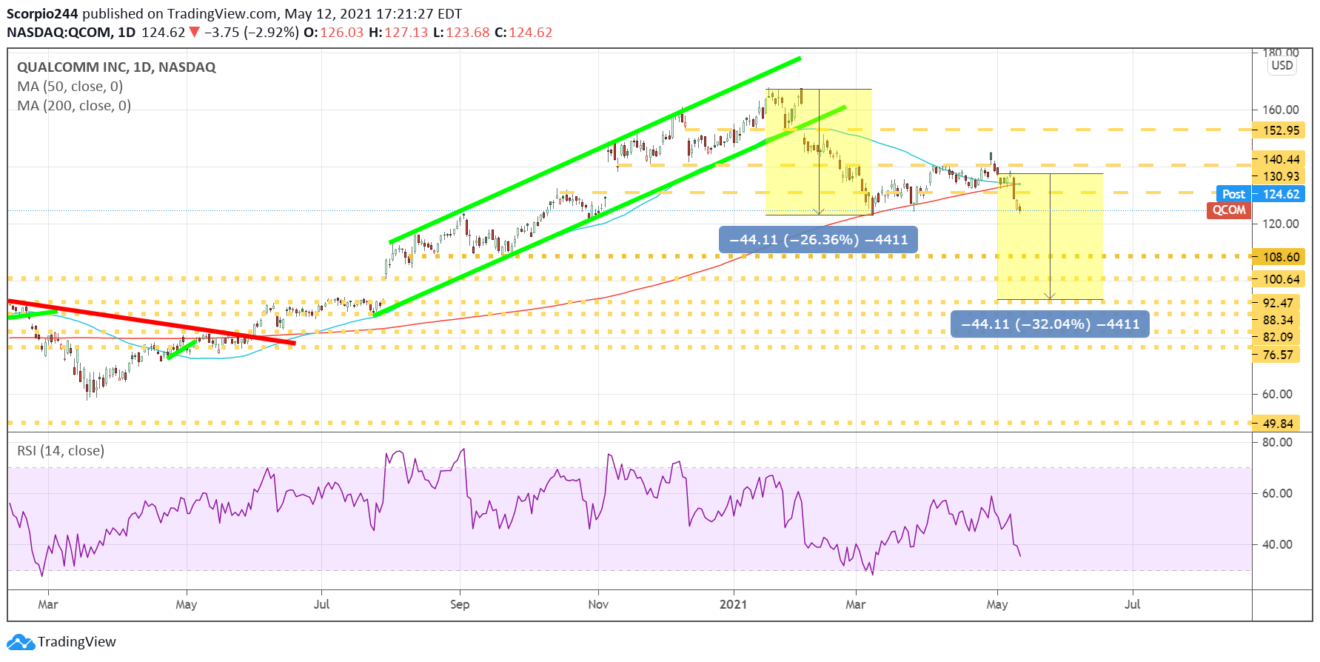
Well, it will be interesting to see if Qualcomm (NASDAQ:QCOM) finally closes that gap at $92. There is certainly a path for it to get there.
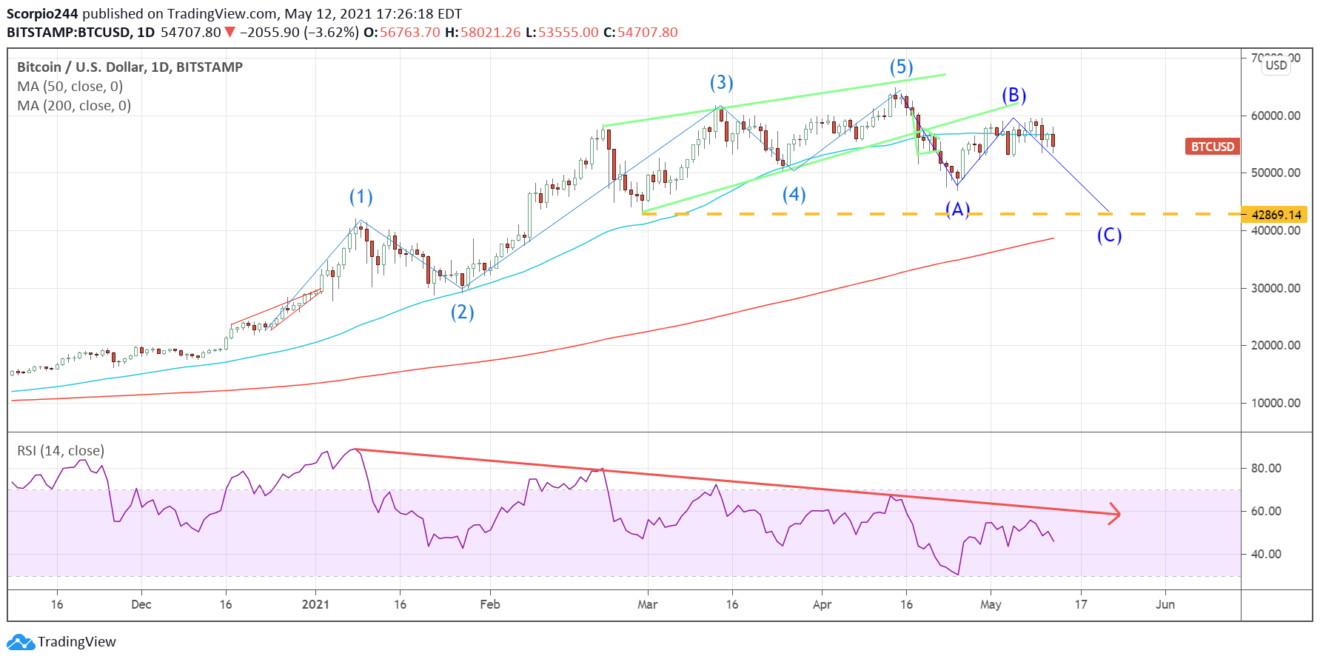
Finally, I still think Bitcoin will be heading to 43,000, maybe lower; I’m not sure yet. I will let you know.

