Stocks Drop As 2019 Winds Down, Yields And Commodities Rise

Published 12/30/2019, 11:19 PM
Updated 11/16/2024, 07:53 AM
XAU/USD
-
US500
-
SPY
-
AMZN
-
DX
-
GC
-
GLD
-
TSLA
-
DE10YT=RR
-
US10YT=X
-
BABA
-
SNAP
-
ROKU
-
SPX Daily Chart

S&P 500

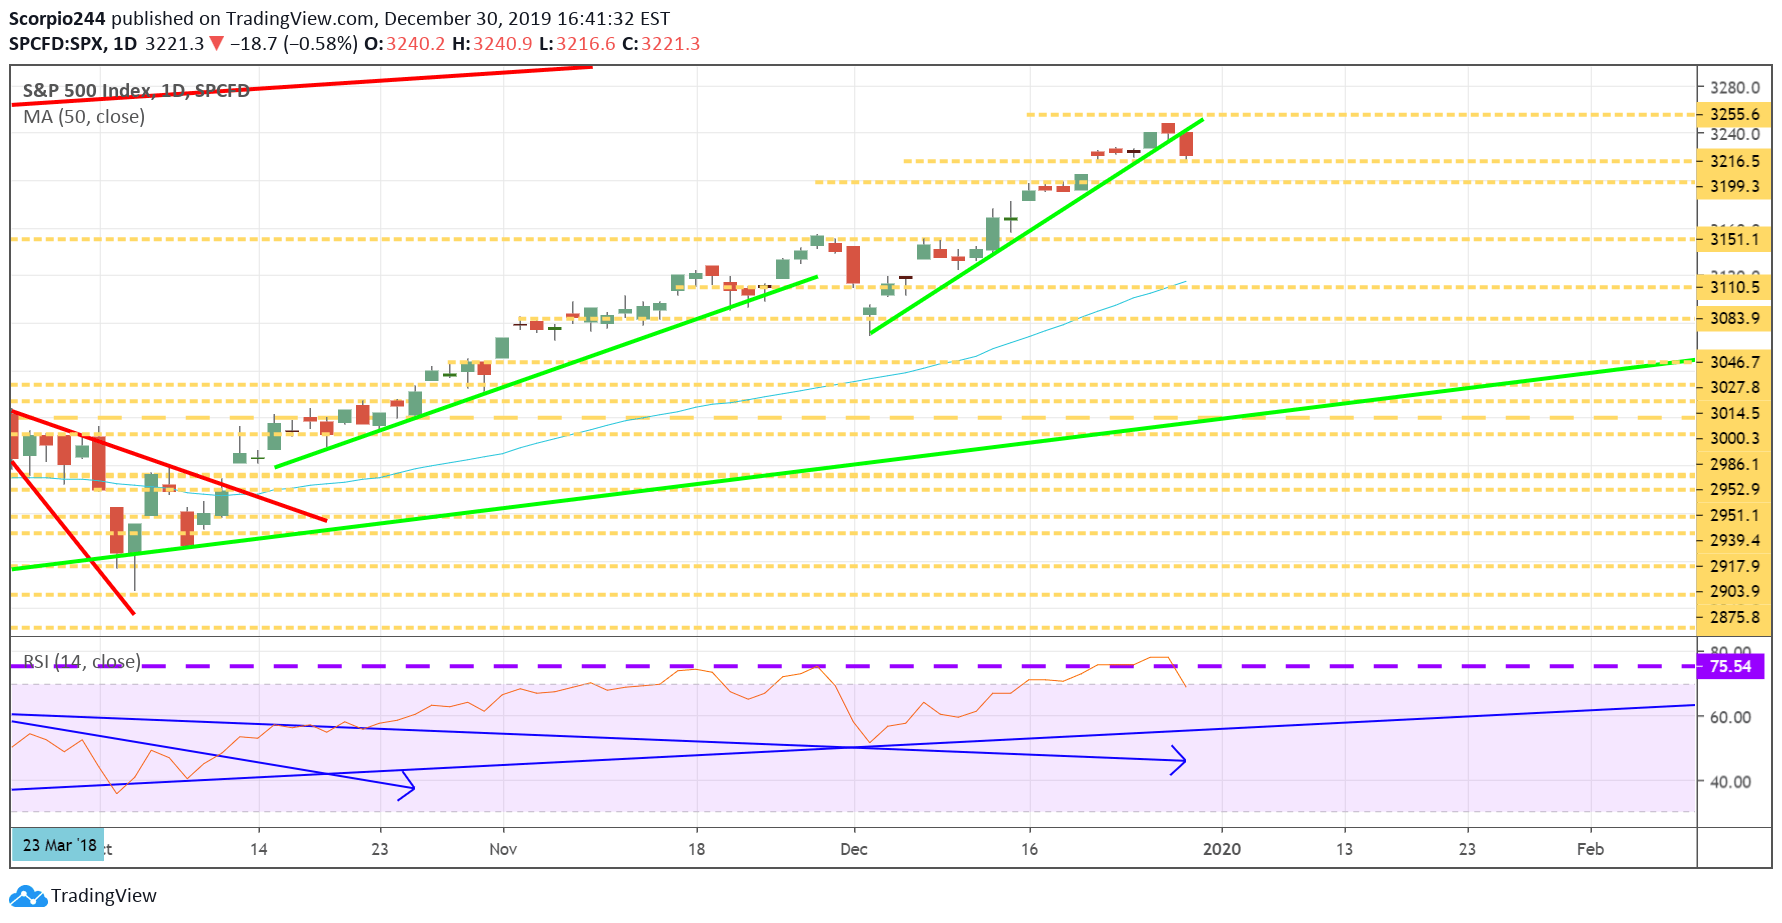
Stocks fell yesterday with the S&P 500 (SPDR S&P 500 ETF (NYSE:SPY)) dropping by roughly 55 bps to close at 3,222. The index did make it as low as 3,216, and it also managed to break the uptrend that has been working since December 3. Also, the RSI for the index managed to fall to 68.5 from 78.5. I’d take the RSI falling back to 56, that would please me. It would likely take the S&P 500 back to 3,180 to 3,200 range, and there would be nothing wrong should that happen.

German 10-Year
German Govt Bonds Daily Chart

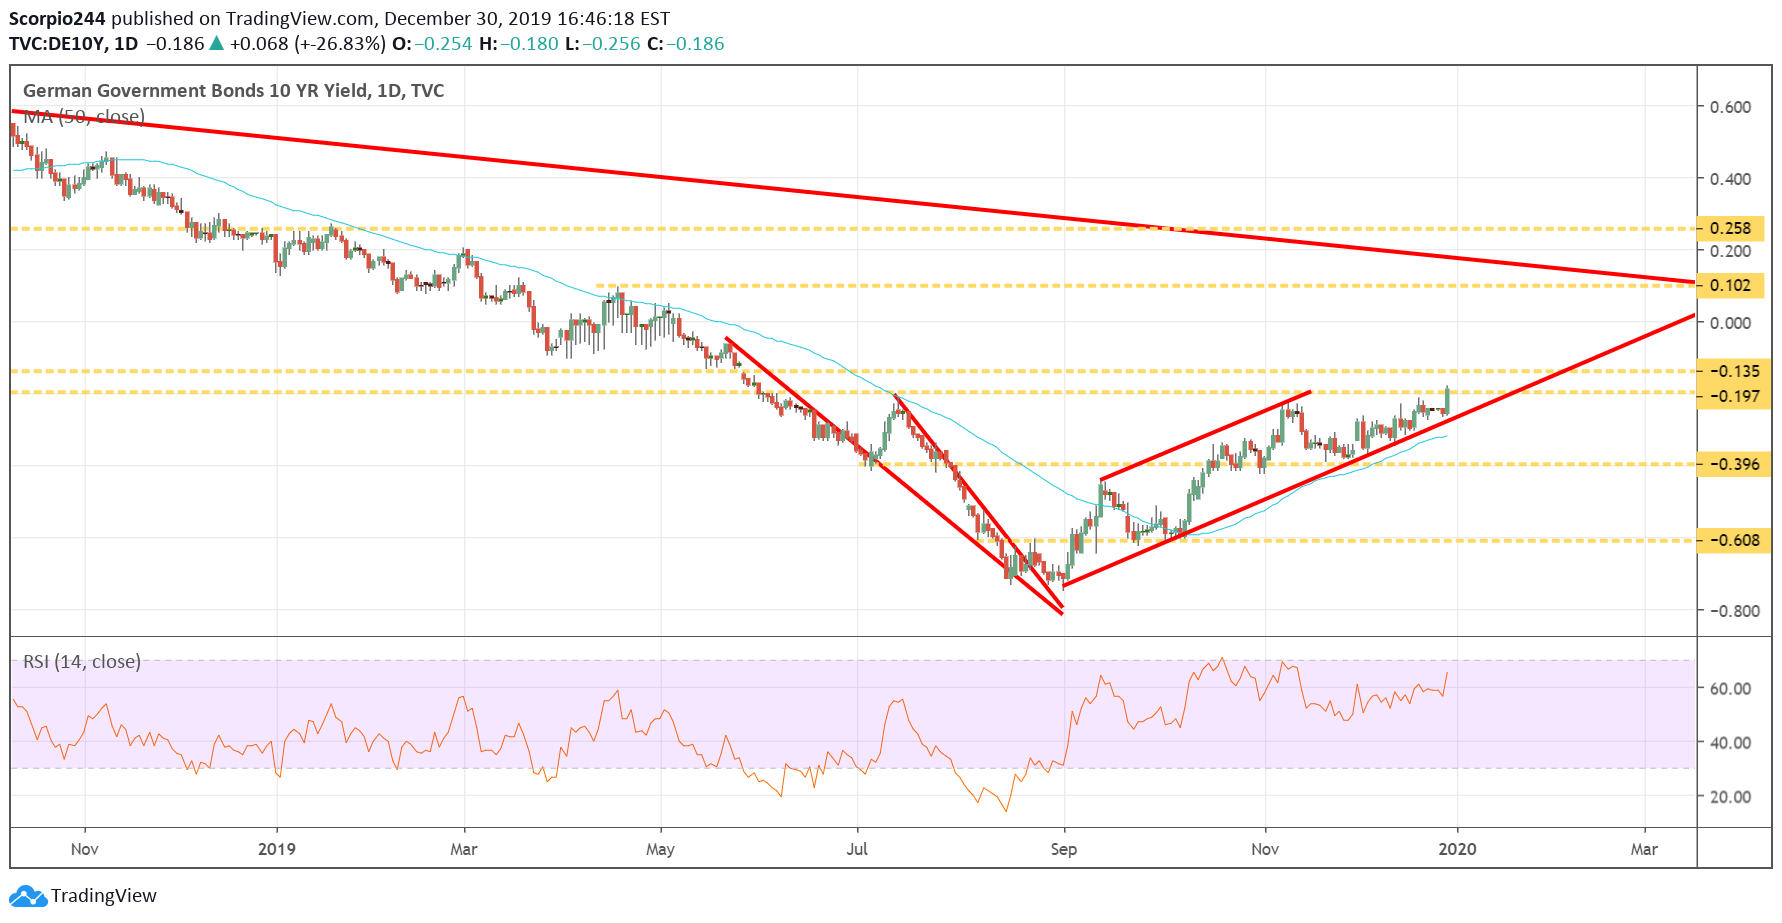
The German 10-year bund did something it has notdone since June, that was close at negative 18 bps. It is a big breakout for the interest rate, and suggests a further increase to negative 13 bps.
US10Y-DE10Y Daily Chart

Spreads

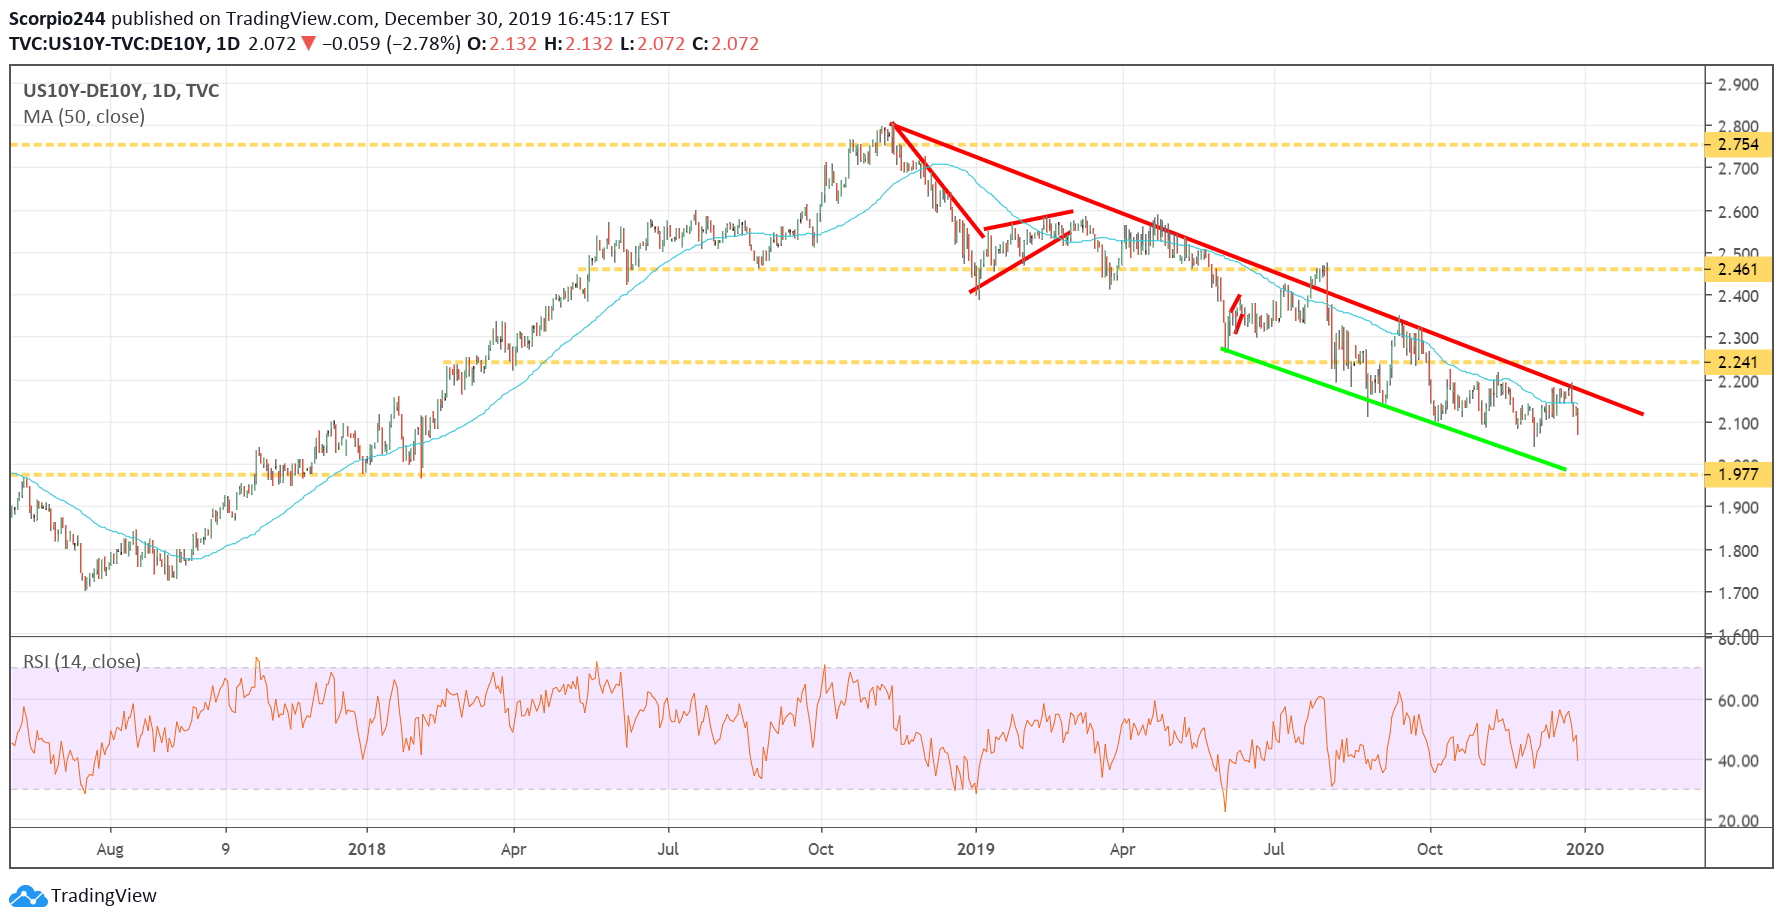
It doesn’t sound like much, but this is one reason why the dollar is weakening. The spreads between U.S. and German bonds have contracted considerably in 2019, which is one explanation for why the dollar likely has even further to fall in the weeks ahead.

Gold
GLD Daily Chart

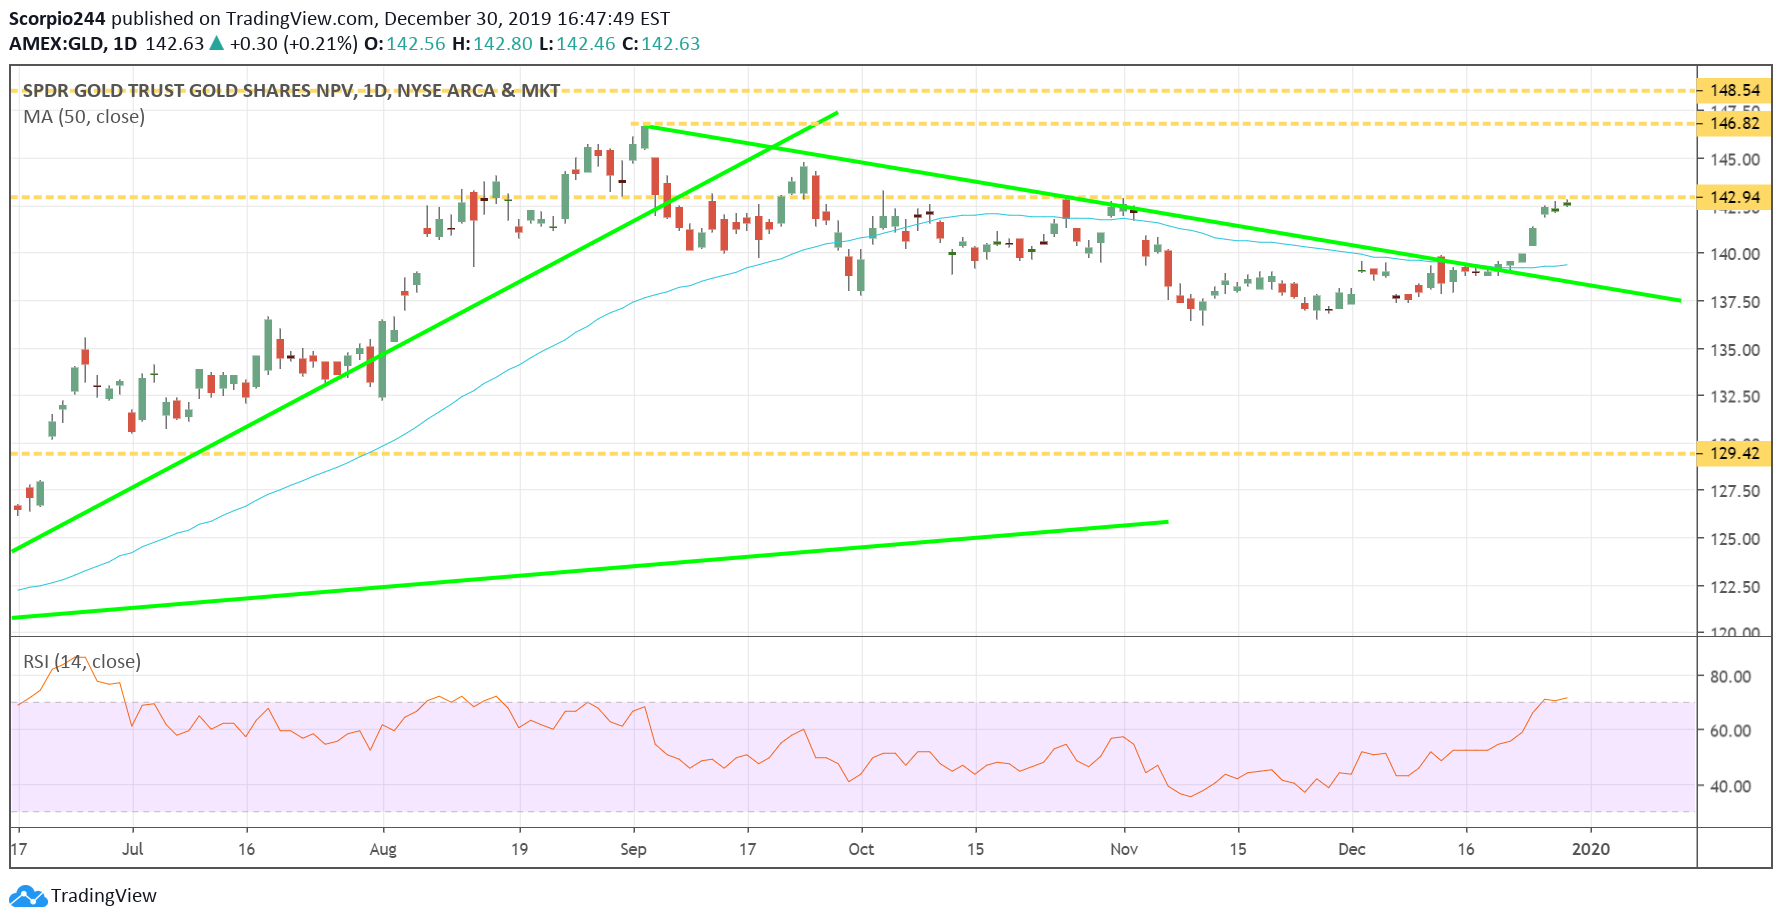
That is one reason why I have been getting bullish on the commodity sectors recently. I have been talking about gold and the SPDR® Gold Shares ETF (NYSE:GLD) since last week in my member areas, and the ETF is now very close to breaking out and pushing to $147. I happen to think it will break out.
Roku Daily Chart

Roku

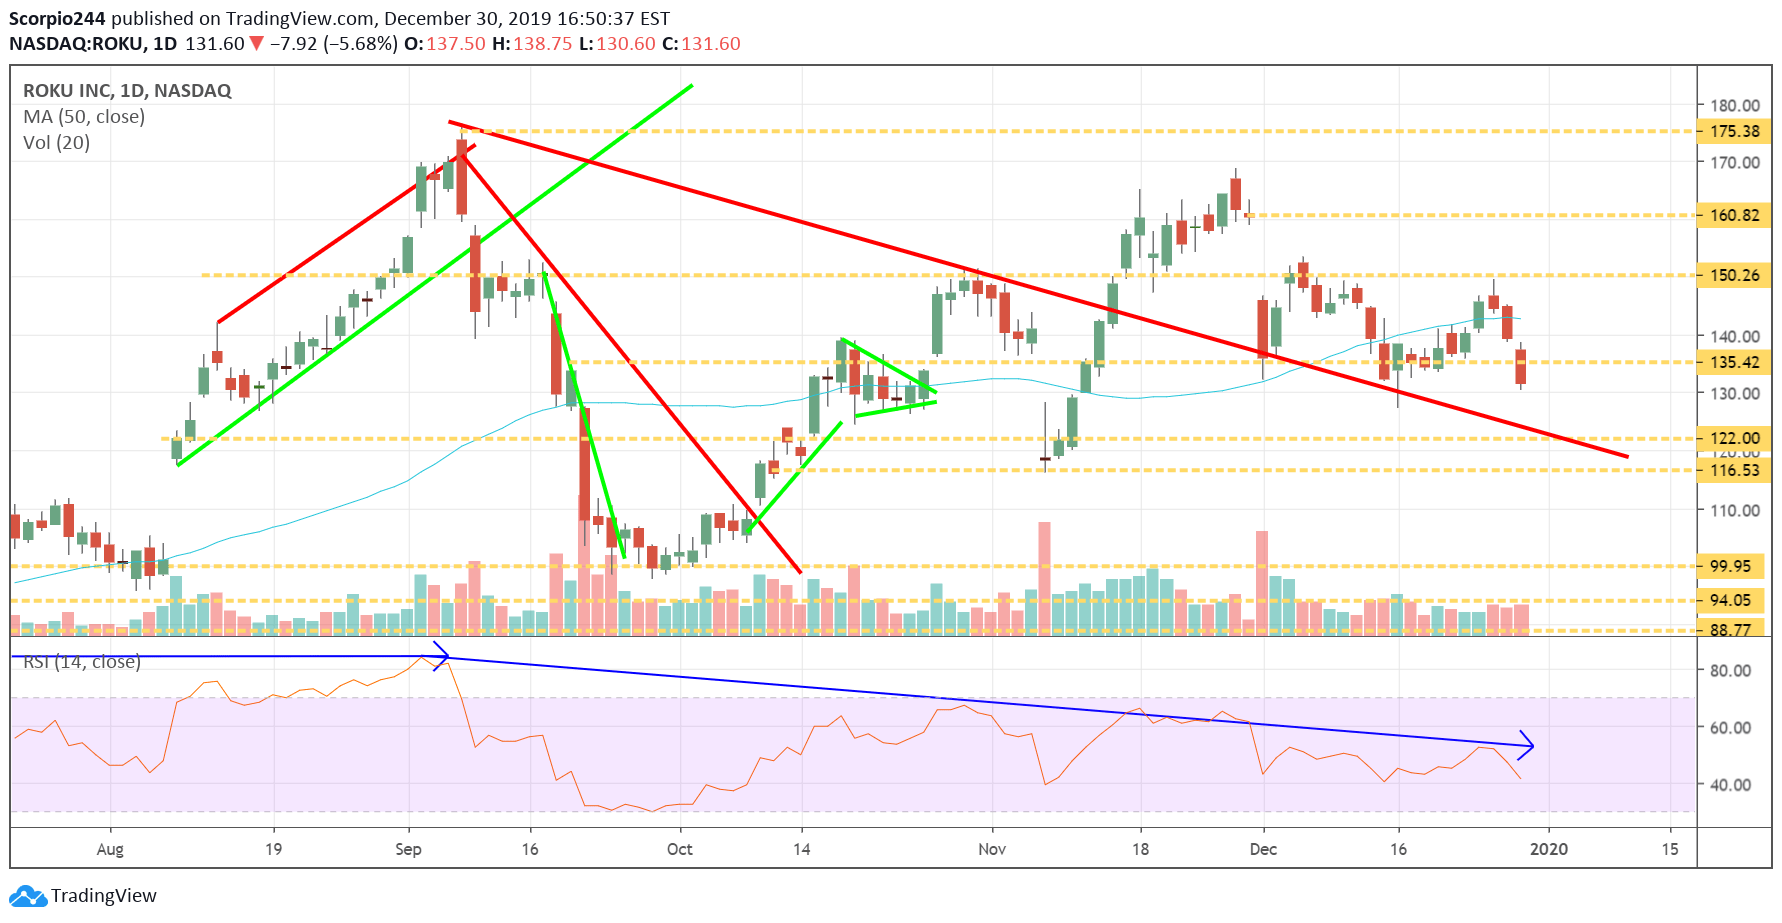
It figures that after I write a positive article on Roku (NASDAQ:ROKU), the stock goes down. Sometimes you can’t win. Perhaps ROKU falls back to $122 now.

Alibaba

Alibaba (NYSE:BABA) fell out of the trading channel yesterday. Now it is testing support at $211. It could result in the stock falling to around $201.
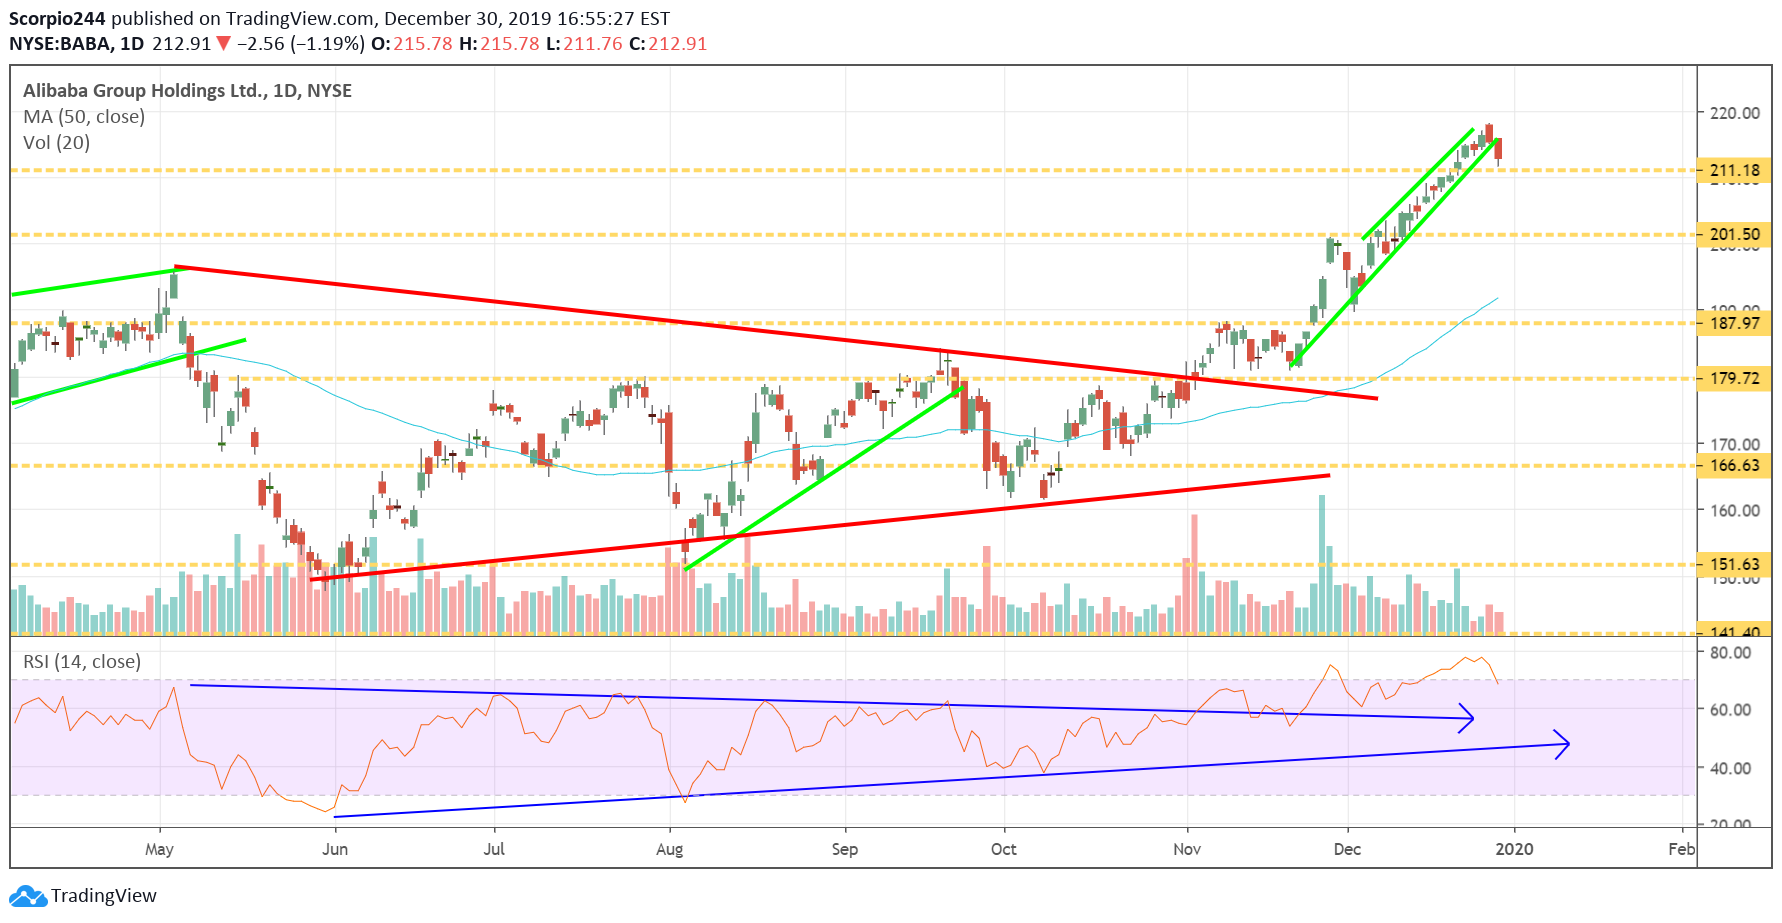
Alibaba Daily Chart
Tesla Inc Daily Chart

Tesla

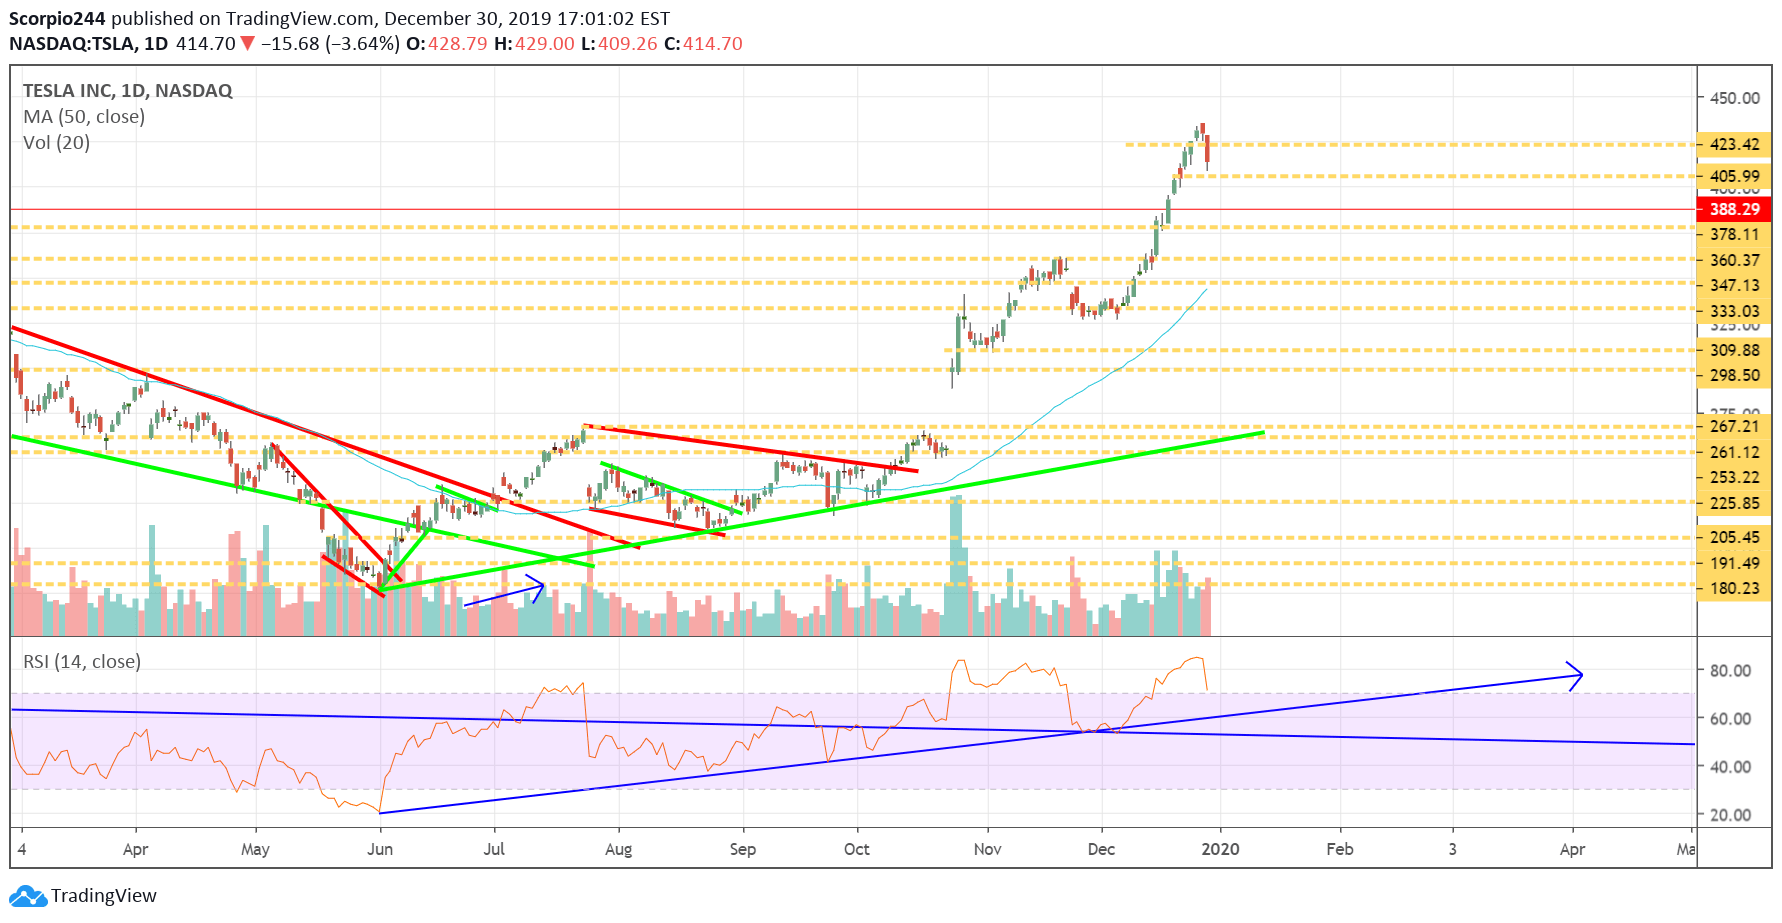
Tesla (NASDAQ:TSLA) also fell yesterday, and it should not be a surprise, the stock can’t go up in a straight line. It is still overbought, and I think it probably falls back to $390 or so to test the breakout.

Amazon

Amazon (NASDAQ:AMZN) probably needs to pull back some more, too, perhaps to $1825.
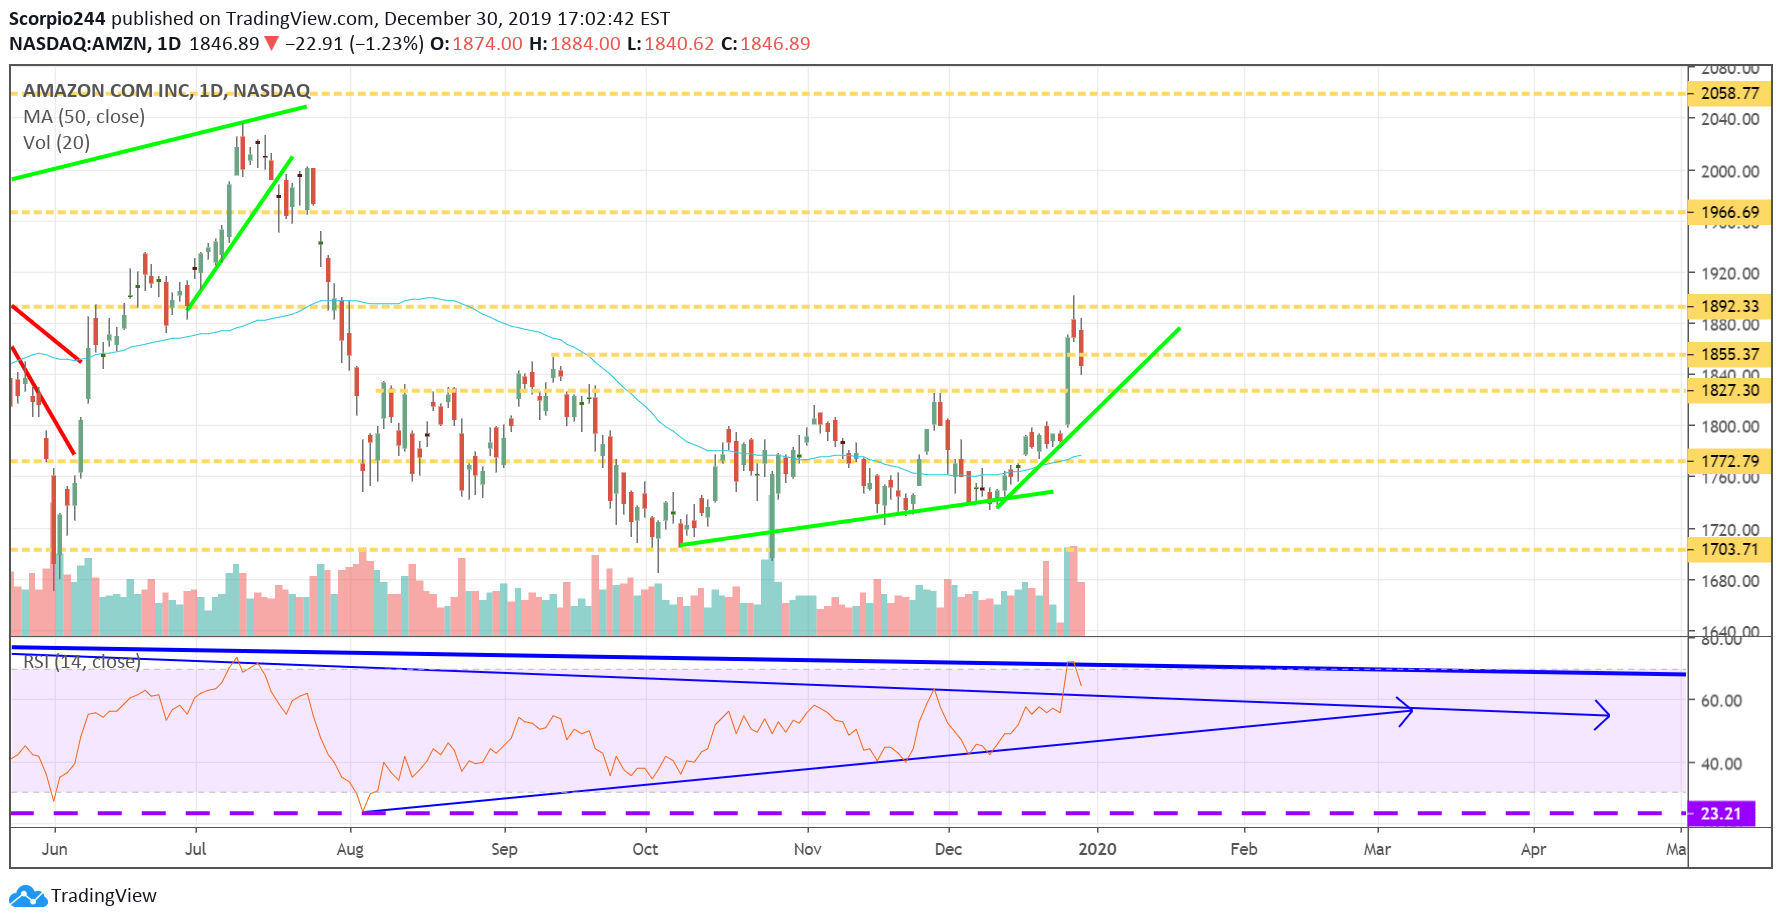
Amazon Daily Chart

Snap

I noted in an article for Forbes, I saw some bullish option betting in Snap (NYSE:SNAP), which could result in a rally to start 2020.
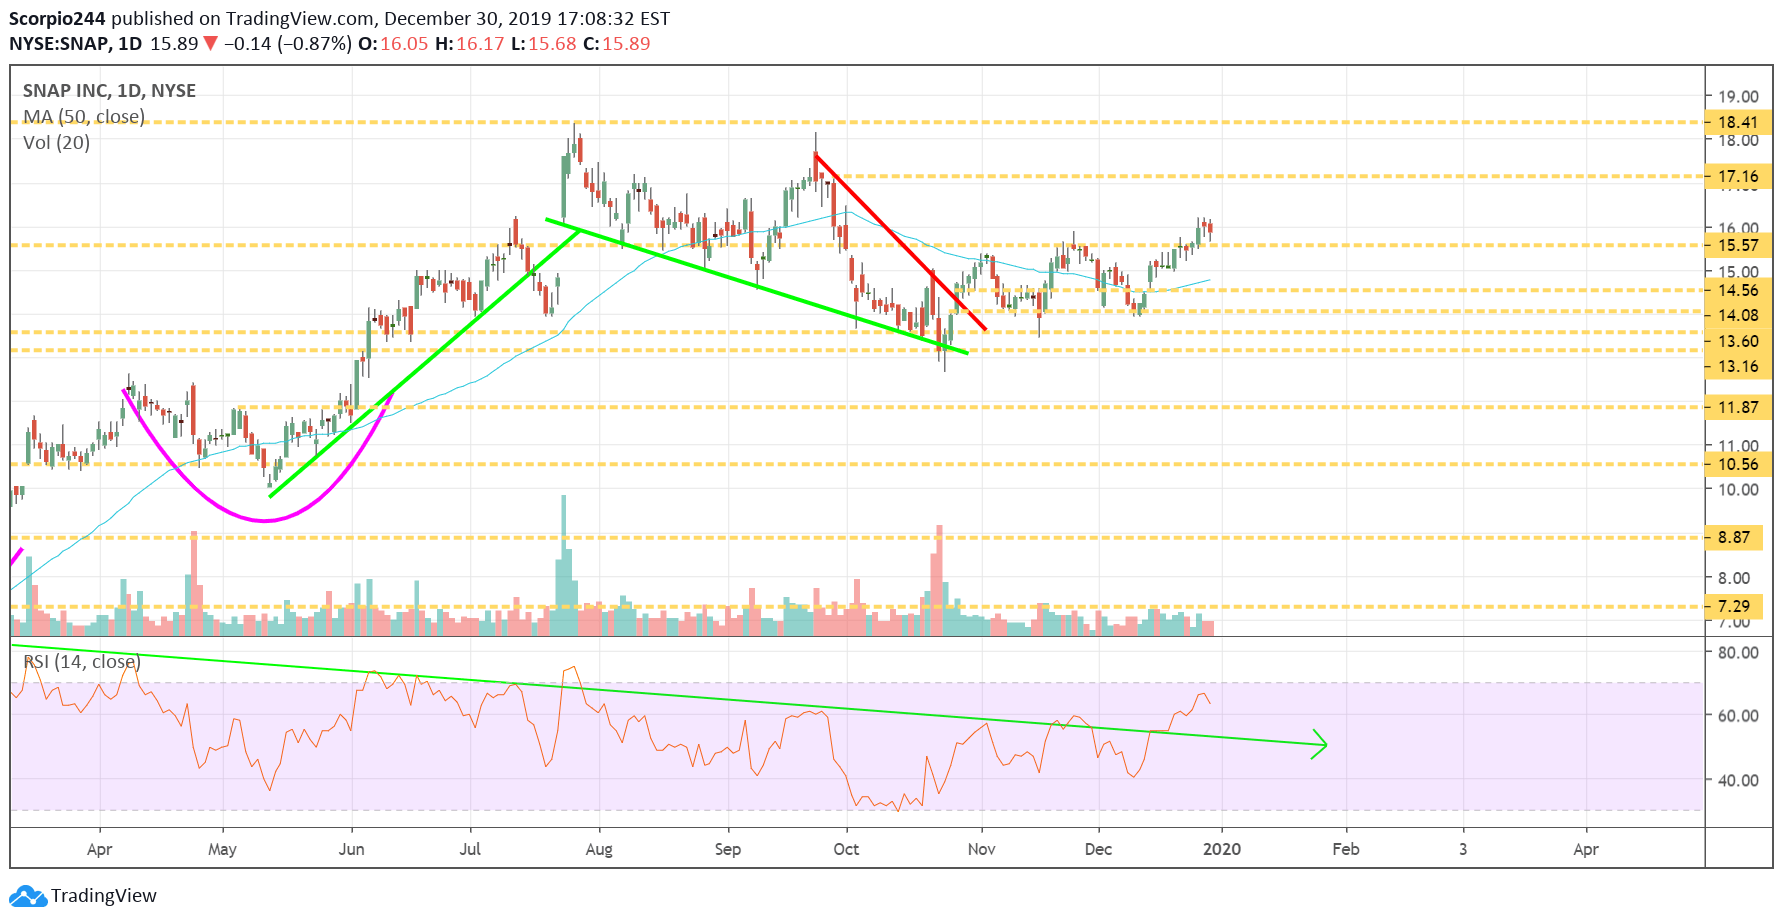
SNAP Daily Chart

Original Post

Latest comments

Loading next article…
Risk Disclosure: Trading in financial instruments and/or cryptocurrencies involves high risks including the risk of losing some, or all, of your investment amount, and may not be suitable for all investors. Prices of cryptocurrencies are extremely volatile and may be affected by external factors such as financial, regulatory or political events. Trading on margin increases the financial risks.
Before deciding to trade in financial instrument or cryptocurrencies you should be fully informed of the risks and costs associated with trading the financial markets, carefully consider your investment objectives, level of experience, and risk appetite, and seek professional advice where needed.
Fusion Media would like to remind you that the data contained in this website is not necessarily real-time nor accurate. The data and prices on the website are not necessarily provided by any market or exchange, but may be provided by market makers, and so prices may not be accurate and may differ from the actual price at any given market, meaning prices are indicative and not appropriate for trading purposes. Fusion Media and any provider of the data contained in this website will not accept liability for any loss or damage as a result of your trading, or your reliance on the information contained within this website.
It is prohibited to use, store, reproduce, display, modify, transmit or distribute the data contained in this website without the explicit prior written permission of Fusion Media and/or the data provider. All intellectual property rights are reserved by the providers and/or the exchange providing the data contained in this website.
Fusion Media may be compensated by the advertisers that appear on the website, based on your interaction with the advertisements or advertisers.
© 2007-2025 - Fusion Media Limited. All Rights Reserved.