We are now about halfway through earnings season with 42% of companies within the S&P 500 having reported results. According to data from Dow Jones S&P, 71.3% of companies have beaten their estimates, while 23.6% have missed, and 5.1% have met. It sounds like an extremely bullish report, but those results are much worse than the previous two quarters. In the second quarter of 2018, 80% of companies beat estimates and just 14.8% missed.
However, when we dig a bit deeper into those numbers, we find that historically going back to 2012, the range of 70 to 75% of companies beating estimates is within the higher end of the norm. Last years high numbers of beats may have been because of the new tax law changes, and now that those changes are normalizing the number of beats and misses are returning to their historical trends.

(Data from Dow Jones S&P)
Earnings Estimates Fall
Earnings estimates for 2019 continue to decline. Currently, forecasts are calling for growth of roughly 7.8% earnings growth in 2019 to $167.64 per share. That is about 5.3% off the August highs of $177.07. Estimates for 2020 have also fallen to around 190.79, and suggest growth of 13.8% in 2020.

(Data from Dow Jones S&P)
Valuations Rise
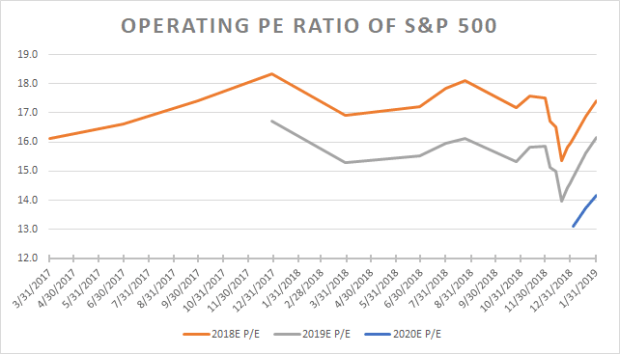
With the S&P 500 rising sharply off the lows and estimates falling, the PE ratio of the S&P 500 has increased to 16.1 times 2019 earnings estimates, and 14.2 times 2020 estimates.
Throughout much of 2018, the S&P 500 traded at 17.5 times forward earnings. If the market should repeat that trend, the S&P 500 could rise to around 2,930. Additionally, the index traded at roughly 15.5 times one-year forward earnings, should that happen this year it would suggest the S&P 500 rises to 2,957 using 2020 estimates. It does assume that earnings estimates do not continue to fall meaningfully. Both outcomes would suggest there is about 8.5 to 9% more upside in the S&P 500 for it just to get back to a reasonably fair valuation. At this point, the S&P 500 valuation still seems too low.

(Data from Dow Jones S&P)
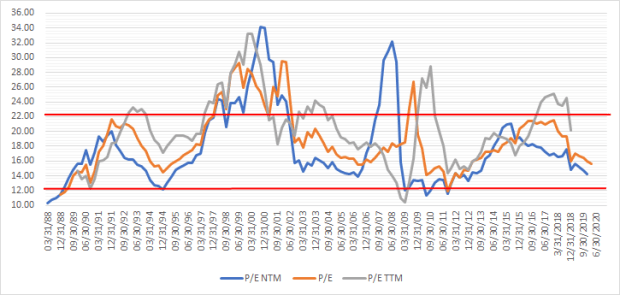
We can also see that still the S&P 500 is trading at the low-end of its historical range when looking at earnings over the next twelve months.

(Data from Dow Jones S&P)
Sell-off Was Too Severe
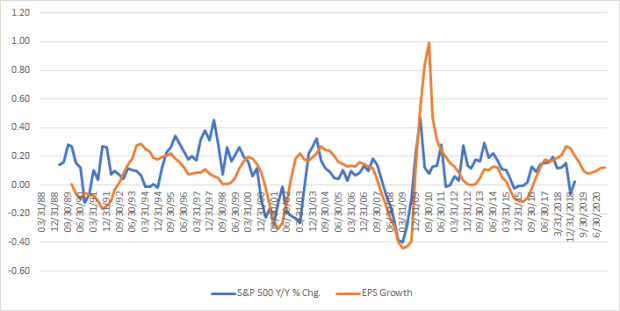
Again we can also see that the decline in stocks over the past few months is much steeper than the earnings slowdown that we have witnessed to this point. The steep decline in the market would be reflective of an earnings recession, which there is no evidence of at this point.

(Data from Dow Jones S&P)
As earnings continue to pour in should the current trends continue it would at least suggest that fears of a recession were completely overblown and entirely out of line. It would also suggest that stocks continue to rise by as much 10% to return to a historically fair valuation. That does not even include if shares were trading above that range, which is possible should the earnings growth outlook for 2020 continue to look strong at 14%.
