⭐ Start off 2025 with a powerful boost to your portfolio: January’s freshest AI-picked stocksUnlock stocks

Stocks Continued To Melt On March 23 With No End In Sight

Published 03/24/2020, 04:06 AM
Updated 11/16/2024, 07:53 AM
US500
-
BAC
-
DIS
-
NKE
-
VIX
-
SMH
-
SQ
-

S&P 500 (SPY)

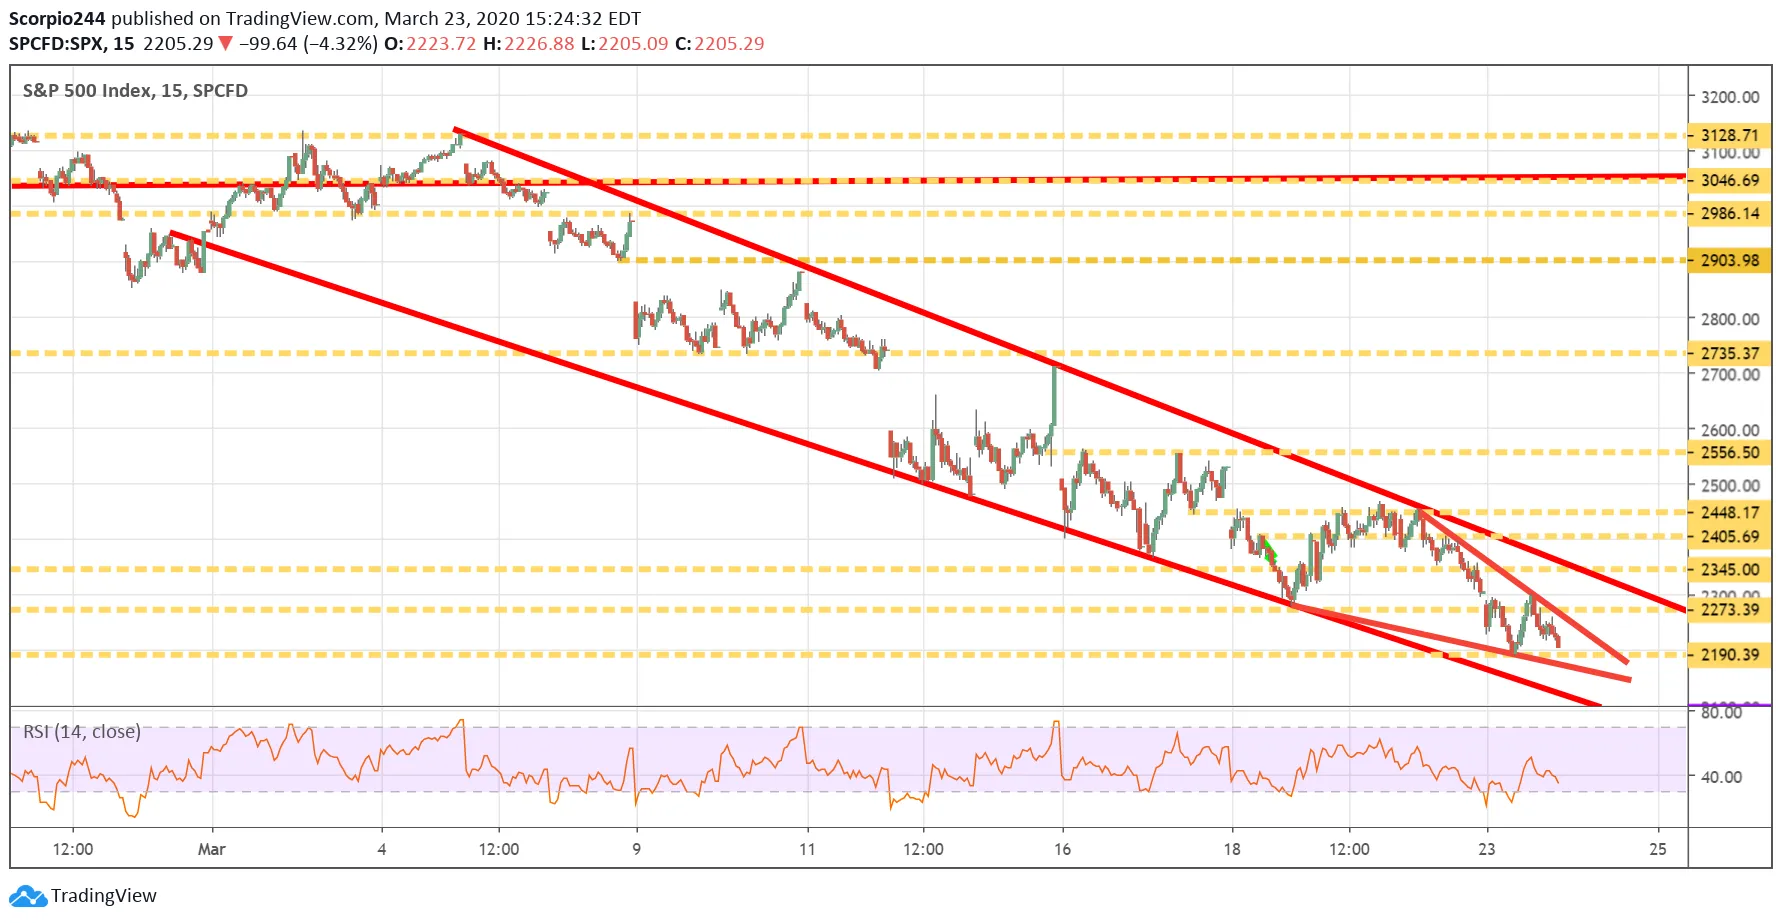
Stocks continue to melt, even after the Fed just launched QE infinity. The S&P 500 fell another 3.0% and is trading around 2,235. It managed to find some support around 2,190 to the start of the day, but that’s about the only positive thing I can point to.

The strangest thing I have seen recently is this dual pattern forming in the S&P 500. The trading channel is a force and one that appears to be very strong. But on top of that, there appears to be another pattern forming within that channel.

It appears that a falling wedge pattern is forming, and that may mean that the index is rising to the upper end of the range of the trading channel around perhaps back to around 2,270. What’s even crazier is it would only take us back to where we were to start the day.
S&P 500 Index

VIX

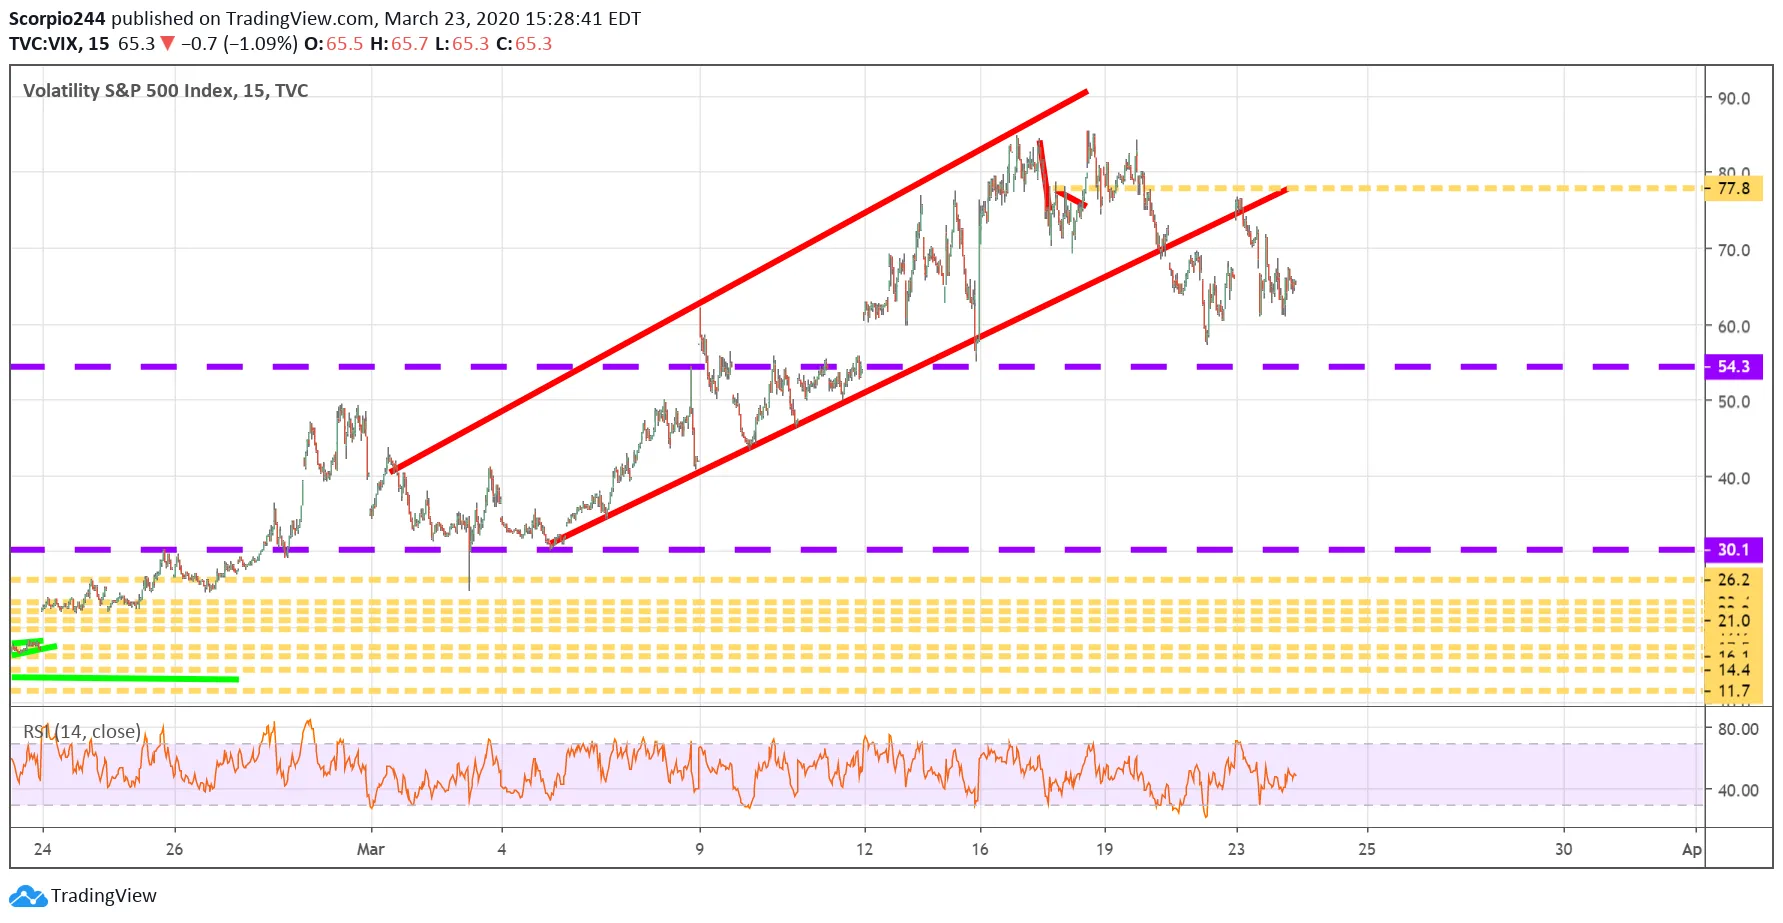
The VIX managed to come down some yesterday, falling to around 65. That is still too high and doesn’t suggest things are getting any better.
VIX Chart

Semis (SMH)

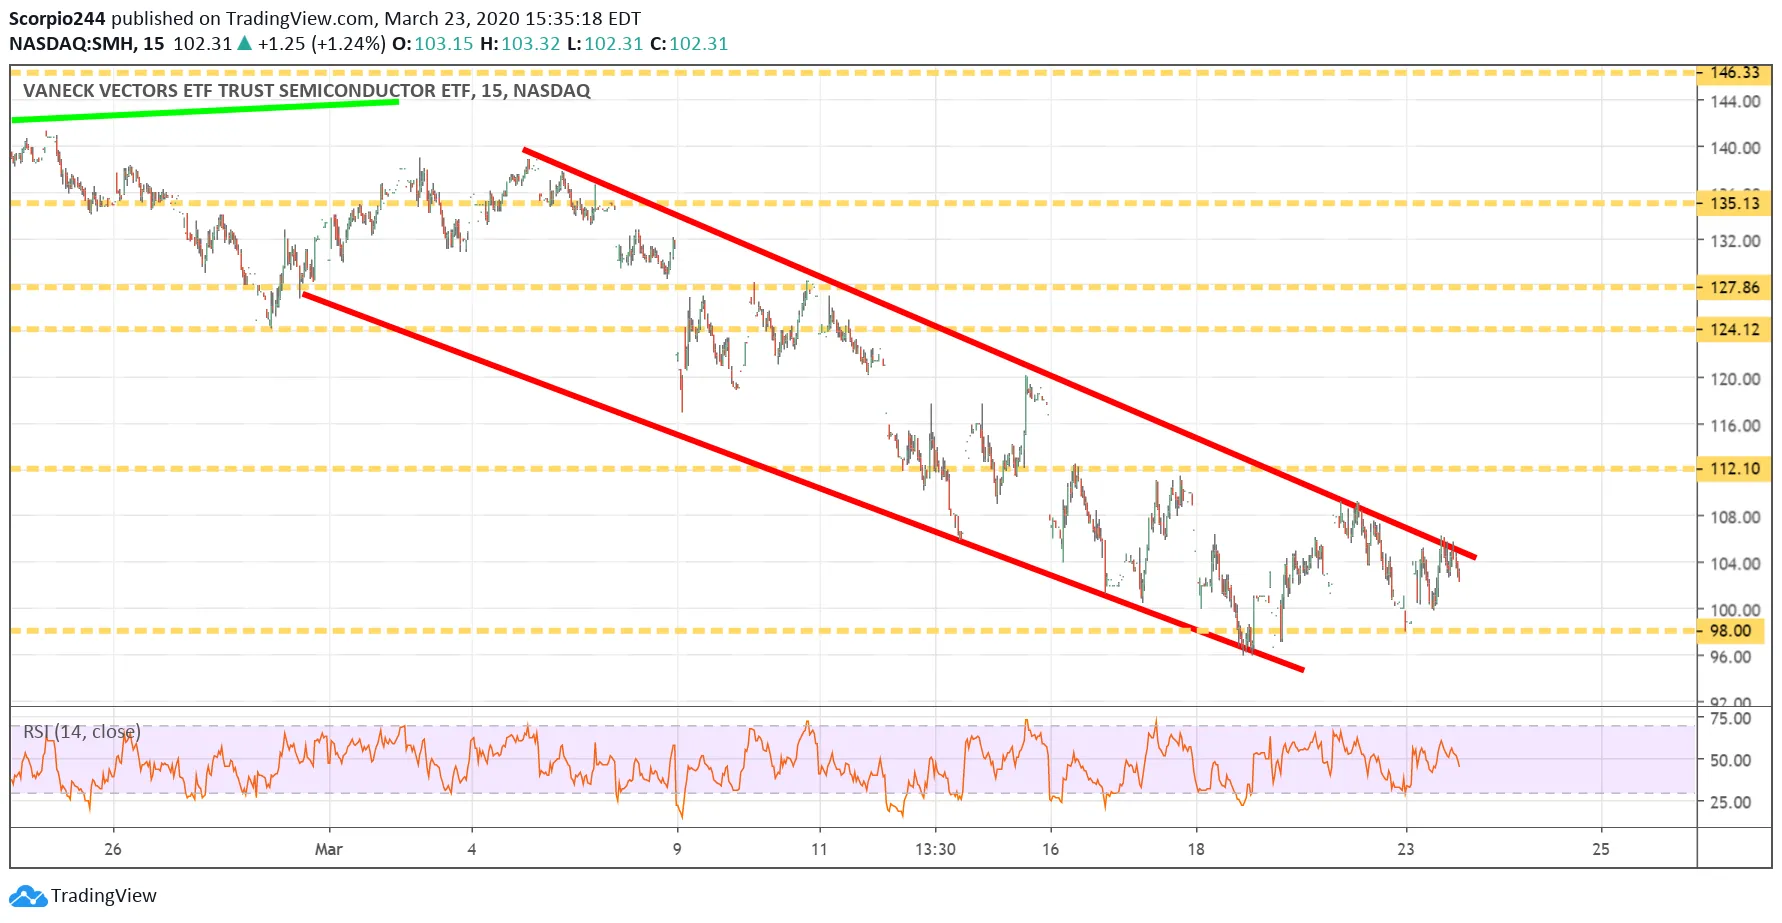
The semis managed to have a pretty decent day, with the SMH rising. But again, like the broader indexes, the downtrend strong for this group as well.
SMH Chart

Nike (NKE)

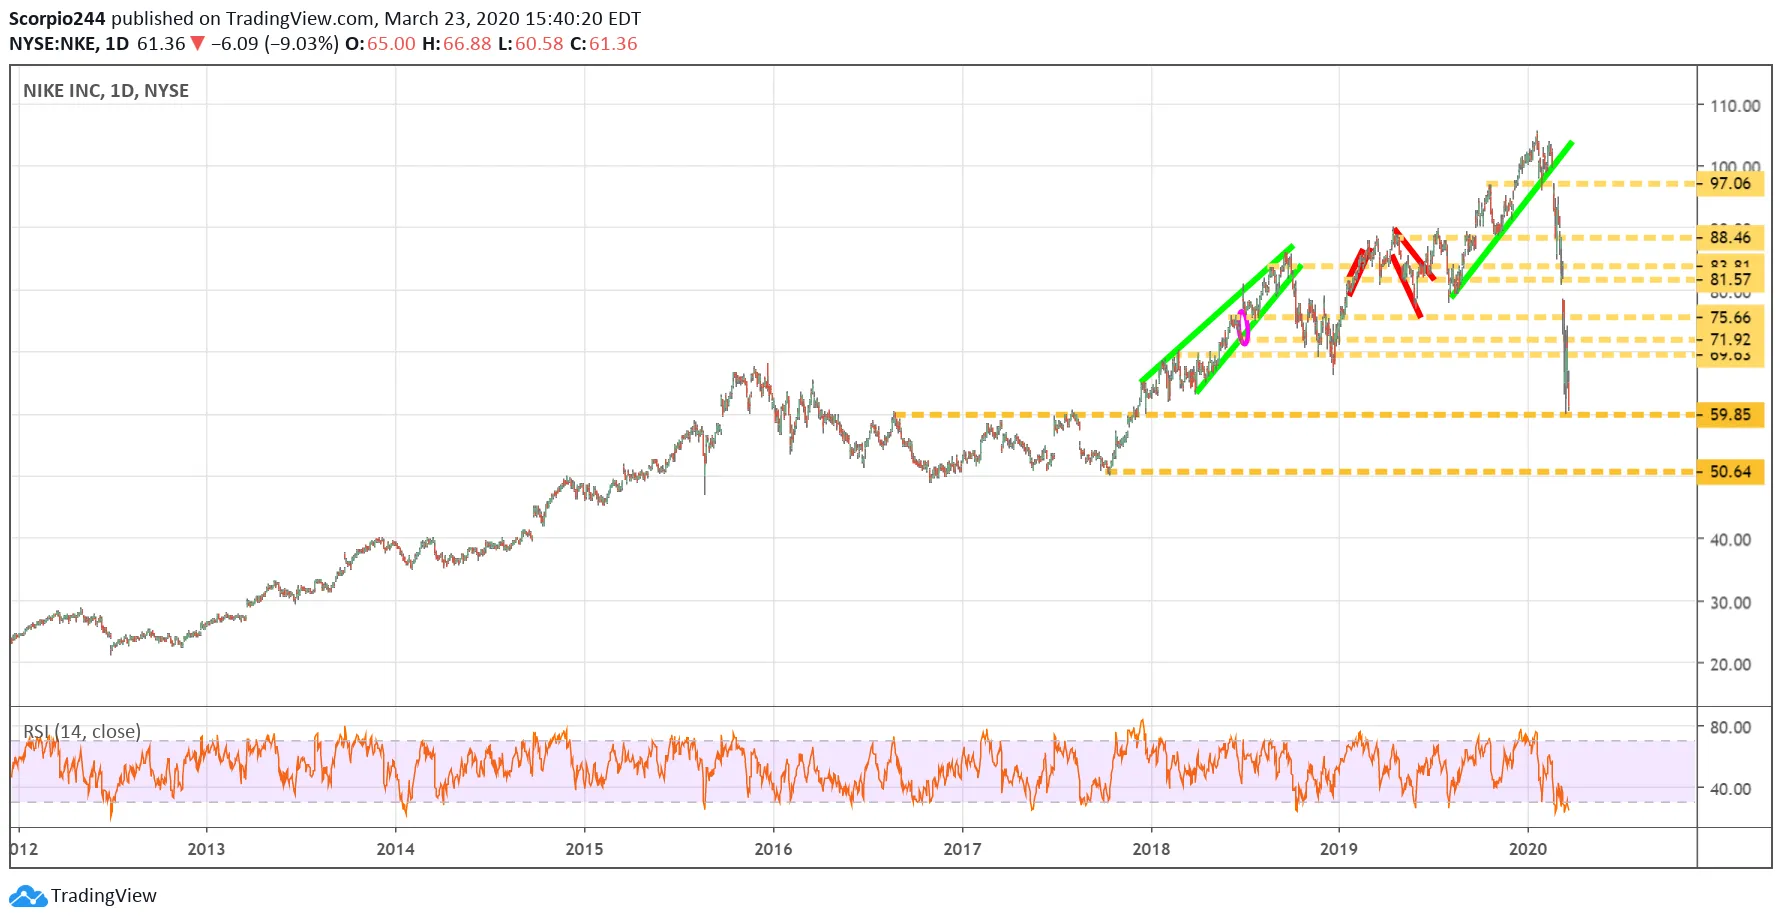
Nike (NYSE:NKE) has dropped to prices not seen since 2017, and likely isn’t finished falling, with the next significant level of support down at $50.60.
NIKE Inc Daily Chart

Square (SQ)

Meanwhile, Square (NYSE:SQ) has been destroyed and can hopefully find some support around $33.50.
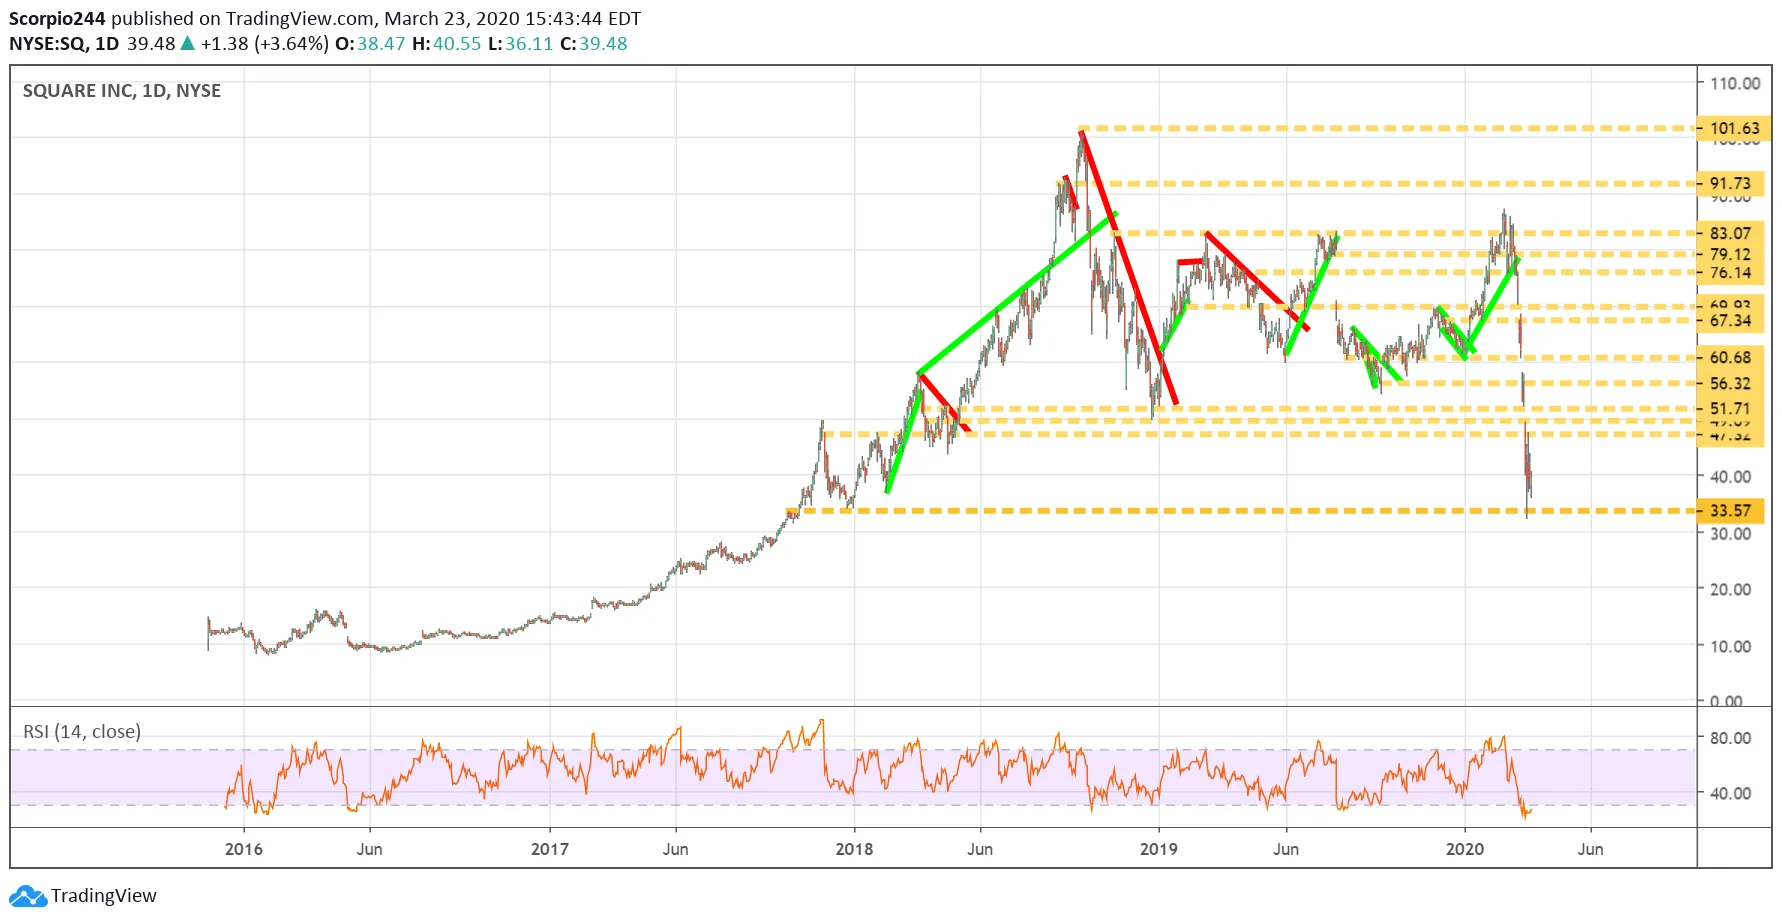
Square Inc Daily Chart

Disney (DIS)

Disney (NYSE:DIS) has also been hurt, and they are going to struggle, given a big portion of their business has been hit the hardest by the virus. The stock so far has stopped at $78 and could be heading lower towards $70.
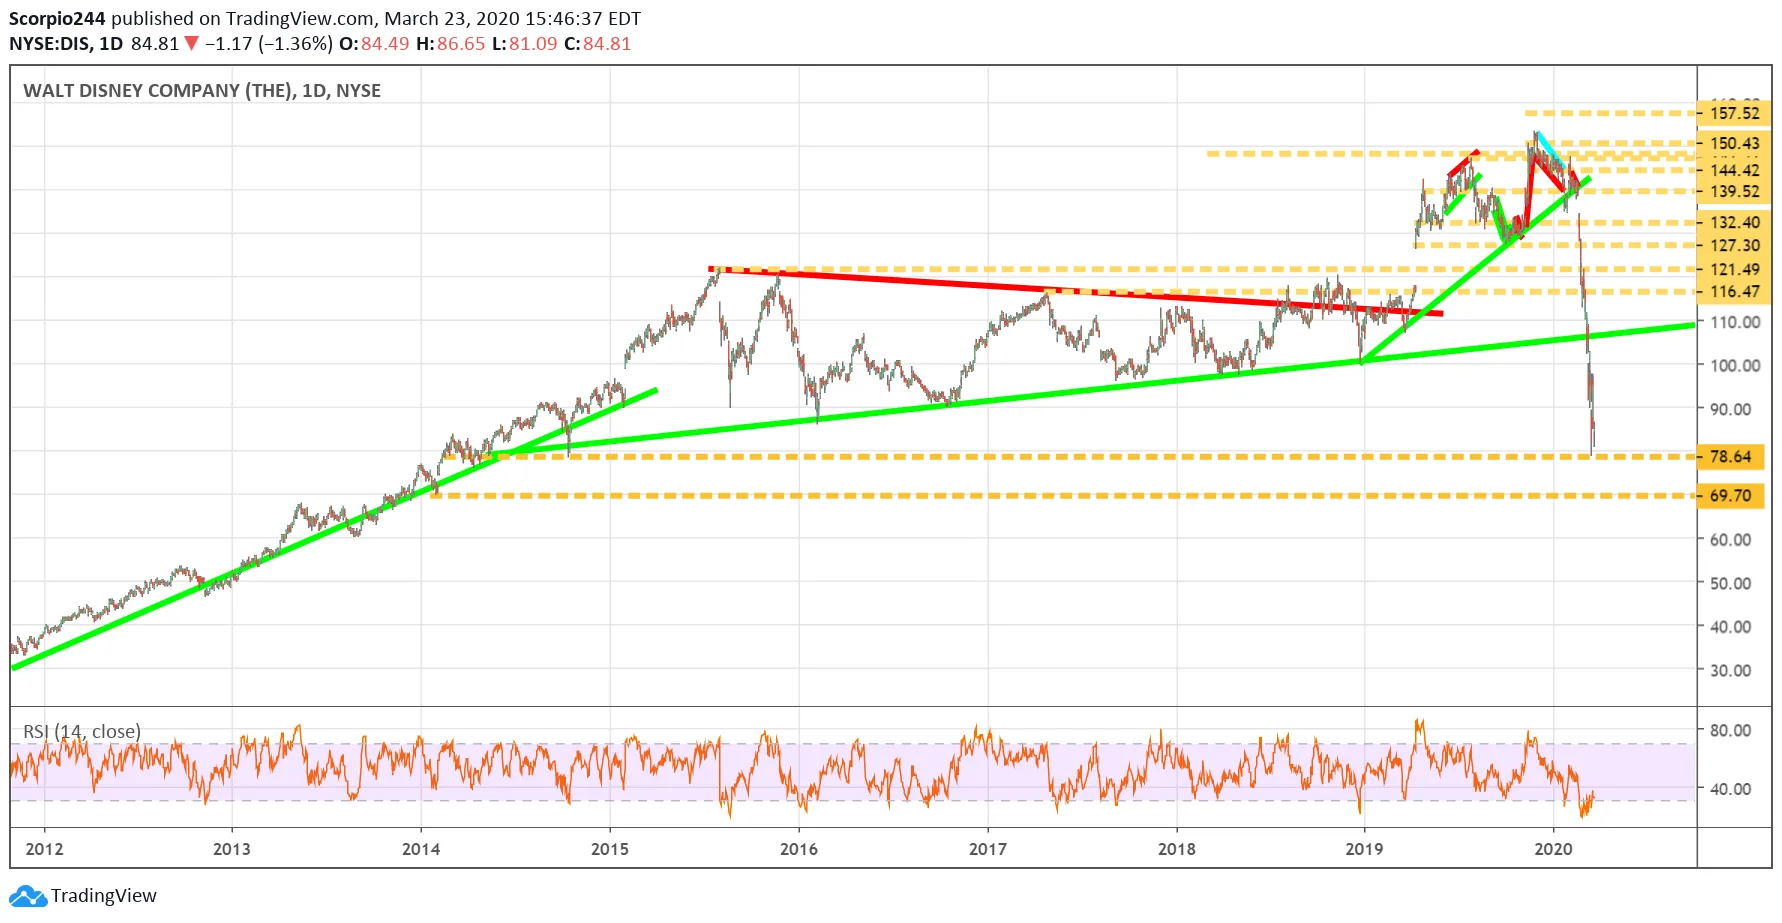
Disney Daily Chart

Bank of America (BAC)

Bank of America (NYSE:BAC) is now falling to support at $18.25, a price it hasn’t been at since the election, closing all gaps takes it $17.
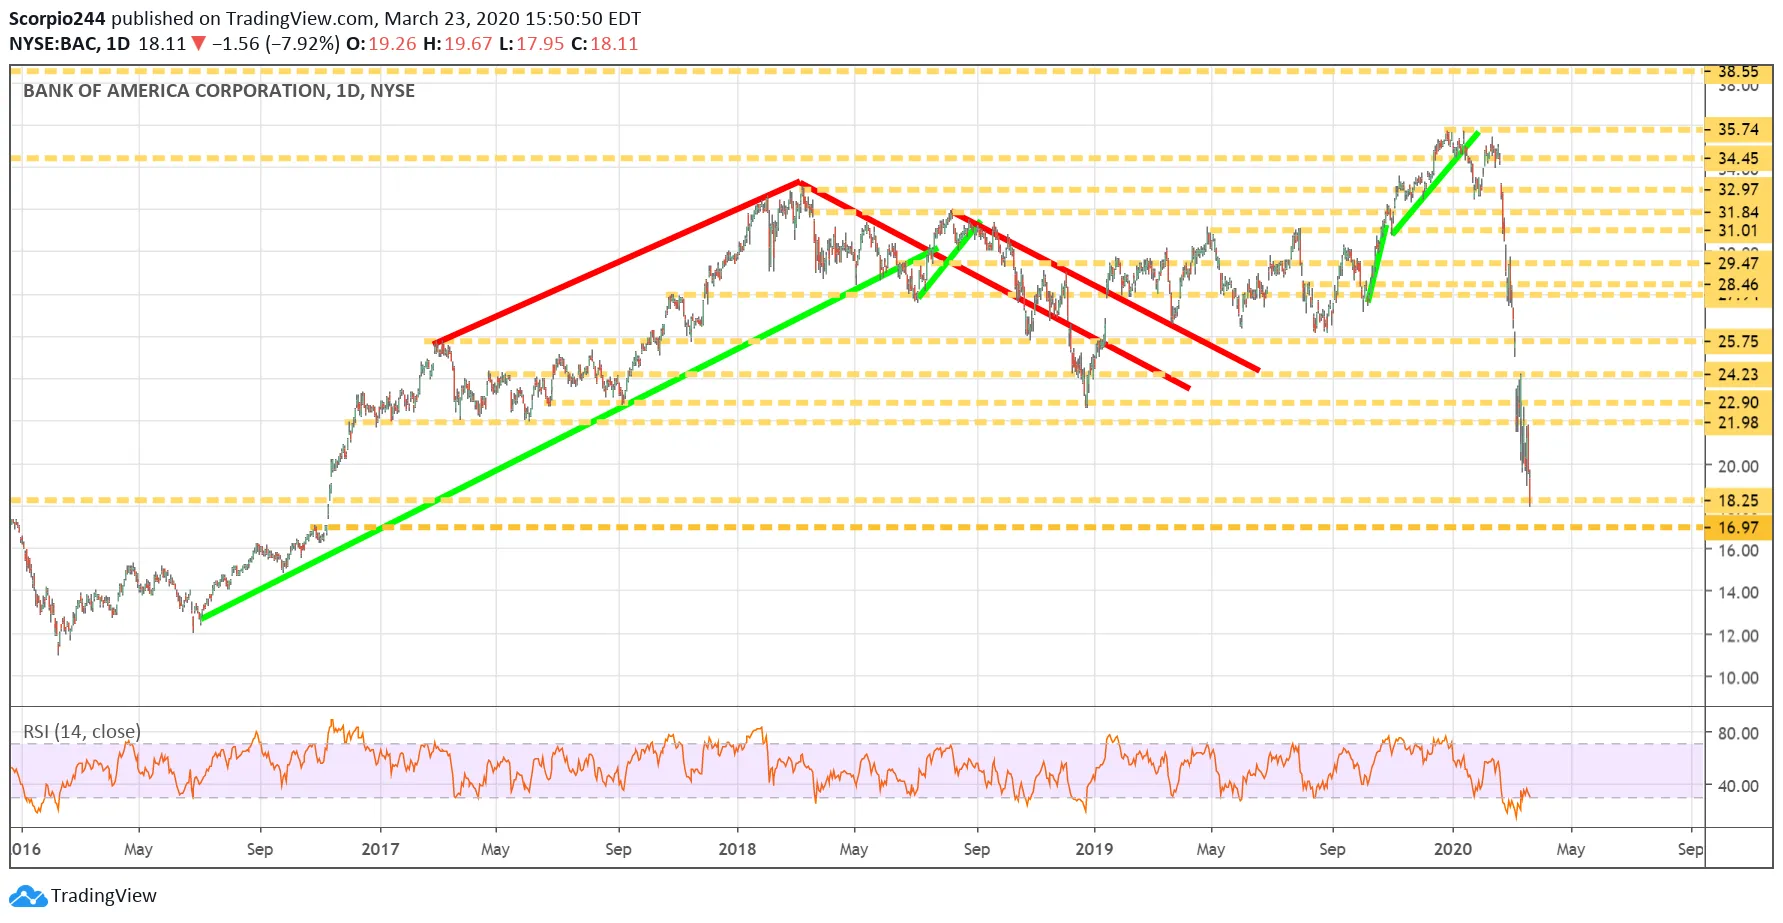
BAC Daily Chart

Original Post

Latest comments

Loading next article…
Risk Disclosure: Trading in financial instruments and/or cryptocurrencies involves high risks including the risk of losing some, or all, of your investment amount, and may not be suitable for all investors. Prices of cryptocurrencies are extremely volatile and may be affected by external factors such as financial, regulatory or political events. Trading on margin increases the financial risks.
Before deciding to trade in financial instrument or cryptocurrencies you should be fully informed of the risks and costs associated with trading the financial markets, carefully consider your investment objectives, level of experience, and risk appetite, and seek professional advice where needed.
Fusion Media would like to remind you that the data contained in this website is not necessarily real-time nor accurate. The data and prices on the website are not necessarily provided by any market or exchange, but may be provided by market makers, and so prices may not be accurate and may differ from the actual price at any given market, meaning prices are indicative and not appropriate for trading purposes. Fusion Media and any provider of the data contained in this website will not accept liability for any loss or damage as a result of your trading, or your reliance on the information contained within this website.
It is prohibited to use, store, reproduce, display, modify, transmit or distribute the data contained in this website without the explicit prior written permission of Fusion Media and/or the data provider. All intellectual property rights are reserved by the providers and/or the exchange providing the data contained in this website.
Fusion Media may be compensated by the advertisers that appear on the website, based on your interaction with the advertisements or advertisers.
© 2007-2025 - Fusion Media Limited. All Rights Reserved.