Investing.com’s stocks of the week
Stocks pieced together a decent day, despite some late day selling on some headlines that not everyone in the White House is on board with a rollback of tariffs. The pullback looks more like a gap fill. Regardless, the decline in the market seems similar to yesterday with the S&P 500 merely filling a gap and holding an uptrend. It is beginning to look as if the next significant level of resistance for the S&P 500 may not come until 3,150 based on a projection of the Oct. 3 until Oct. 21 rally.
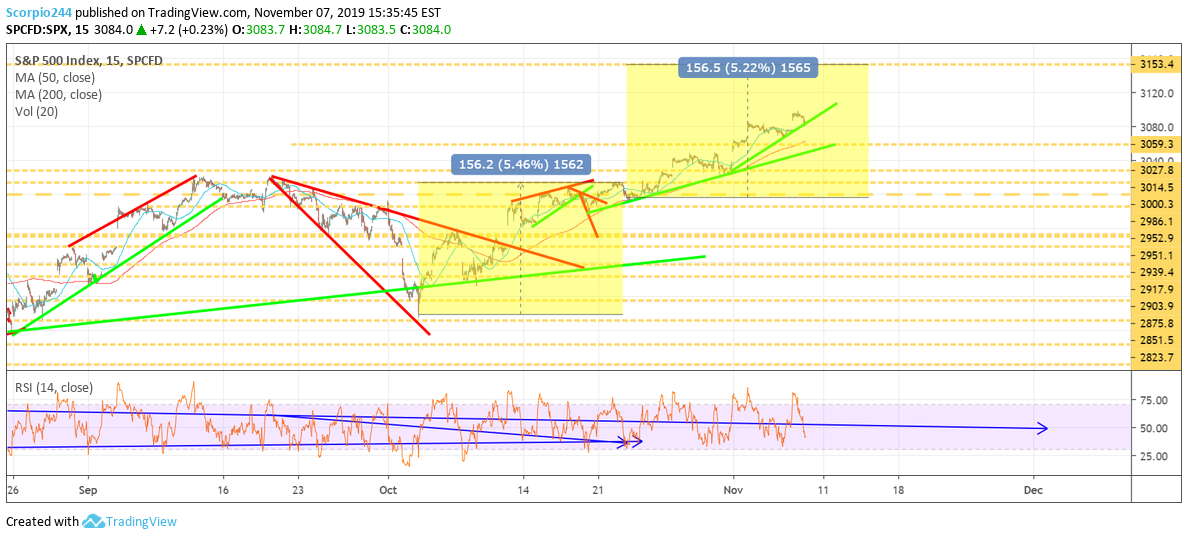
That's not to say that it will go up in a straight line, but it seems like the right place for the index to stop rising.
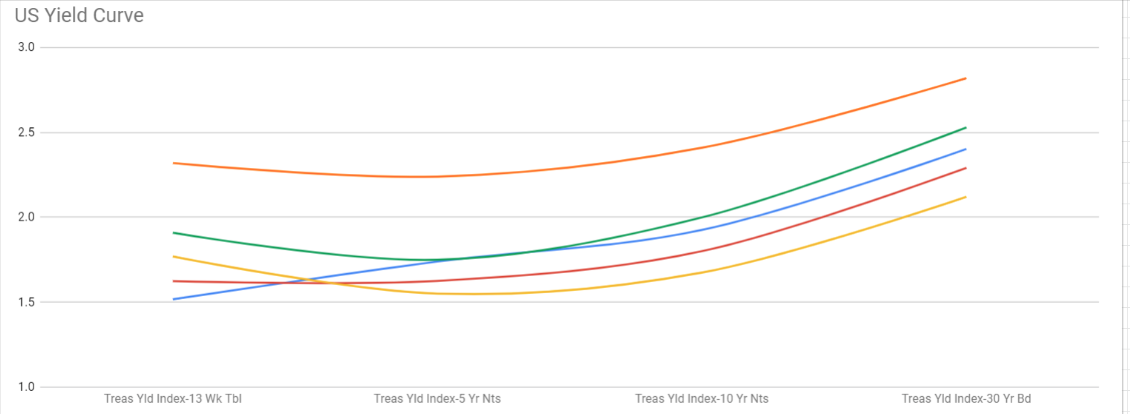
Yield Curve
We can see how the yield curve has steepened materially over the past few weeks, with the blue line repenting today. A signal that perhaps rates are finally back in check and that maybe the market is now looking for growth to return the economy.
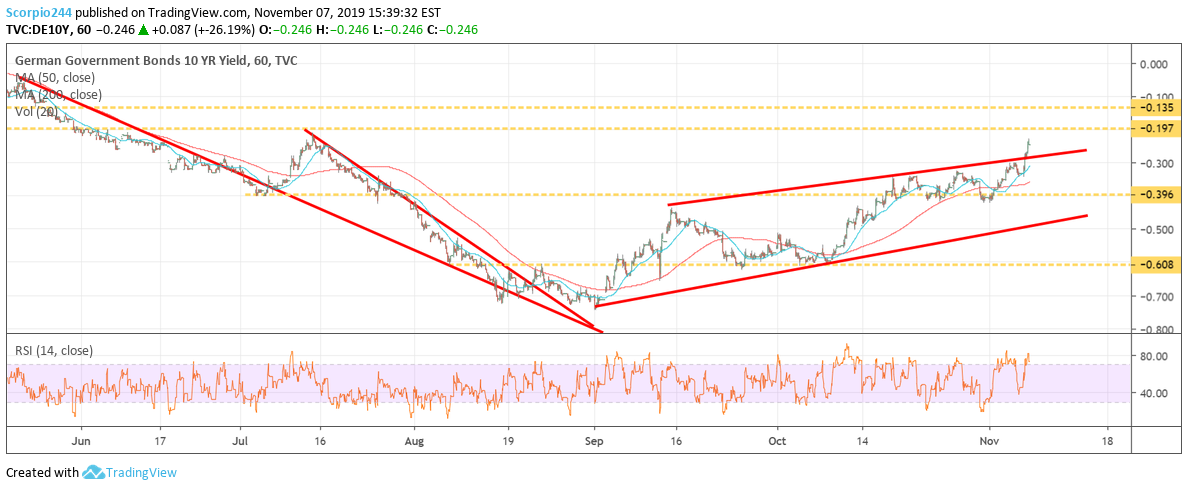
German 10-Year
Meanwhile, 10-Year yields in Germany are on the rise too, and back to -0.24%.
Overall, the market looks fine to me, and I think the trade headlines blow over. There is likely only one person in the WH that doesn’t want to repeal the tariffs, and at this point, President Trump needs to release the economy from this stranglehold it has been in. If that can happen, then perhaps the economy can begin to fire on all cylinders in 2020 and help to strengthen his re-election bid.
Politics are not something we discuss much of, here, but like it or not, the polls will become a big part of 2020. The interesting thing with most of the polls I have observed today is that Trump is getting very similar numbers to what he got in 2015 and 2016, which was in the low 40%. It at least would suggest to me that he hasn’t lost much favborbalitly if any at all despite the negative headlines. Why is that? I have my theories; I will keep private for the time.
STOCKS
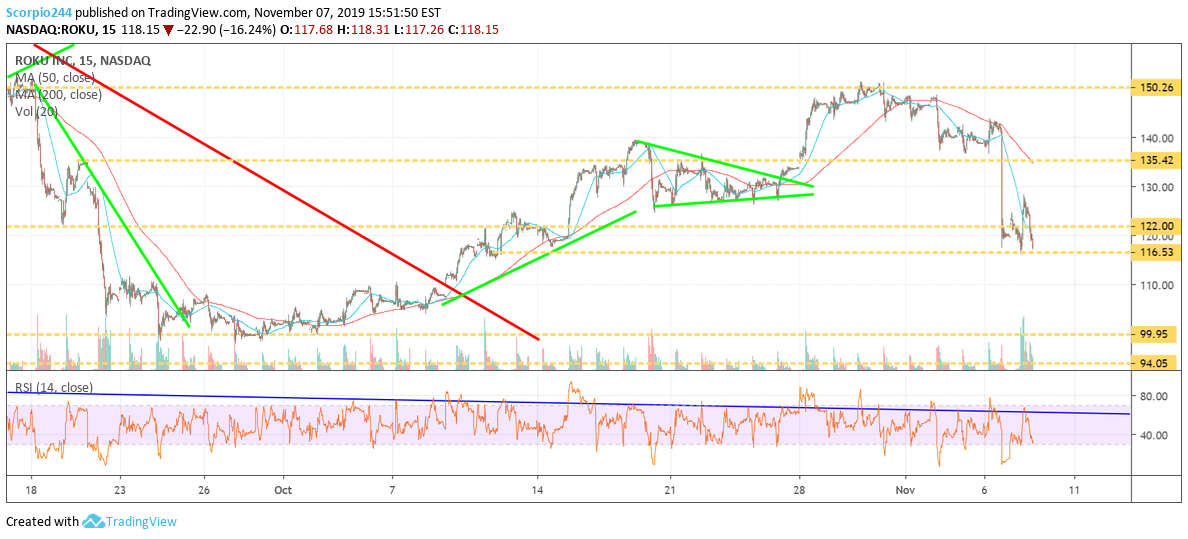
Roku Inc (NASDAQ:ROKU) filled a minor gap at $116 today, and the stock looks terrible. I was worried it might retrace back to $135 intraday, but only go to around $129. The stock is breaking down, and a drop below $116 sends it back to $100.
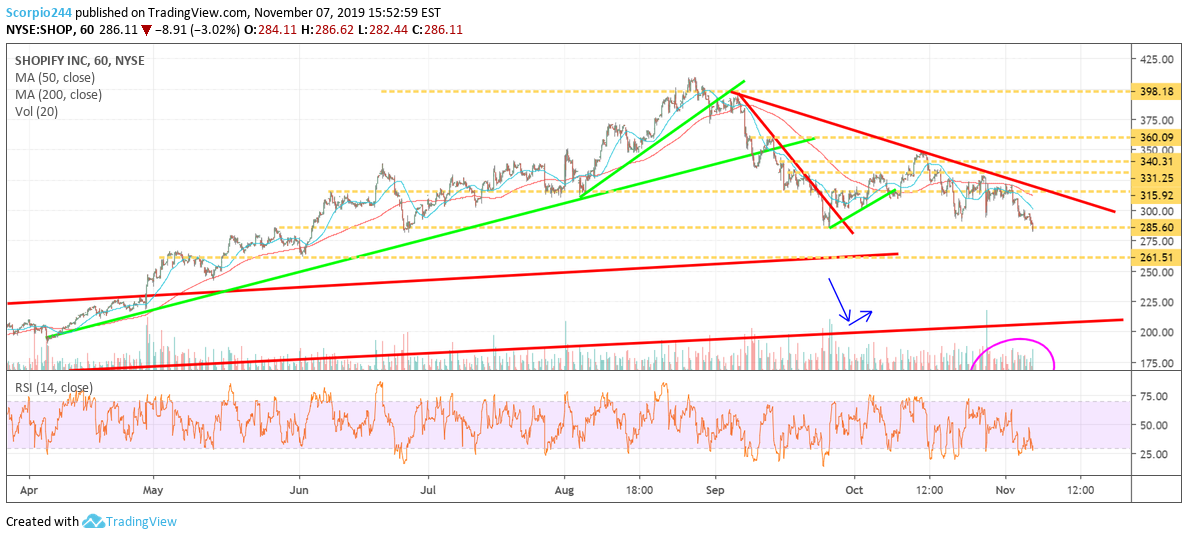
Shopify Inc (NYSE:SHOP): If you are in Shop, now is the time to GET nervous. The stock is on the cusp of another $20 drop to around $261. The last time the stock got to $285, it held, this time, it may not be so lucky.
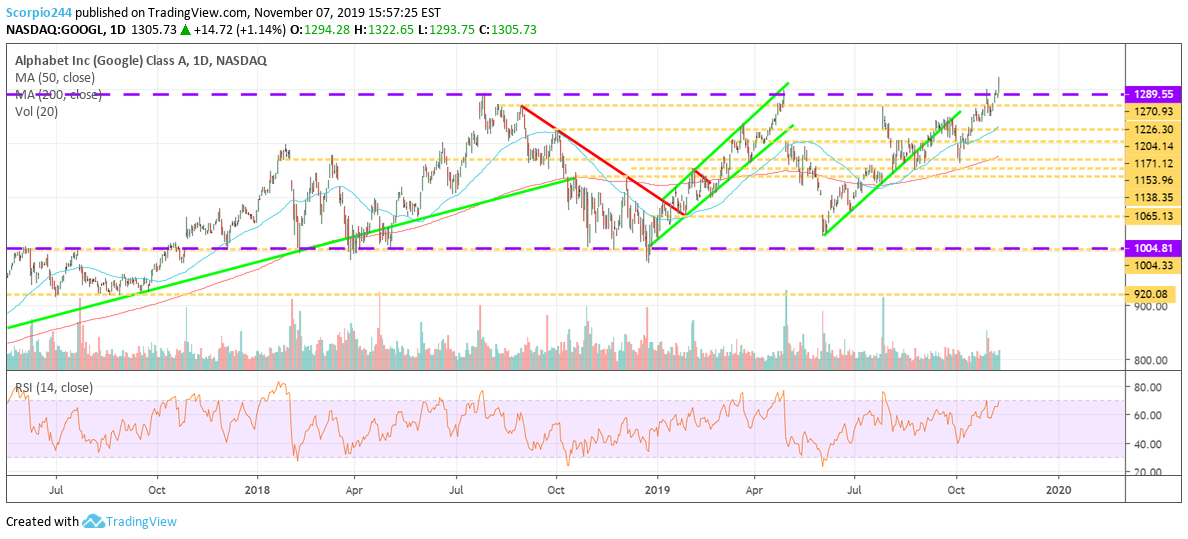
Alphabet (NASDAQ:GOOGL) had a huge breakout today, rising above its old highs around $1300. That should act as a healthy level of support going forward. It would be healthy for the stock to consolidate around here.
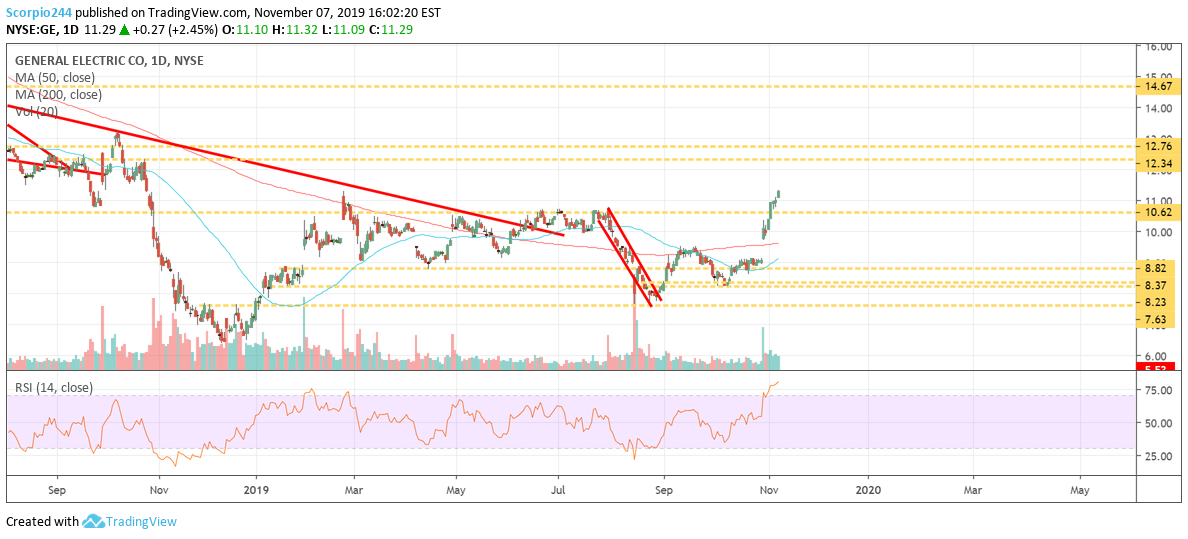
General Electric Company (NYSE:GE) continues to look healthy, heading towards $12.35.
Copper is trying to break out at $2.71, with the potential to rise to around $2.8.
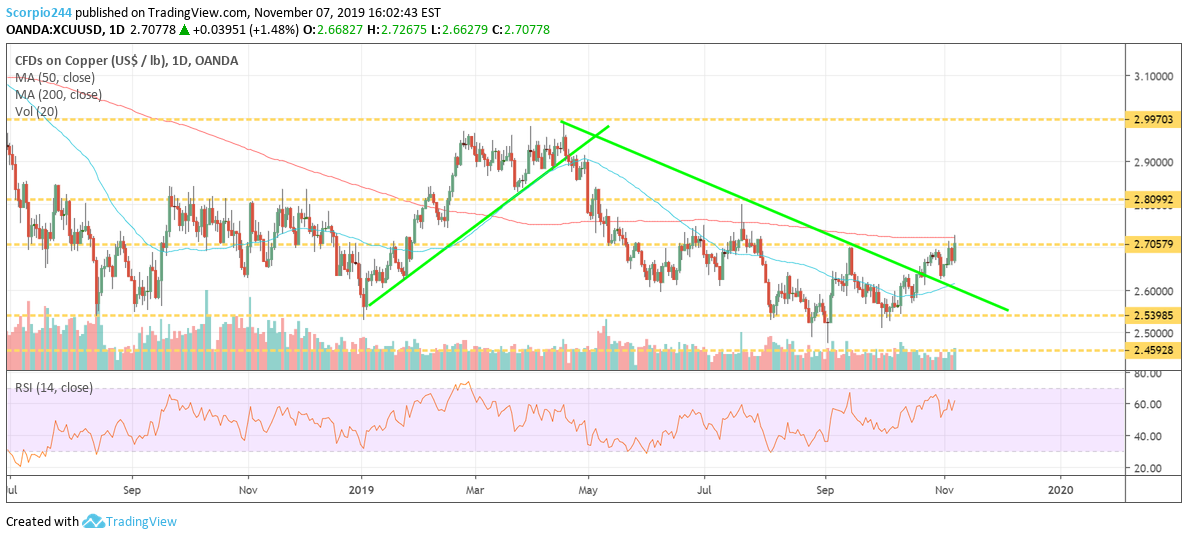
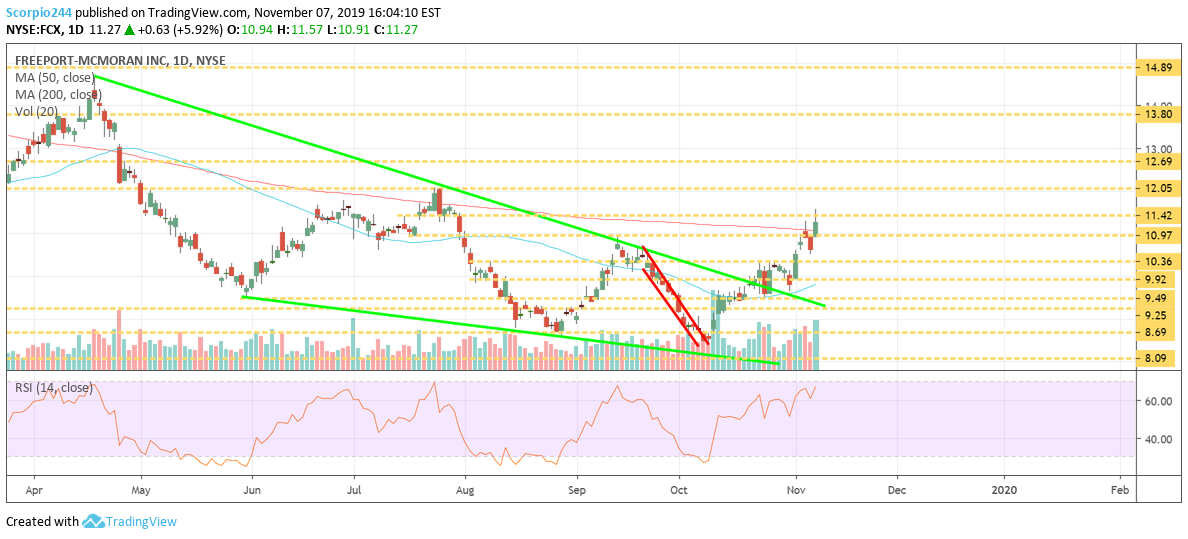
Freeport-McMoran Copper & Gold Inc (NYSE:FCX): A big winner if copper does break out will be FCX. I spoke out FCX today, in a video, and could have some further to rise.
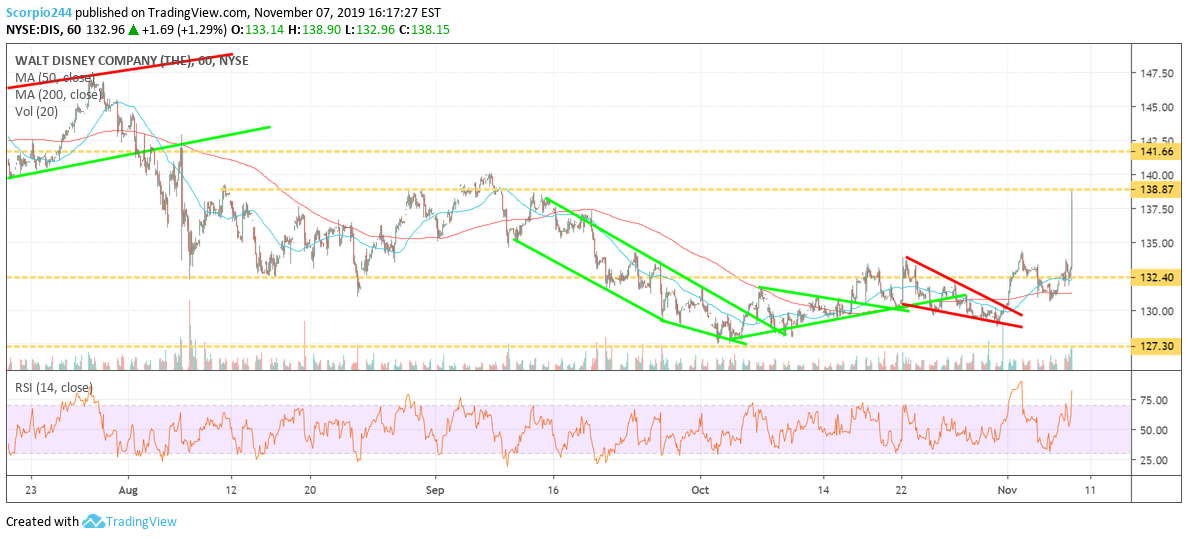
Walt Disney Company (NYSE:DIS) reported better top and bottom results and the stock is surging higher. $139 may be a short-term resistance level. Will continue to watch as news comes out.
