Investing.com’s stocks of the week
Stocks had a strong day with the S&P 500 rising by 85 basis point to close at an all-time high. The index broke out today, as we expected and noted last night and this morning. The index cleared the critical level of resistance at 3,150, and I think that sets up a push to 3,200.
The market got a boost on headlines of a potential phase one trade deal between the US and China and the chance that some of the tariffs get rolled back.
So while I have long said that the market has, for the most part, has stopped worrying about the trade war, which based on price action it has. What the market has not calculated is the rollback of tariffs. If tariffs that have already been put in place do get rolled back, it could be like companies getting a big tax cut, which it is, helping to boost earnings growth.
That would mean that earnings estimates for 2020 are too low, and will need to rise for the entire S&P 500. It would be an unexpected positive which in itself could act as a meaningful catalyst for stocks because it means that valuations for stocks are too low.
S&P 500 (SPY (NYSE:SPY))
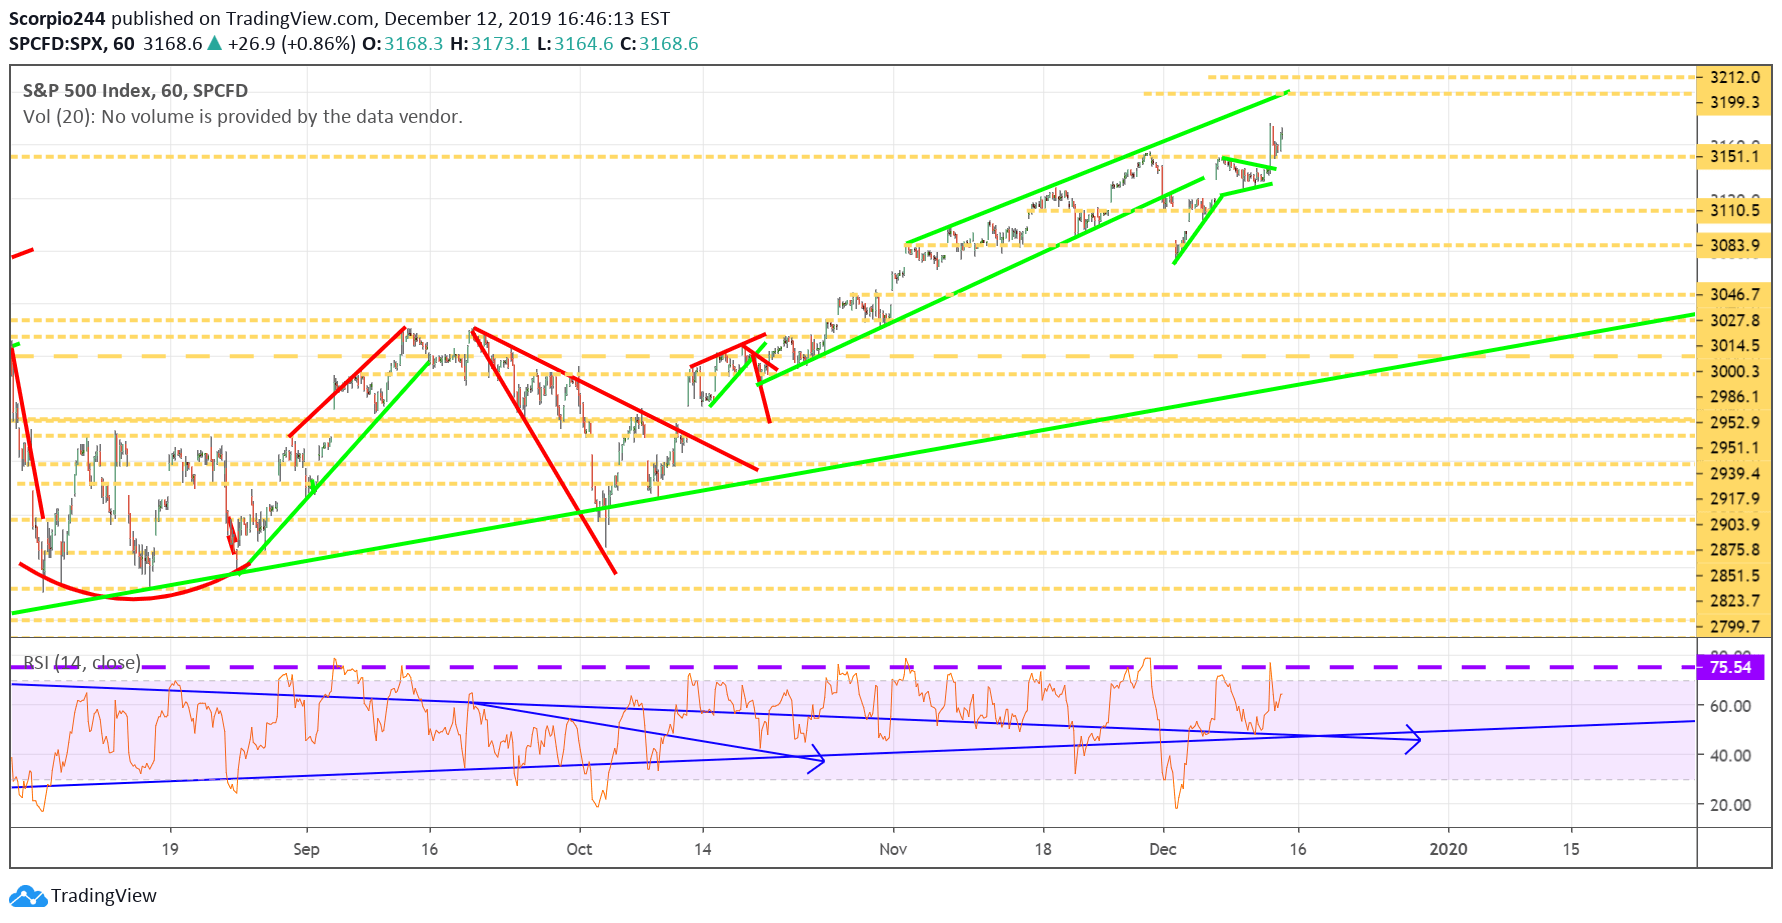
Based on the pennant pattern that I noted yesterday, the S&P 500 could climb to around 3,212.
Russell 2000 (IWM)
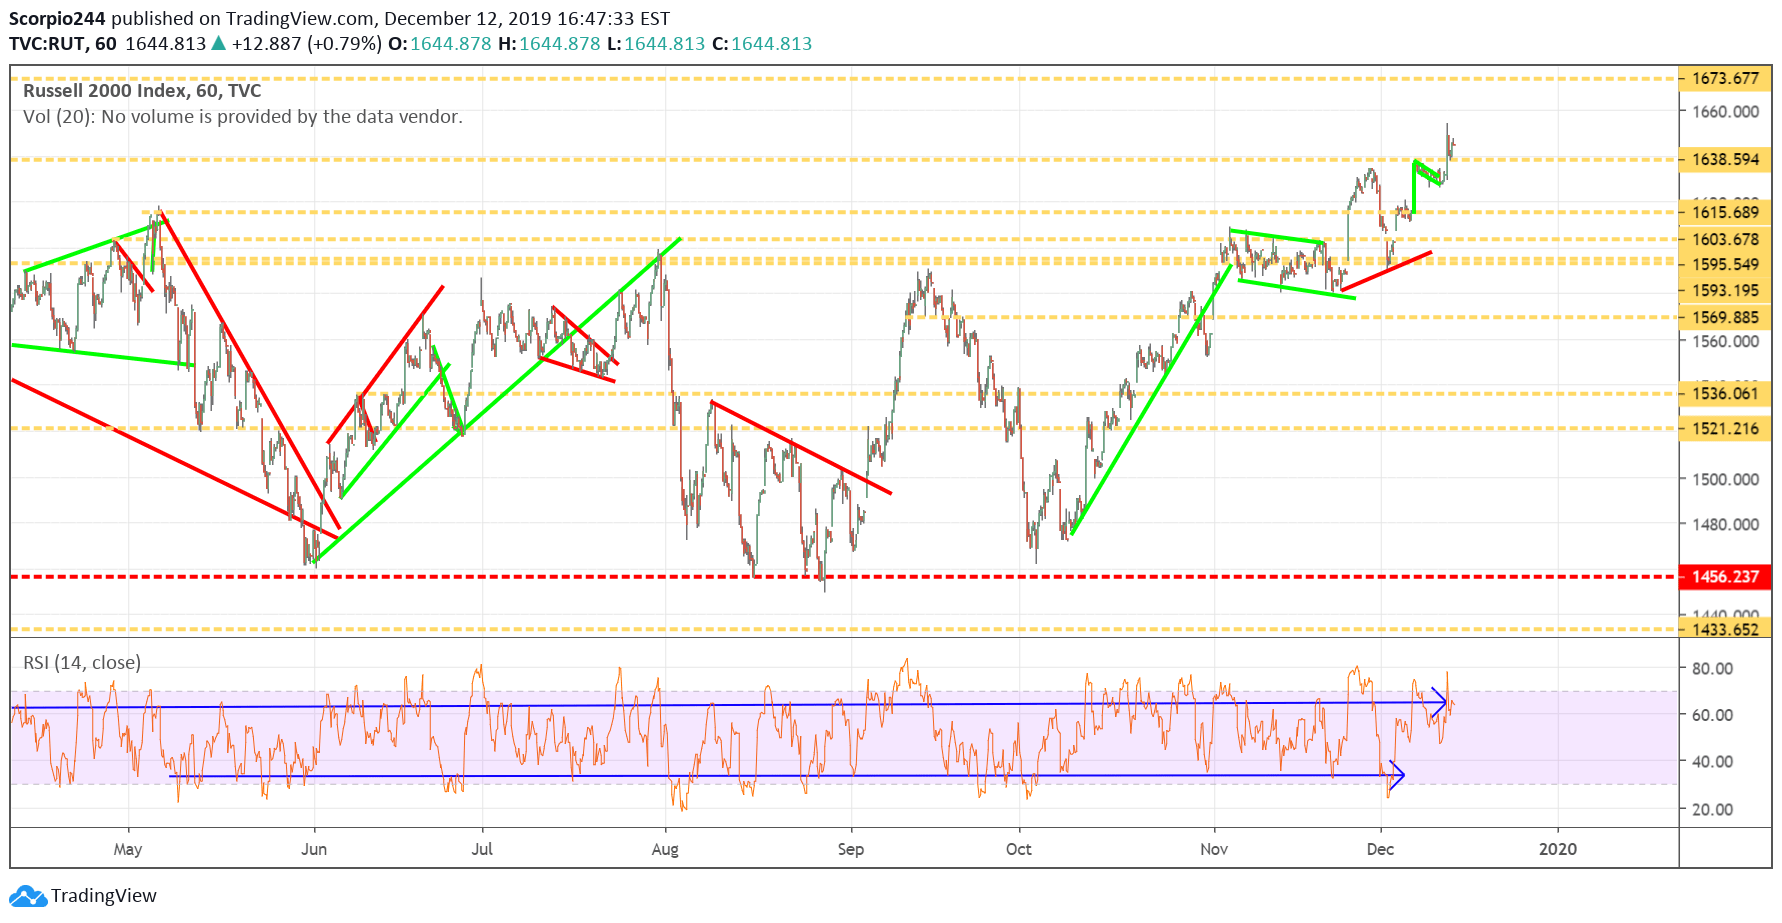
The Russell 2000 also rose above a critical level of resistance at 1,638, and that could help to push the index to its next major of resistance to 1,675.
AMD (AMD)
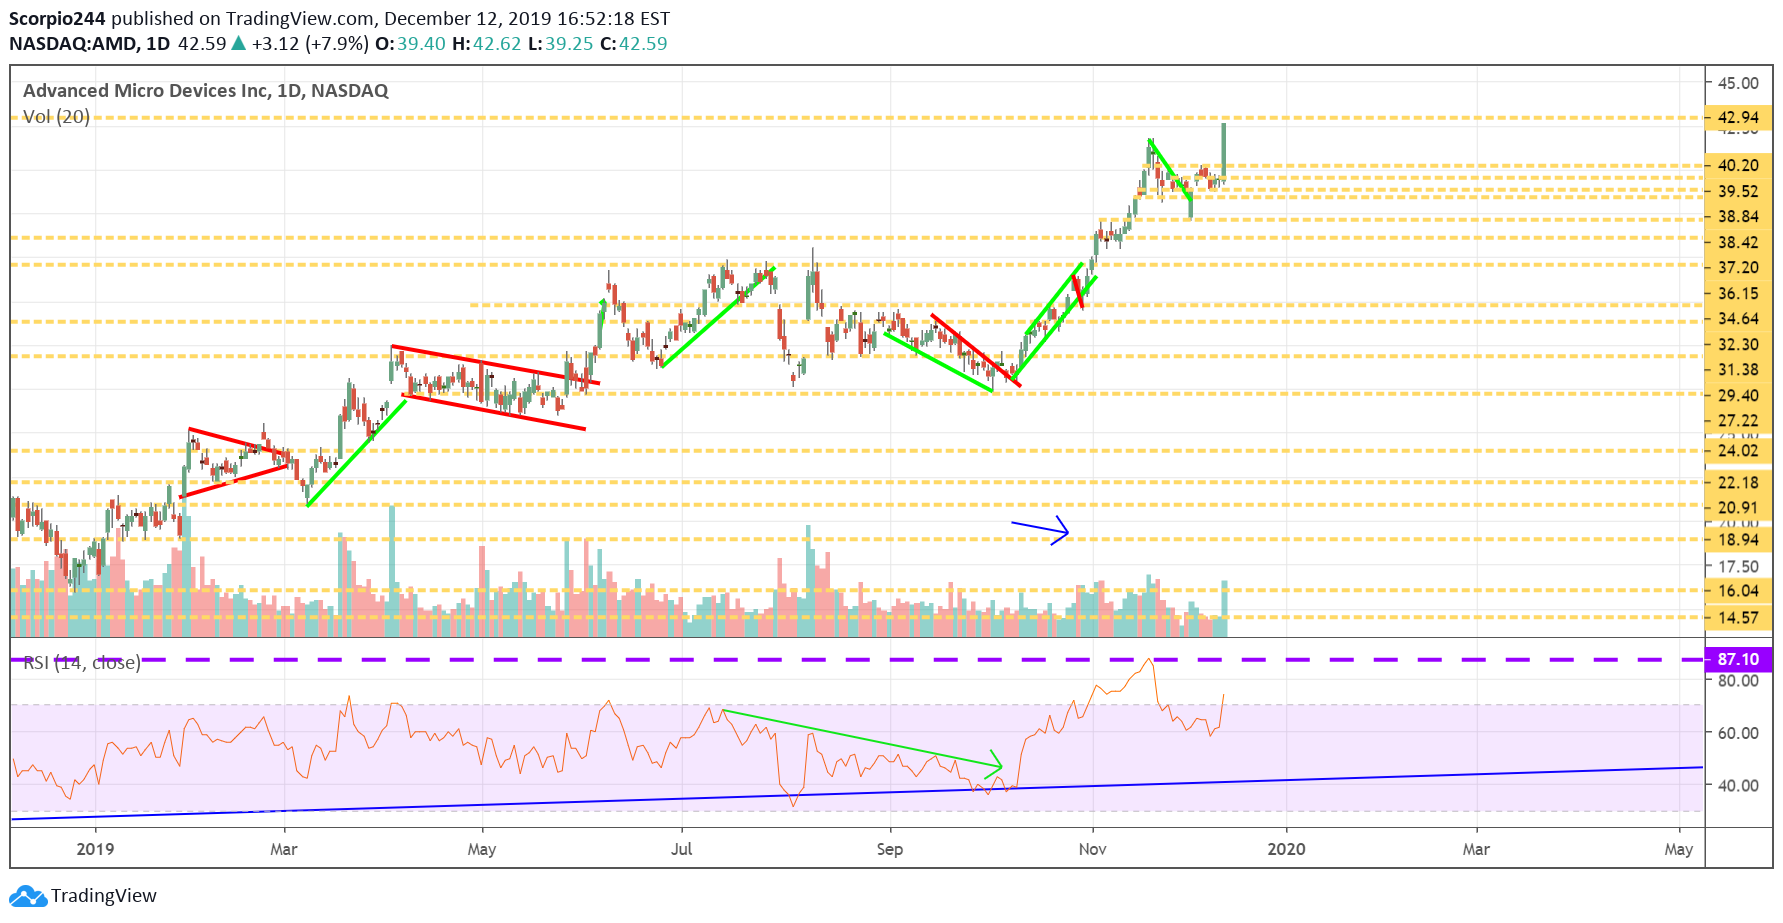
Advanced Micro Devices (NASDAQ:AMD) had an intense day, and blew right through resistance at $40.20 and pushed directly to its next major region of resistance at $42.59. I think, given this is a multi-year high, the stock will try to consolidate around this price point.
Nvidia (NVDA)
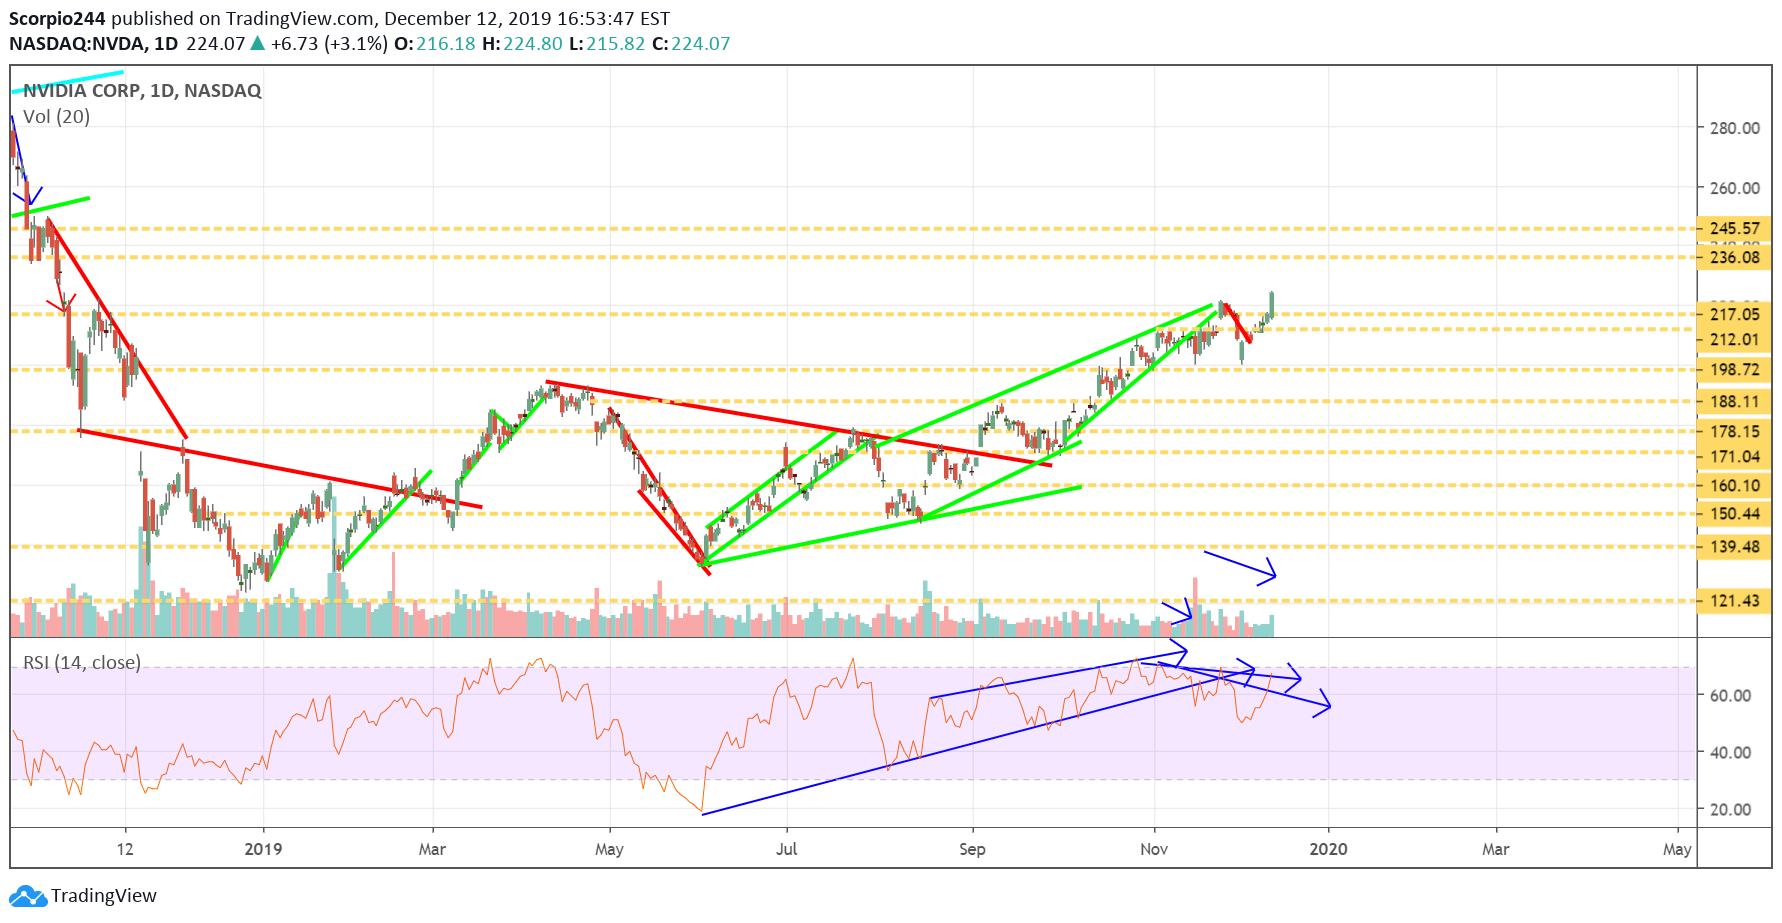
NVIDIA Corporation (NASDAQ:NVDA) surged higher, despite my negativity and bearish views, and it would seem as if I have proven wrong. It happens. That likely means this stock will continue to climb and push higher towards $236.
Roku (ROKU)
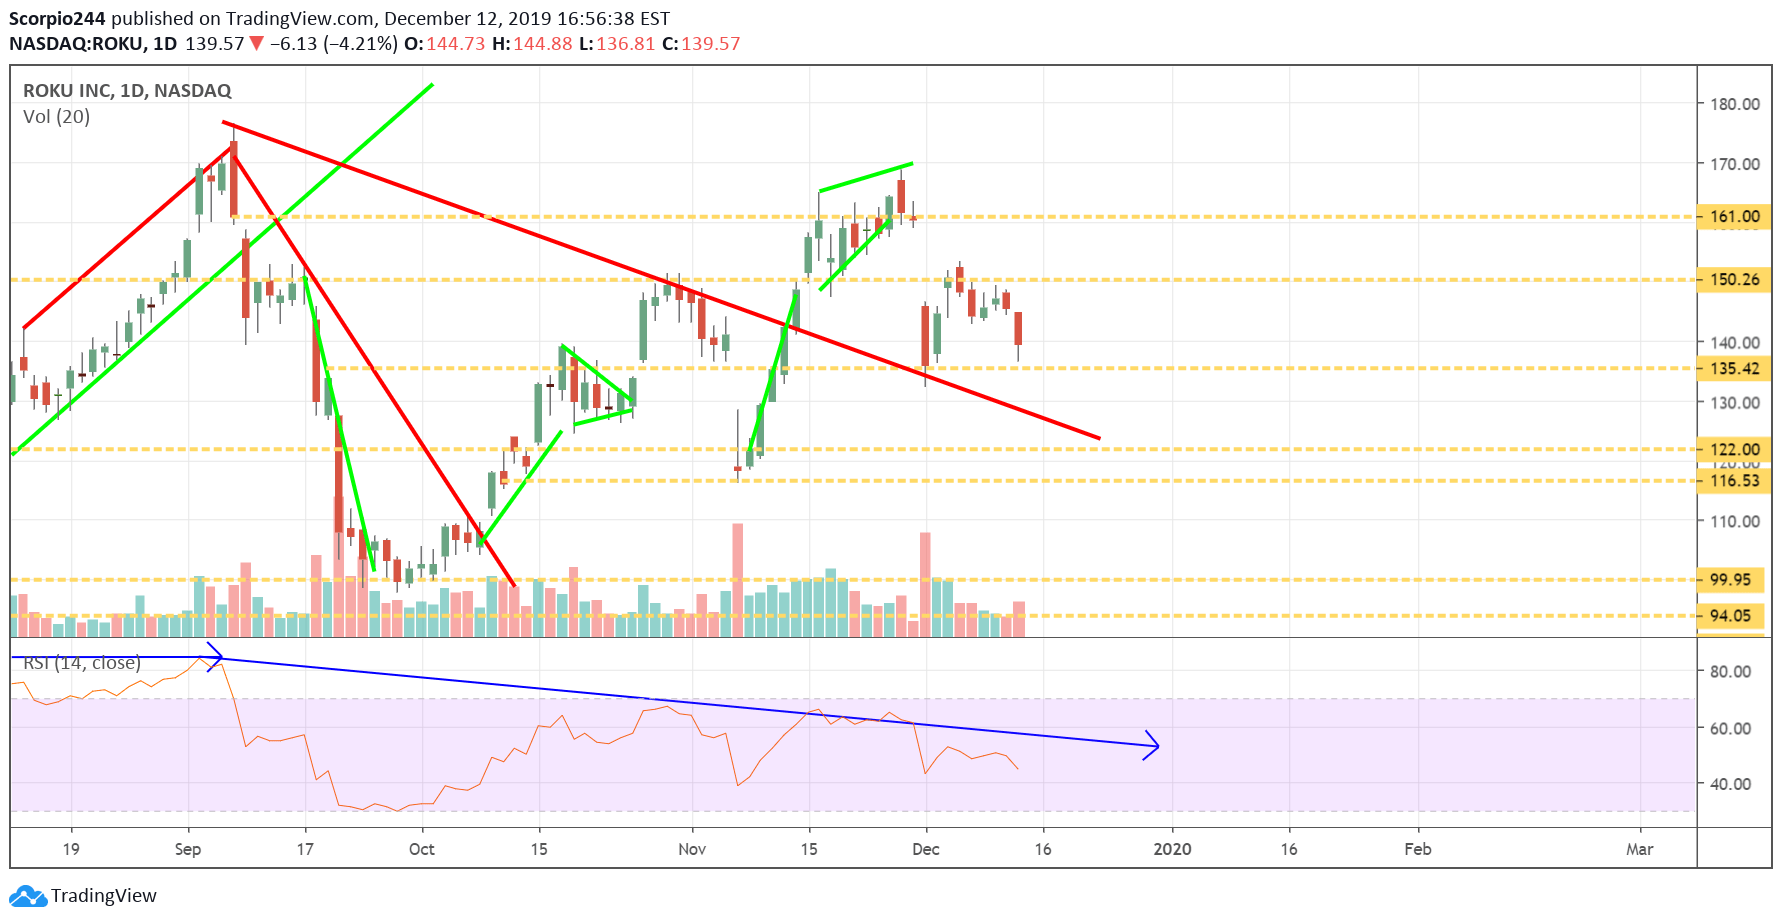
Roku (NASDAQ:ROKU) did not have a good day, falling towards $135. The bad news is that now the RSI is falling, and volume levels are rising as the stock is falling. It probably means more declines on the way.
Facebook (NASDAQ:FB)
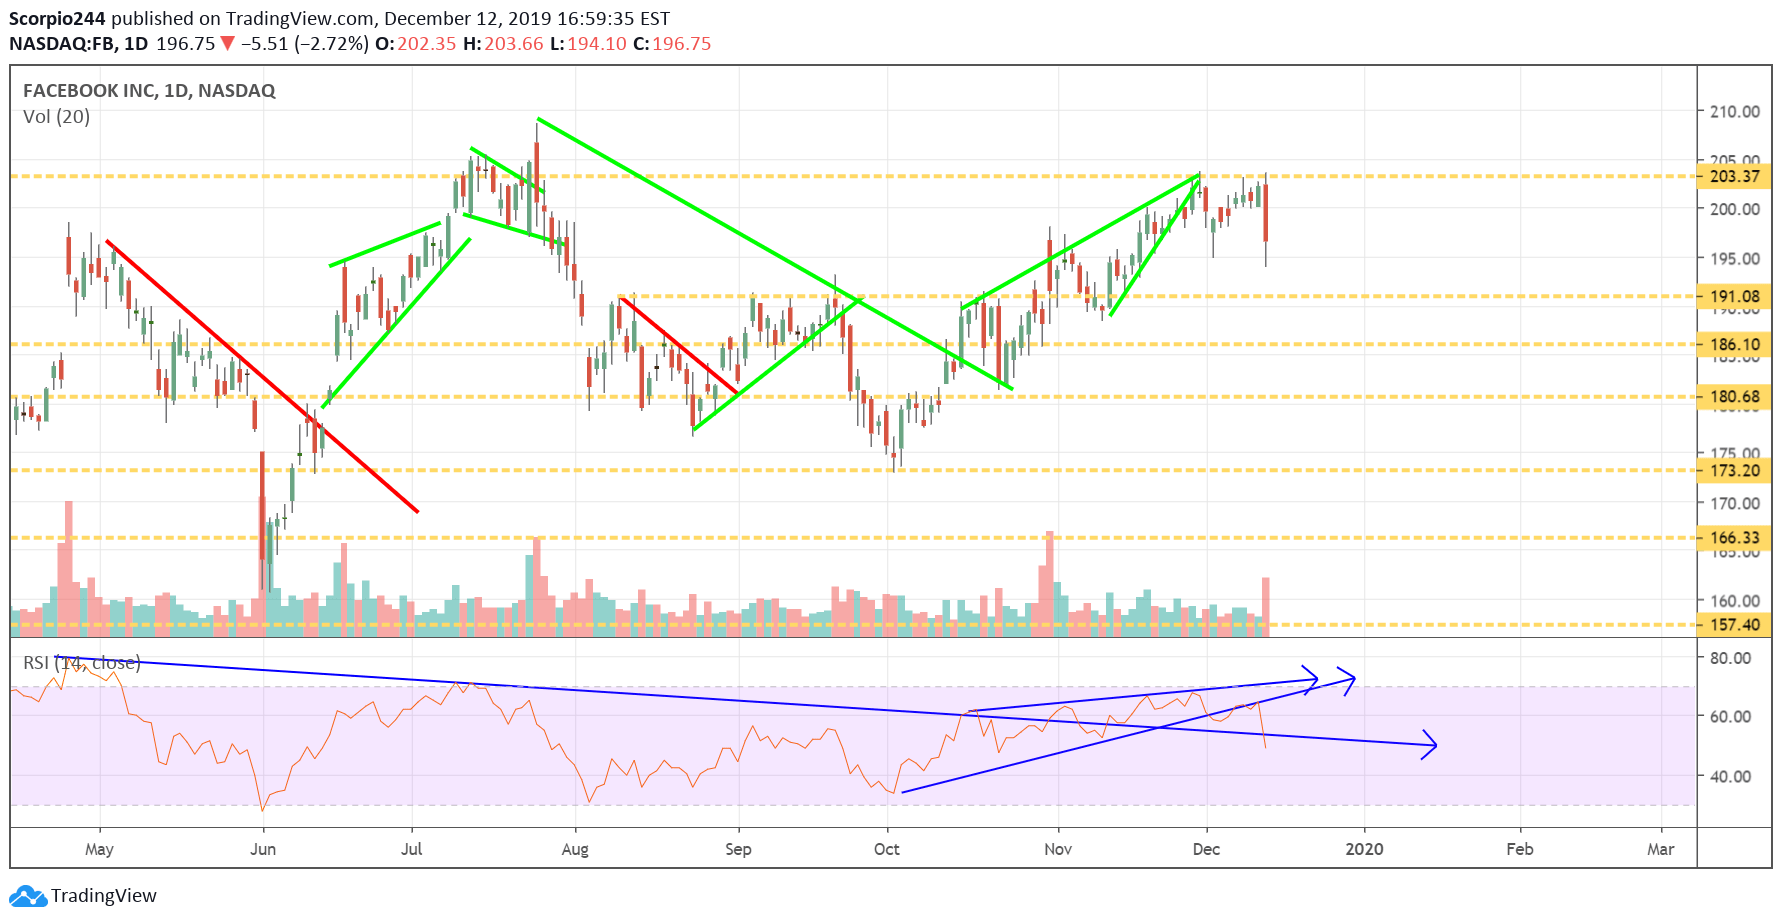
Facebook (NASDAQ:FB) did not have a good day either with the stock falling on negative headlines around a potential FTC injunction. The stock looks like it finally broke with the potential for a move lower to $191.
Tesla (NASDAQ:TSLA)
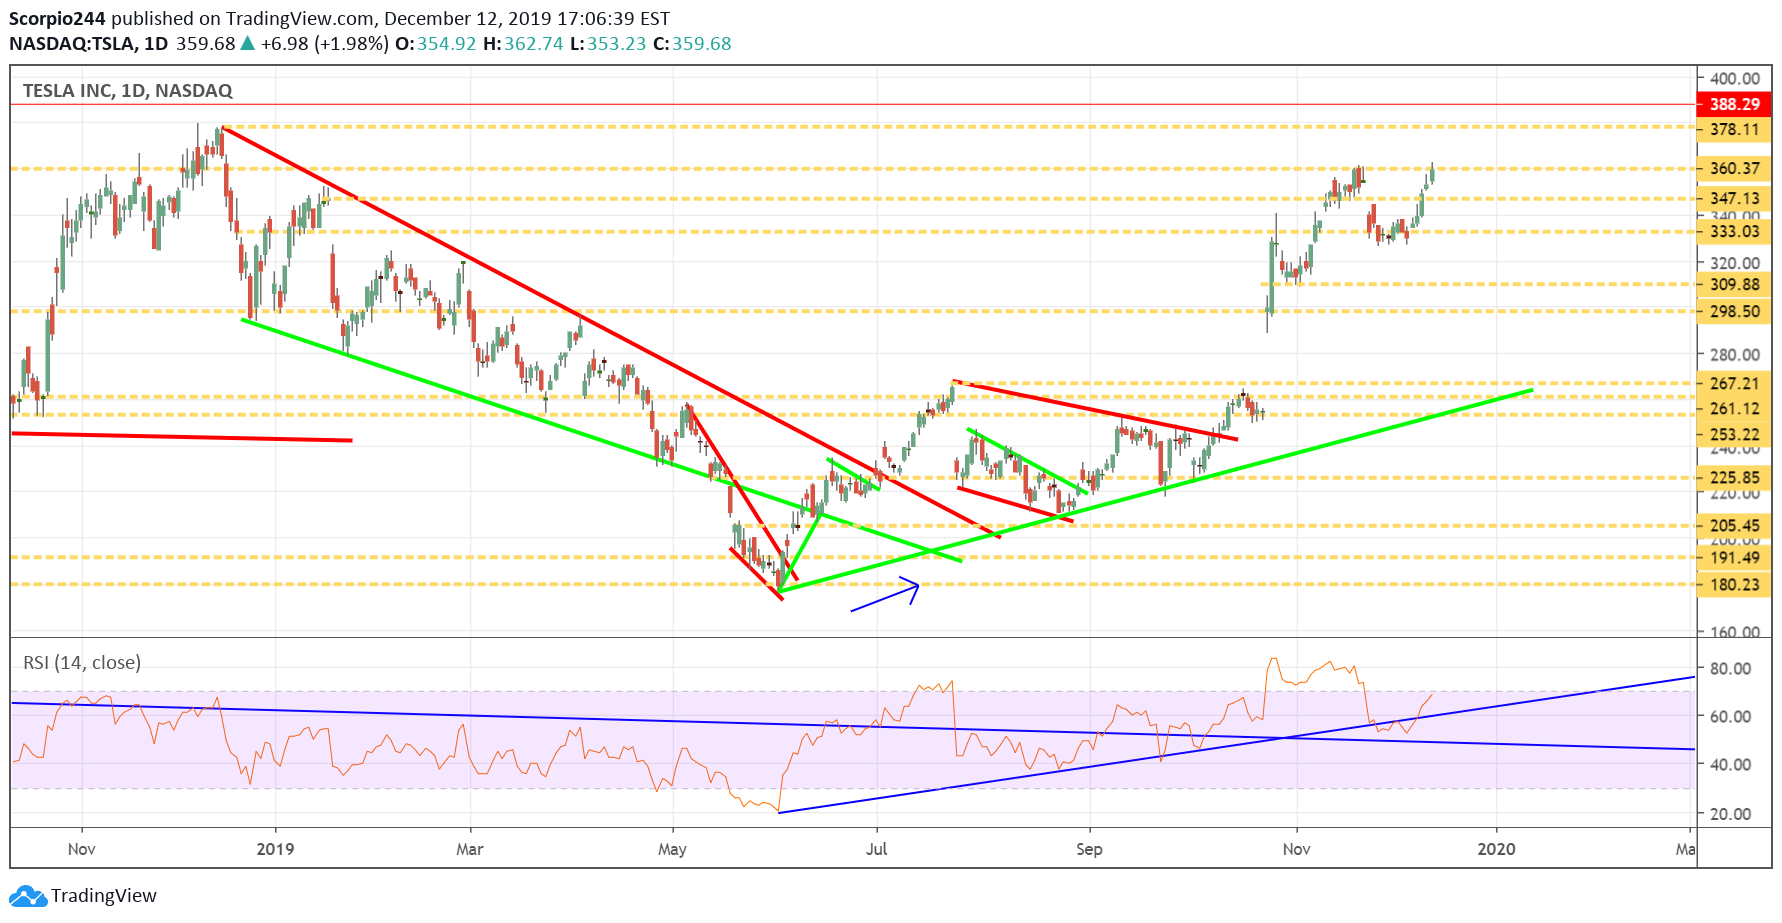
Tesla (NASDAQ:TSLA) is moving up and is challenging resistance now at $360. Should the stock push above this resistance level, it runs higher towards $378. Pretty amazing that the stock has doubled since reaching a low of $177 in June.
