Investing.com’s stocks of the week
So it was another day of stocks rising with the S&P 500 climbing by 1.7% to finish at 2,971. The market for today increased despite any specific coronavirus headlines, which was certainly nice. I can’t say that much changed from a technical standpoint, nor a fundamental perspective.
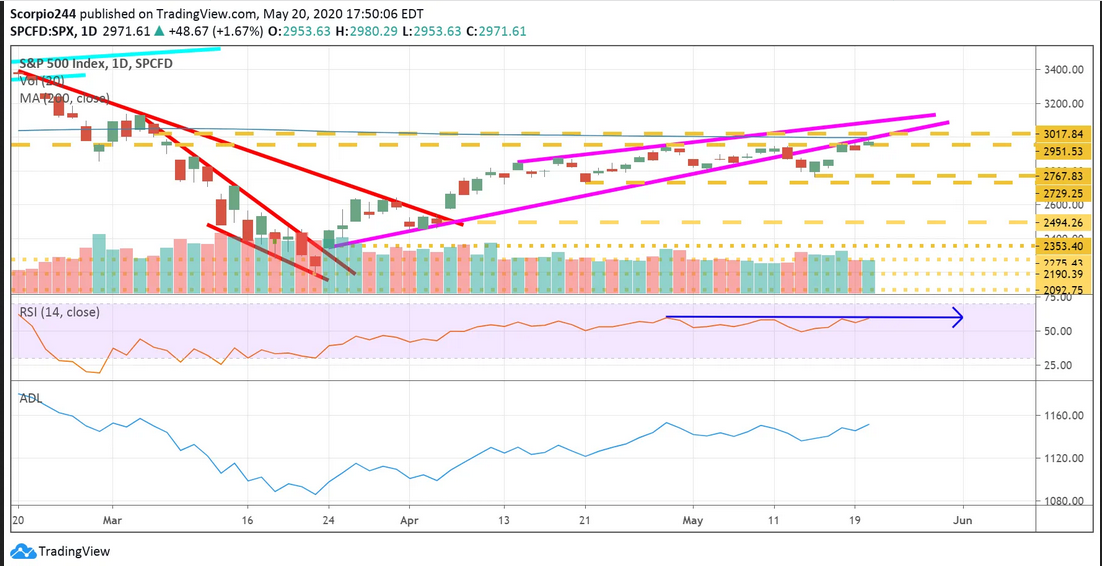
Yesterday the S&P 500 increased to the highest level since the beginning of March. For some time, we were going no were fast, but Wednesday was the first day that we could say that stocks broke out of there prior trading range. The rising wedge pattern I have been following is still present, but fears of a double top or triple top can now be pushed to the side.
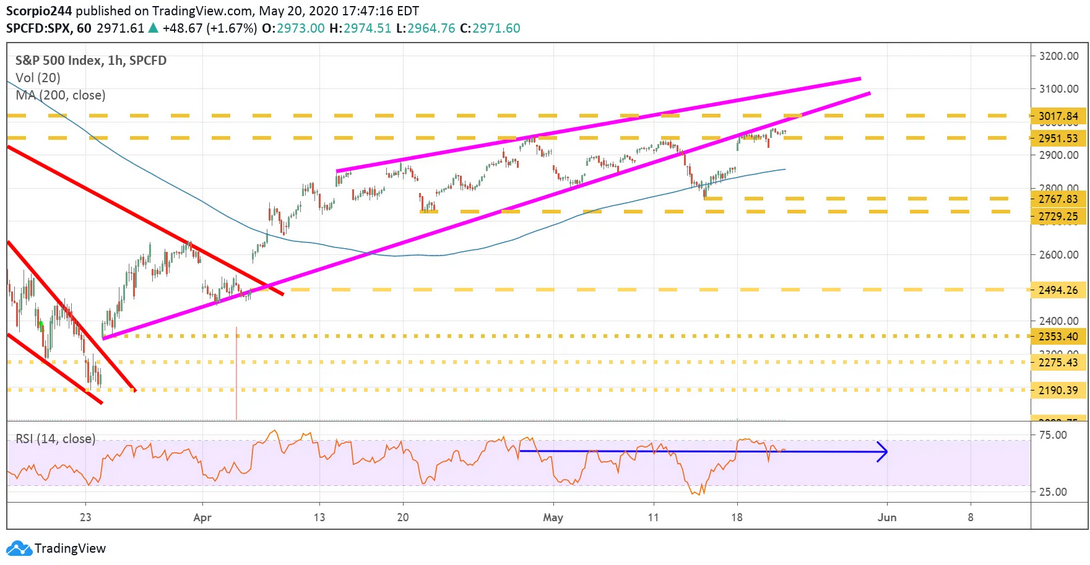
The RSI today did not make a new high, nor did the advance-decline line. Ideally, we want to see these two indicators climbing along with the index, but not everything can always be perfect. Volume levels weren’t all that great either.
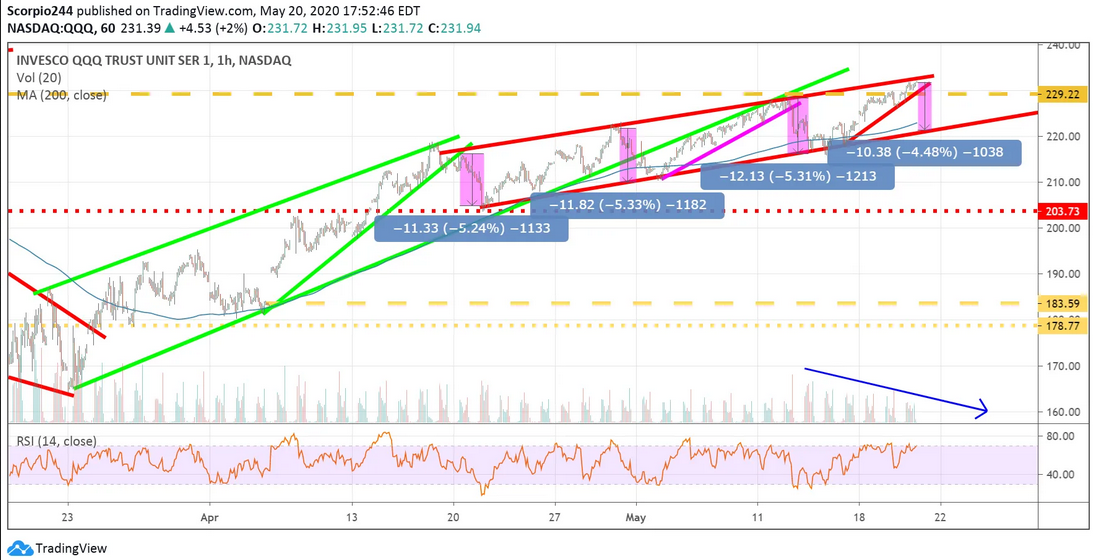
Nasdaq 100 ETF (QQQ)
The QQQs are now at the top of their trading range, and at least the last three times this happened, the Qs ended up dropping by about 5% to the lower end of the range. Perhaps this time will not be different?
VIX
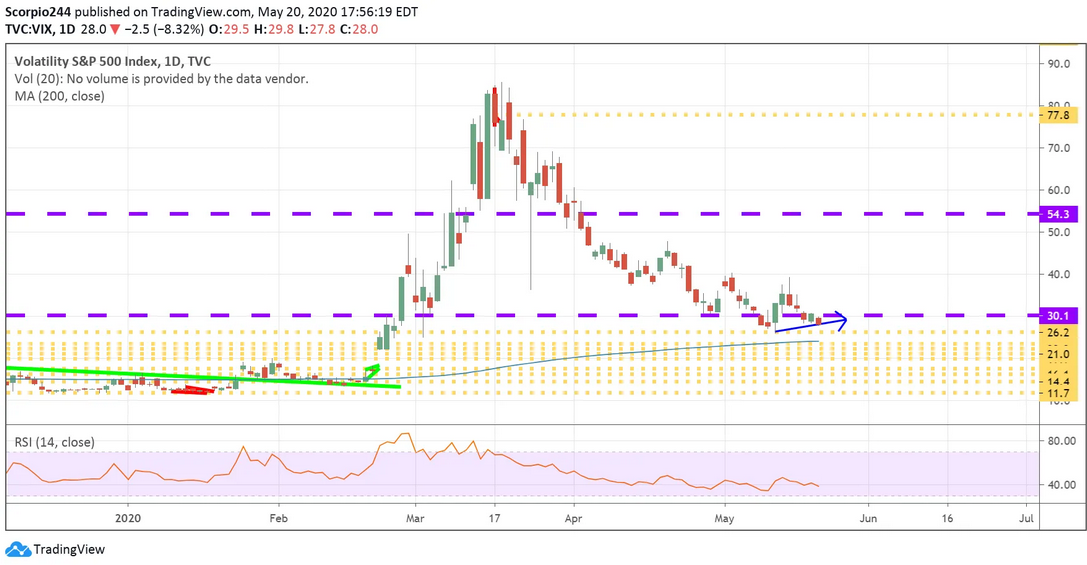
The VIX still has not made a new recent low, trading around 28 yesterday. As long as the VIX continues to decline, it can help to drag the S&P 500 higher. As volatility comes out of the market and put values decline, it forces dealers to get long more futures, helping to push the market into positive gamma territory, which means lower volatility and higher prices.
Facebook (FB)
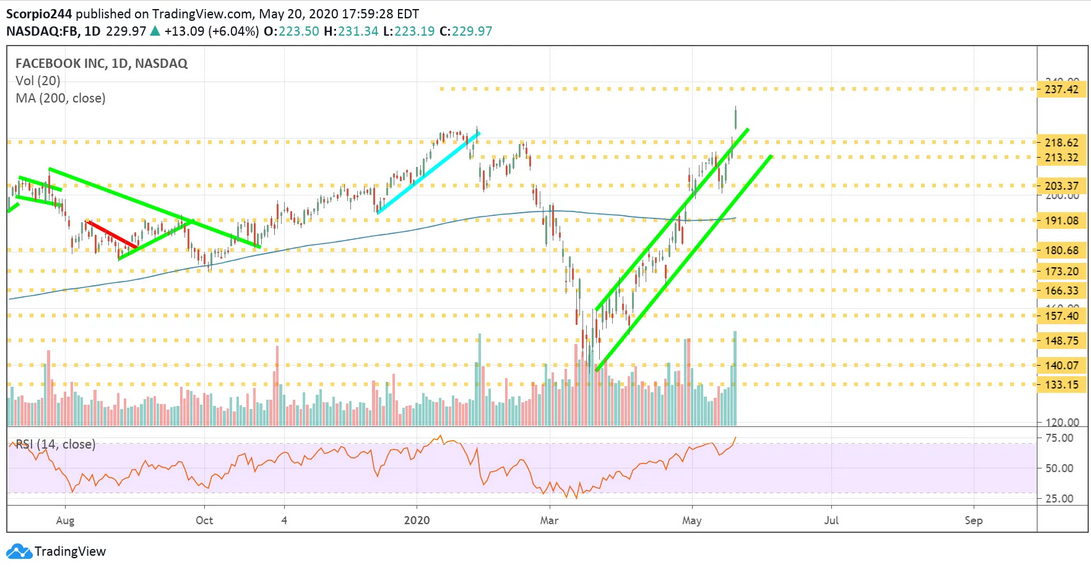
Facebook (NASDAQ:FB) made me look pretty stupid this week. It wasn’t so much that my chart was off, more so that the company launched its new Shops unit, which helped to fuel the rally. Yes, Facebook has an RSI that is over 70, but we can see the trend is higher here, and volume was tremendous yesterday. So I guess it continues to push higher towards $238.
NVIDIA (NVDA)
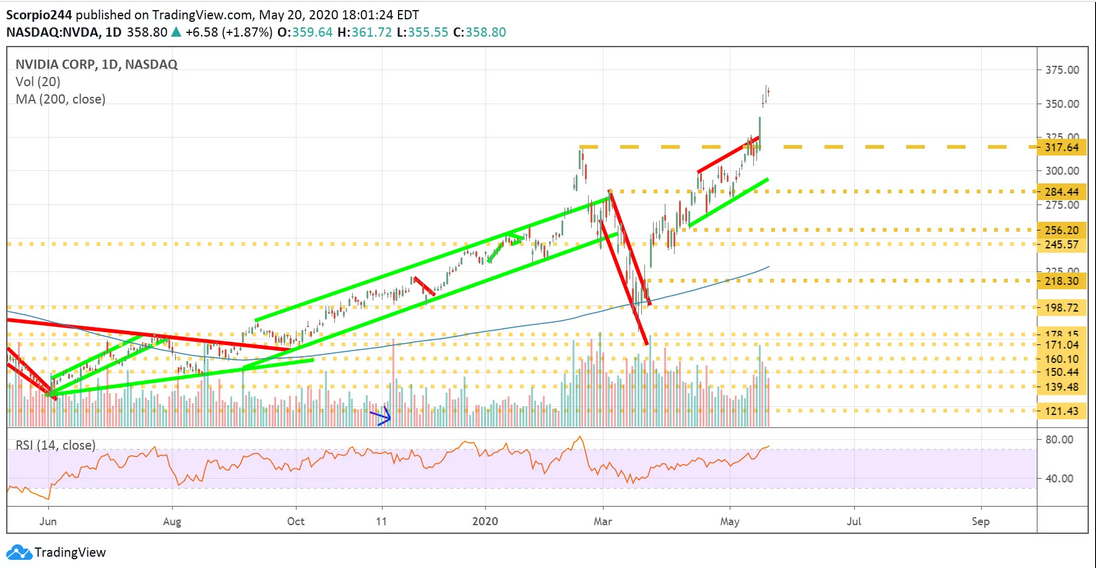
NVIDIA Corporation (NASDAQ:NVDA) will report today, and I have no idea what the company is going to have to say to keep this marching higher. The stock has doubled since the middle of March, its valuation is the highest it has been in years on a P/E basis. In this case, the chart tells you nothing, and the options market has been silent. So I have no clue.
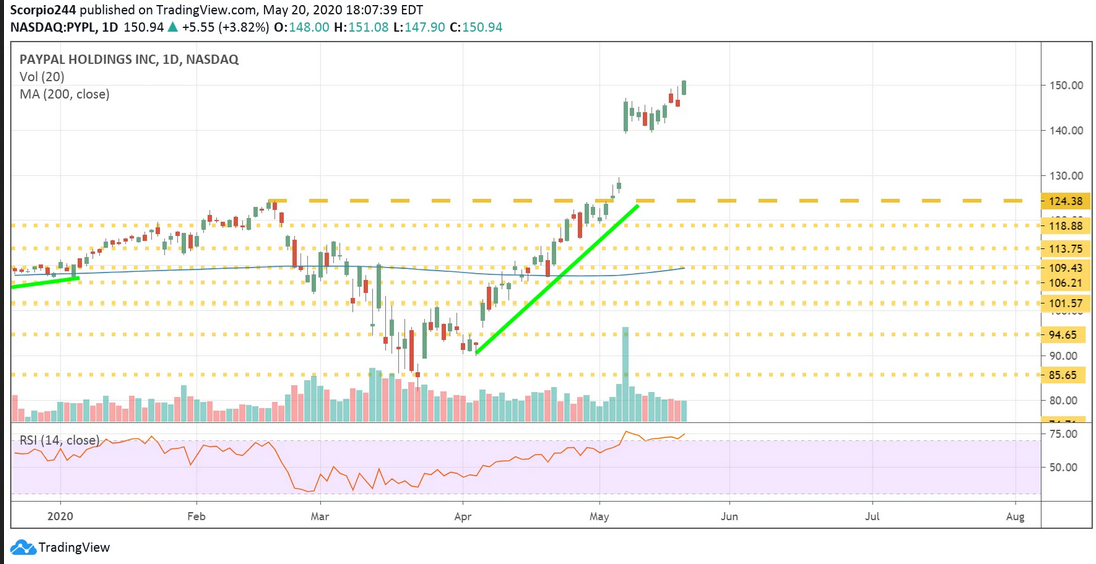
PayPal (PYPL)
PayPal has been super hot, but the volume has been falling and the RSI is starting to diverge, and well, doesn’t it have to fall at some point? $130 would seem like the logical spot.
