Stocks Appear To Be Targeting One Thing At This Point, Higher Prices

Published 12/27/2019, 12:47 AM
Updated 11/16/2024, 07:53 AM
US500
-
C
-
AAPL
-
AMZN
-
NFLX
-
SNAP
-

S&P 500

Stocks continue to march higher with no end in sight. By many indications, the market is getting extraordinarily overbought, and it worries me for what will come once it decides to turn lower.

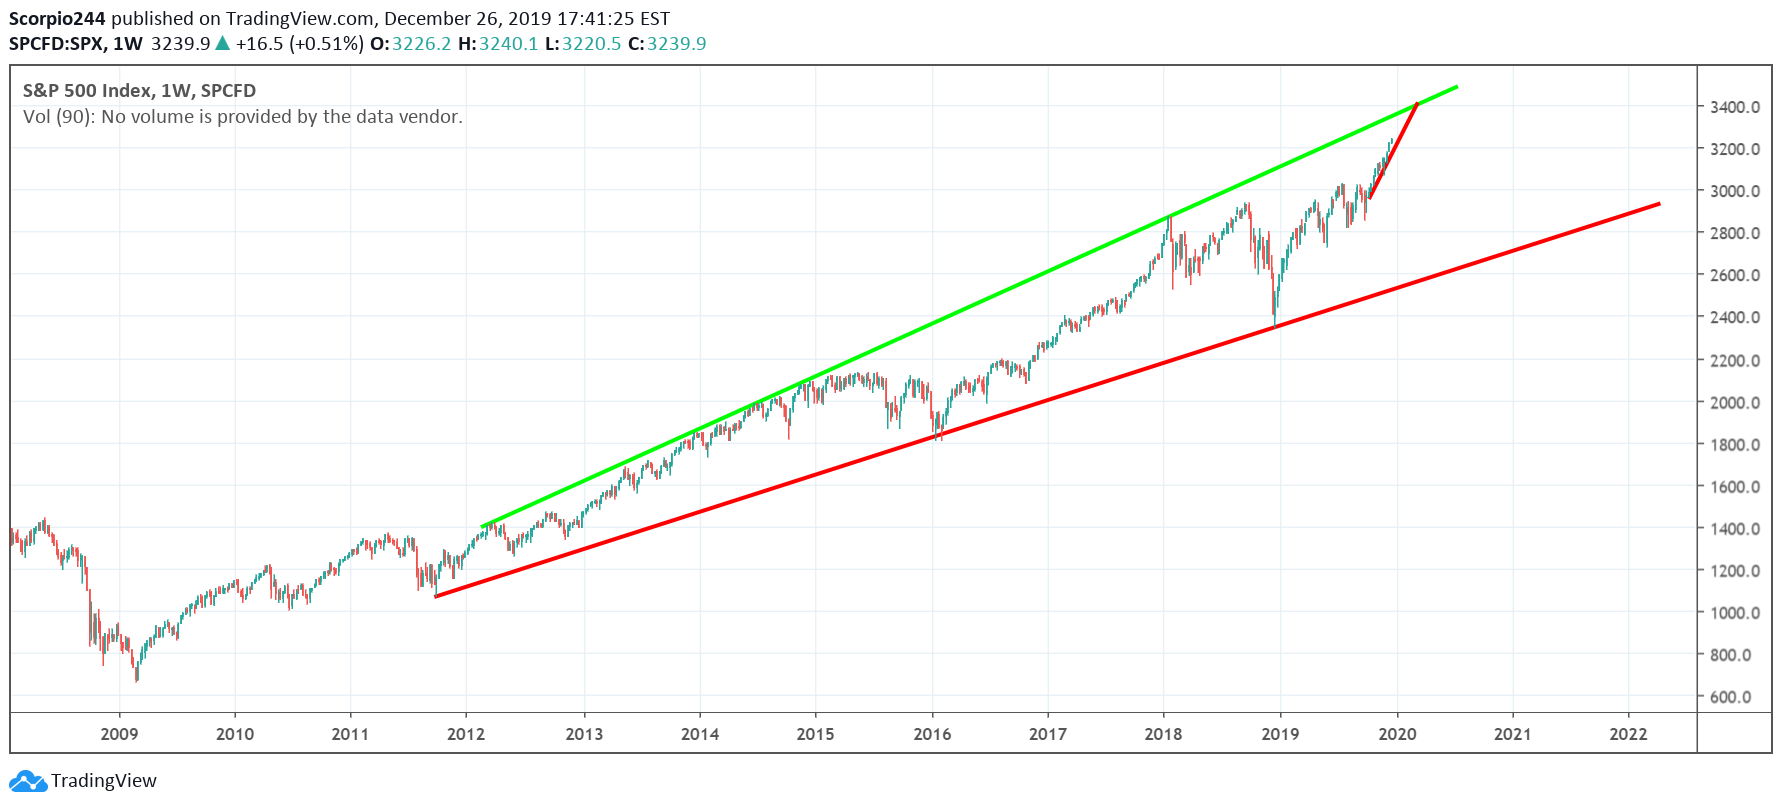
However, here is a new thought. If we are entering a period like I think we are beginning, which is the eventual rise to around 3,600 on the S&P 500, the path the market is likely to take becomes more linear, and that means pullbacks, and the sharp, and violent moves of the past will dissipate. It means pullbacks will be short-lived and in the 2-3% range, and not in the 8-10% range. It will be something that resembles 2017, with no 10% correction, or perhaps a period like 2012 to 2015.
S&P 500 Weekly Chart

When looking at the chart, it seems apparent that the S&P 500 has only one thing in mind, and that is to rise to 3,400.

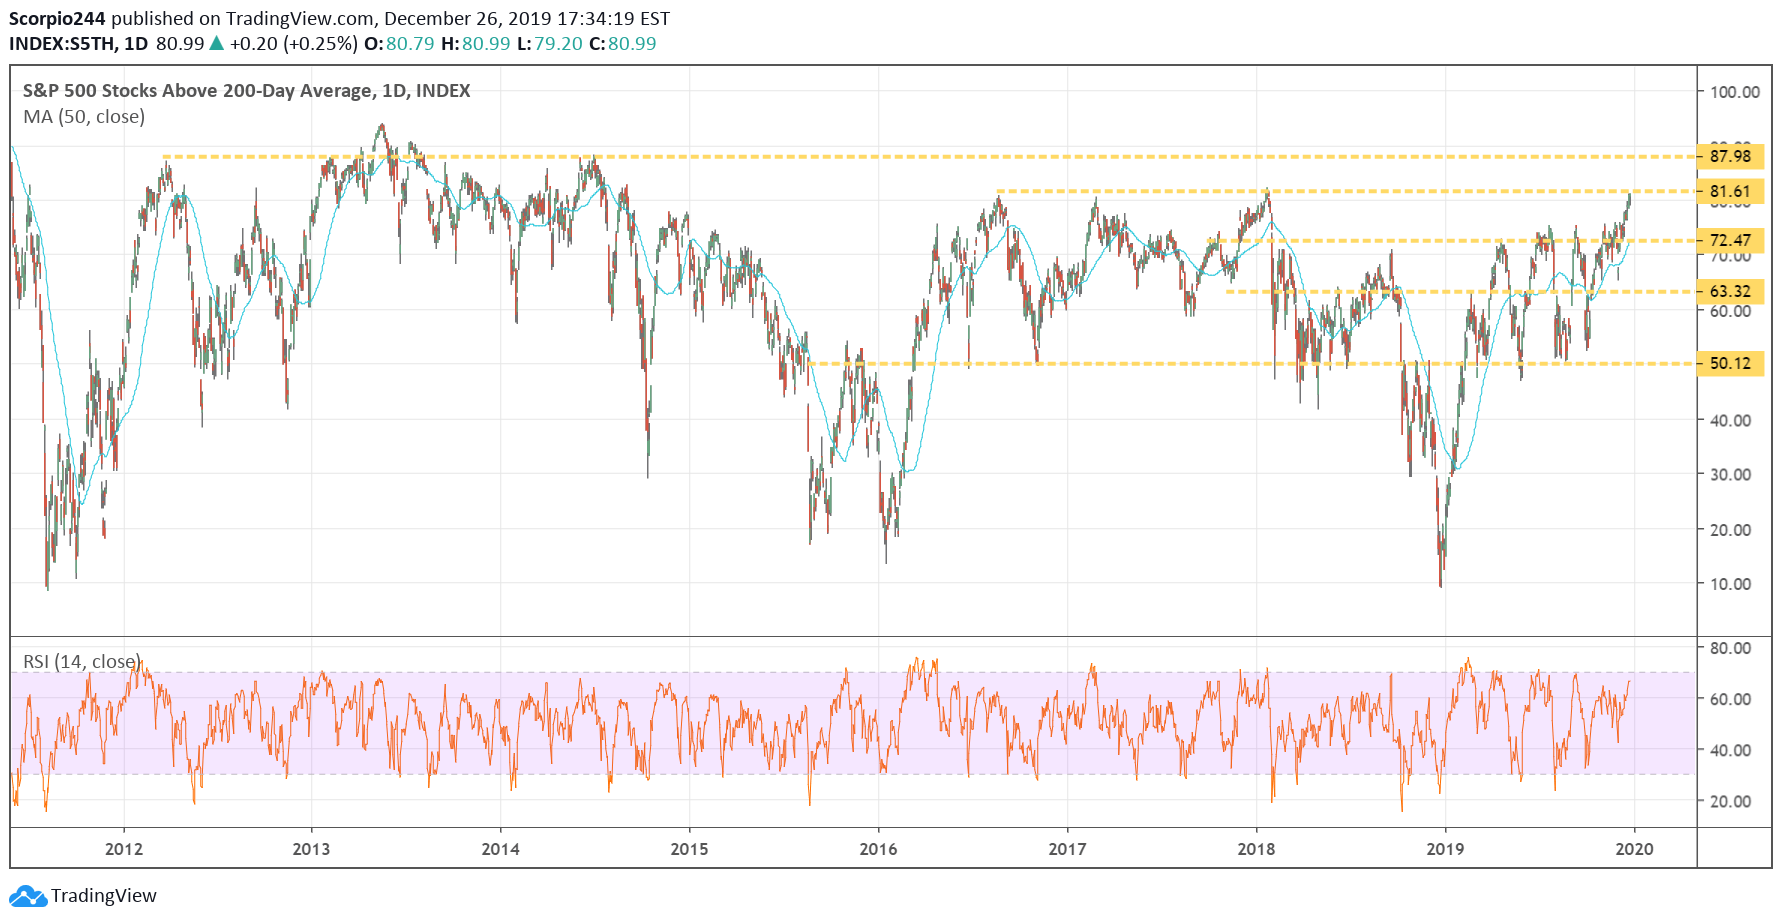
It also means that the number of stock trading above their 50 and 200 day moving averages will remain more elevated as well, where they peak around 88 to 90%. What it means is that the market may still have much further to rise and that a pullback may merely not becoming.
S&P 500 Stocks Above 200 Day Average Daily Chart

It means that the rally may simply carry into the start of 2020.

Apple

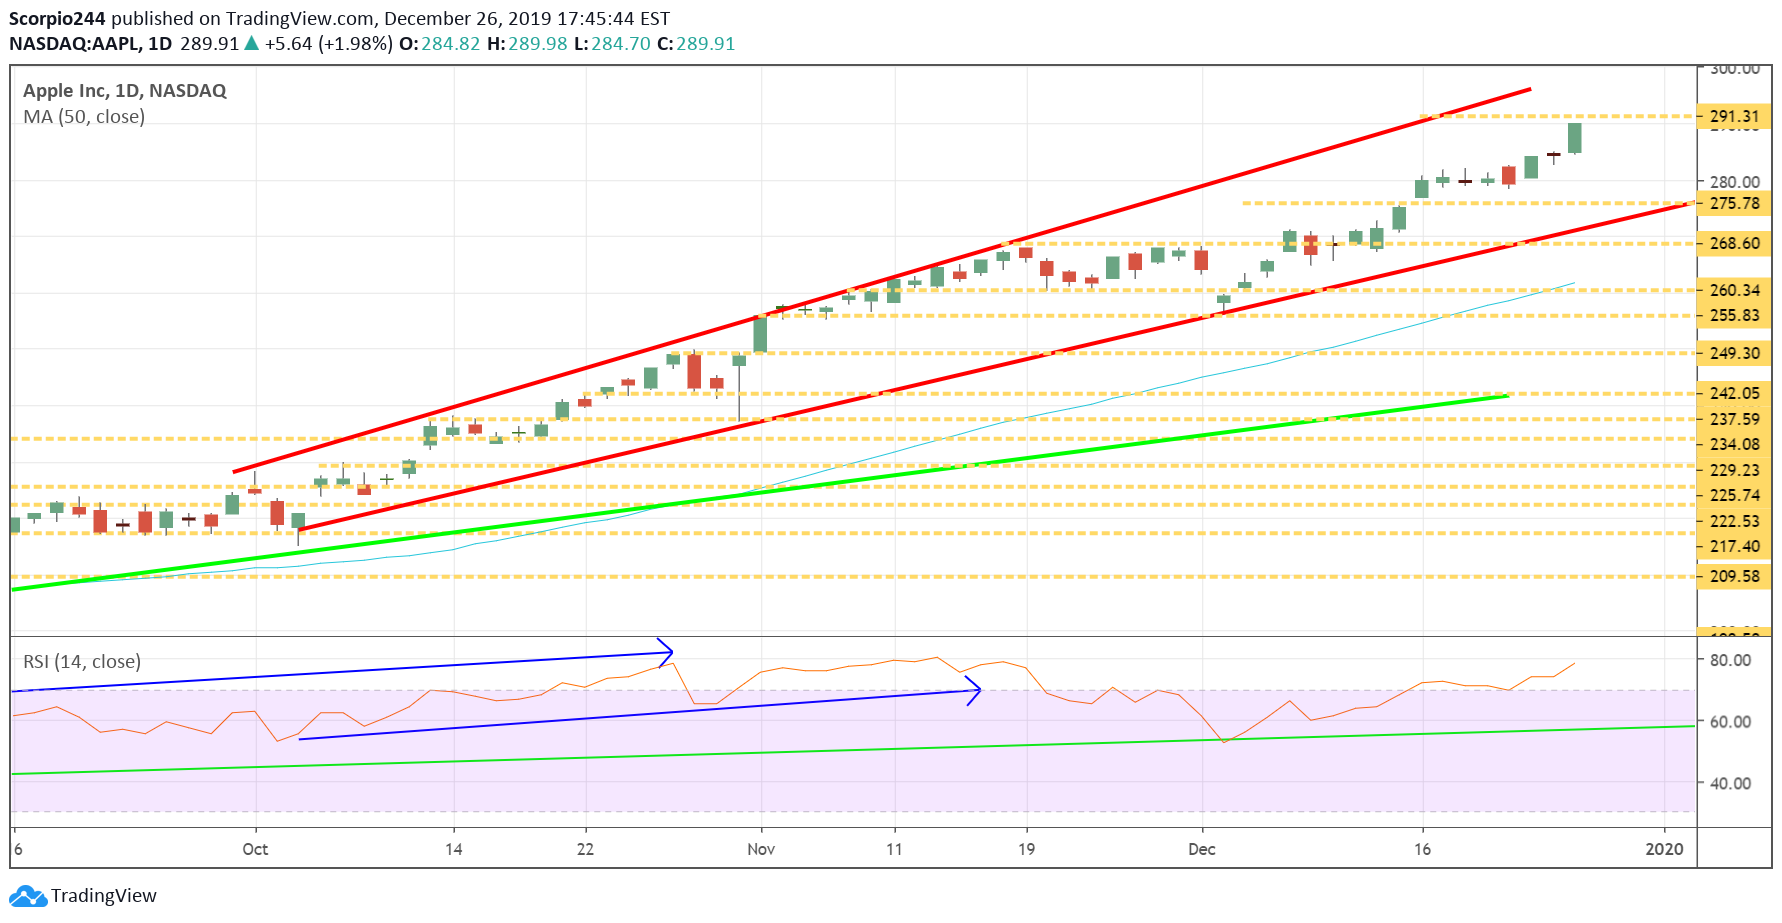
Apple (NASDAQ:AAPL) is up to $291, and I have no idea what happens now. I love the fact that the stock is going up, but it is not easy figuring out where it goes next. Based on the prior patterns, it would seem that Apple is due to consolidate now around this $291 region, meaning trade sideways.
Apple Inc Daily Chart

Citigroup

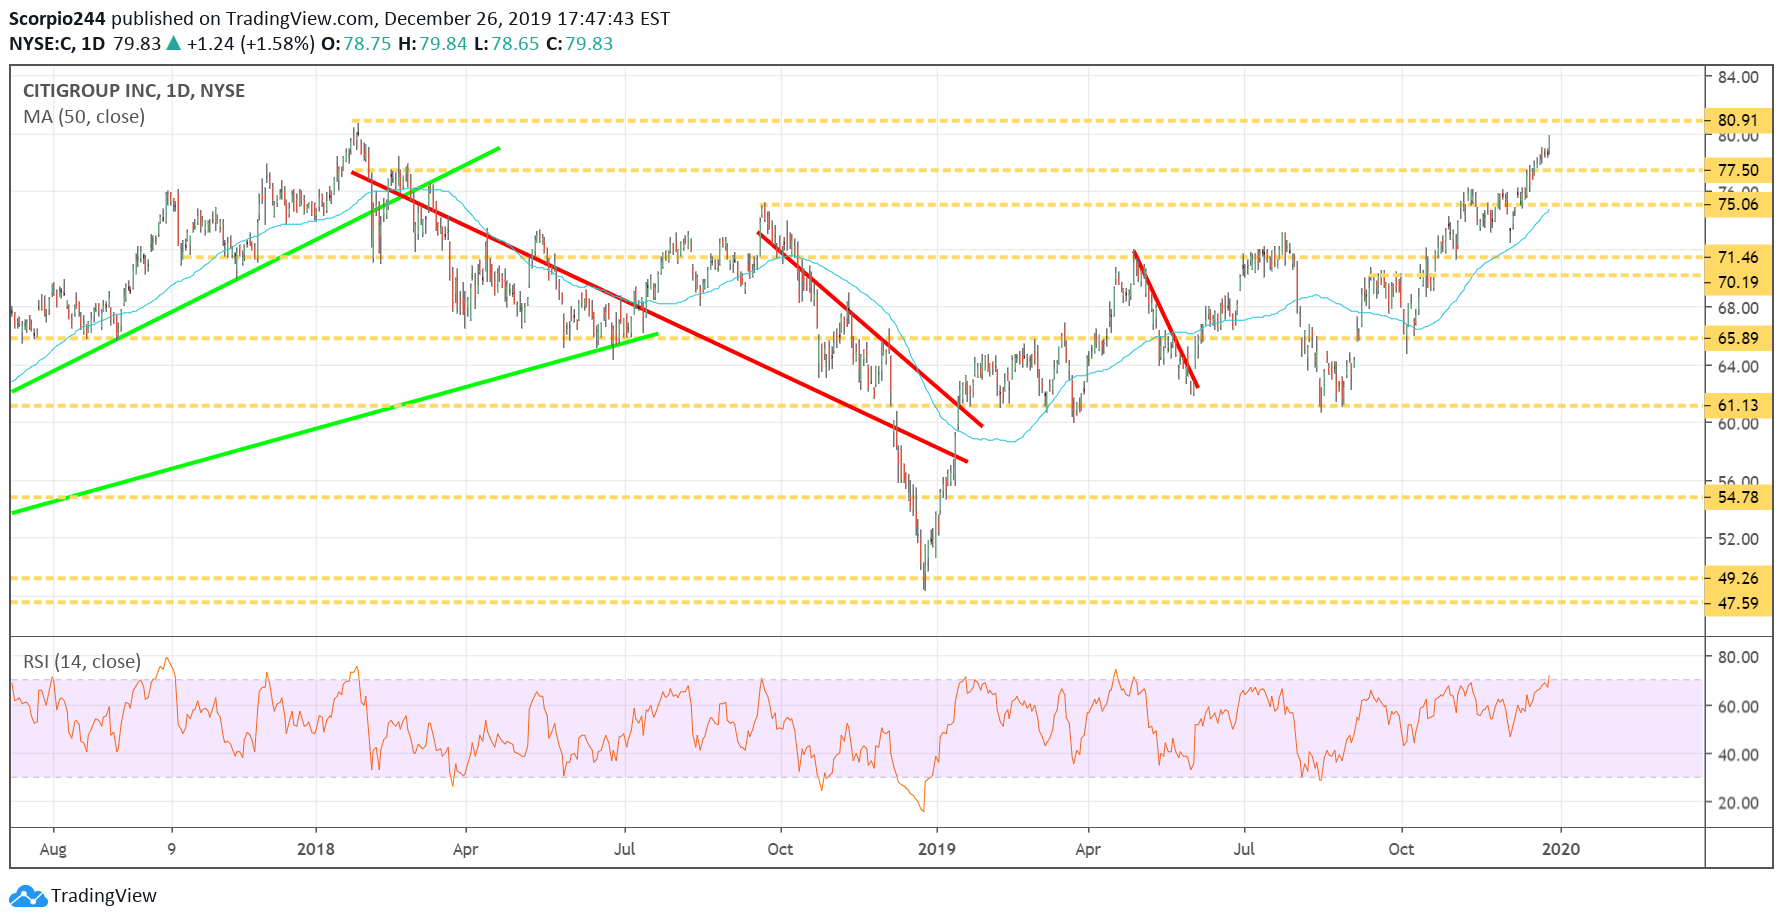
Citigroup (NYSE:C) appears to be heading towards $81.
Citigroup Daily Chart

Amazon

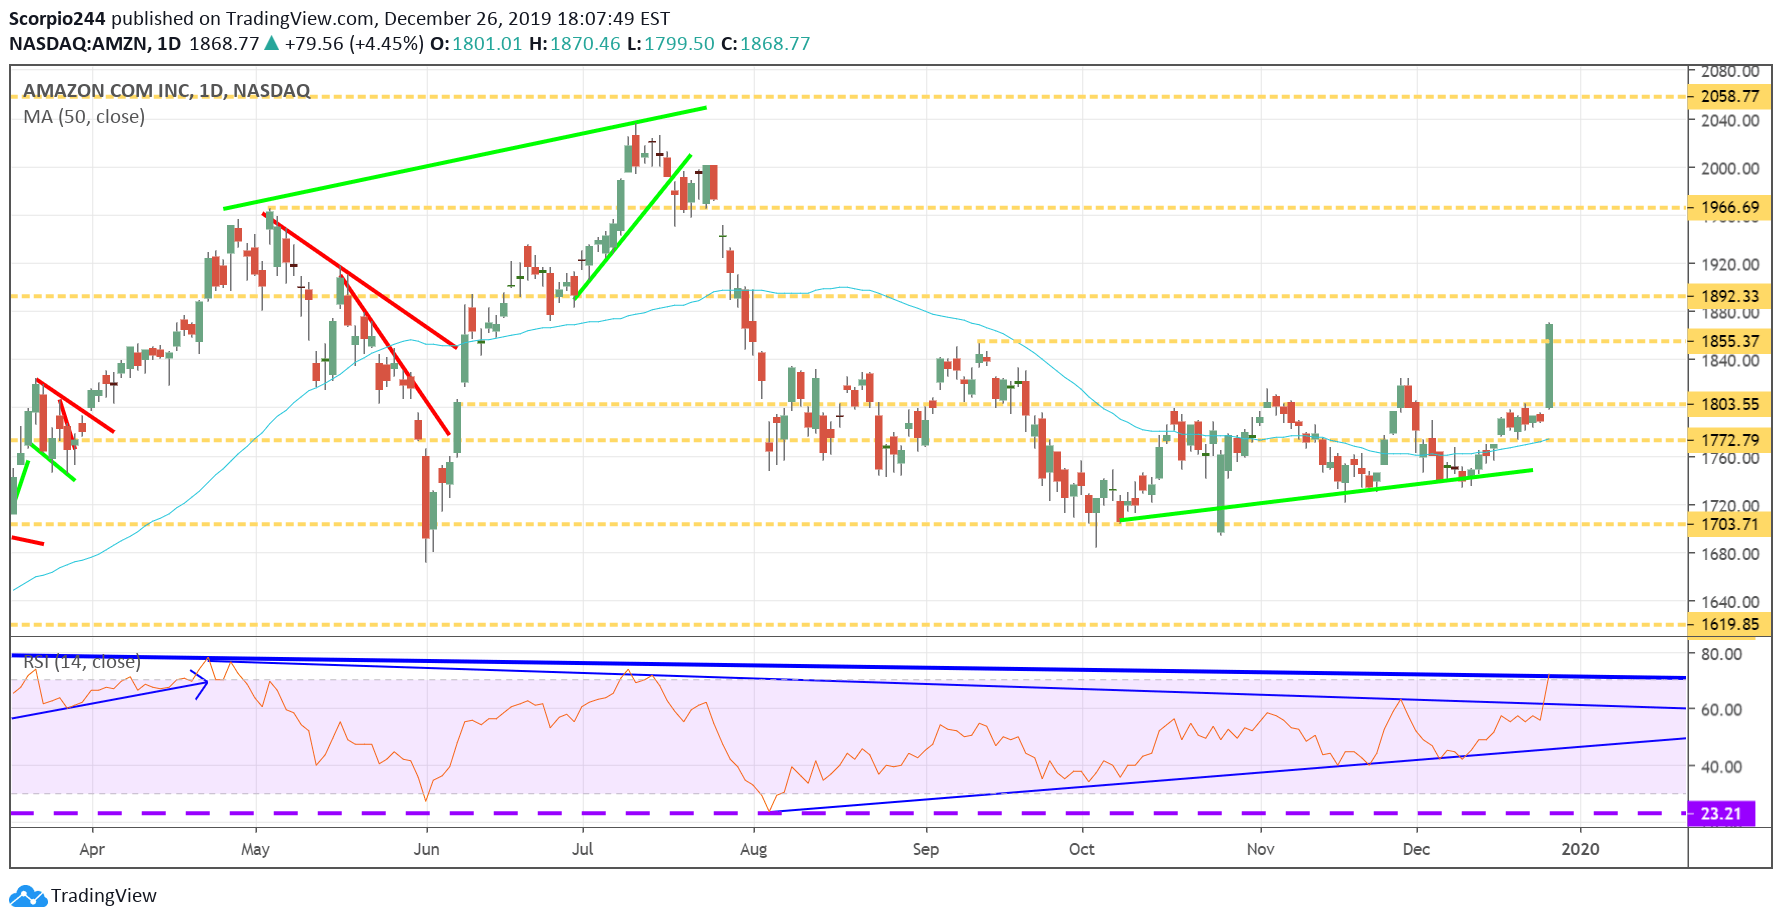
Amazon (NASDAQ:AMZN) rose sharply today, and that bullish option betting I saw a few weeks back appears to have been the correct bet. I wrote this on December 9 when the shares were $1750 – Amazon Is Seeing Bullish Betting, Suggesting 7% Increase
Amazon Inc Daily Chart

Netflix

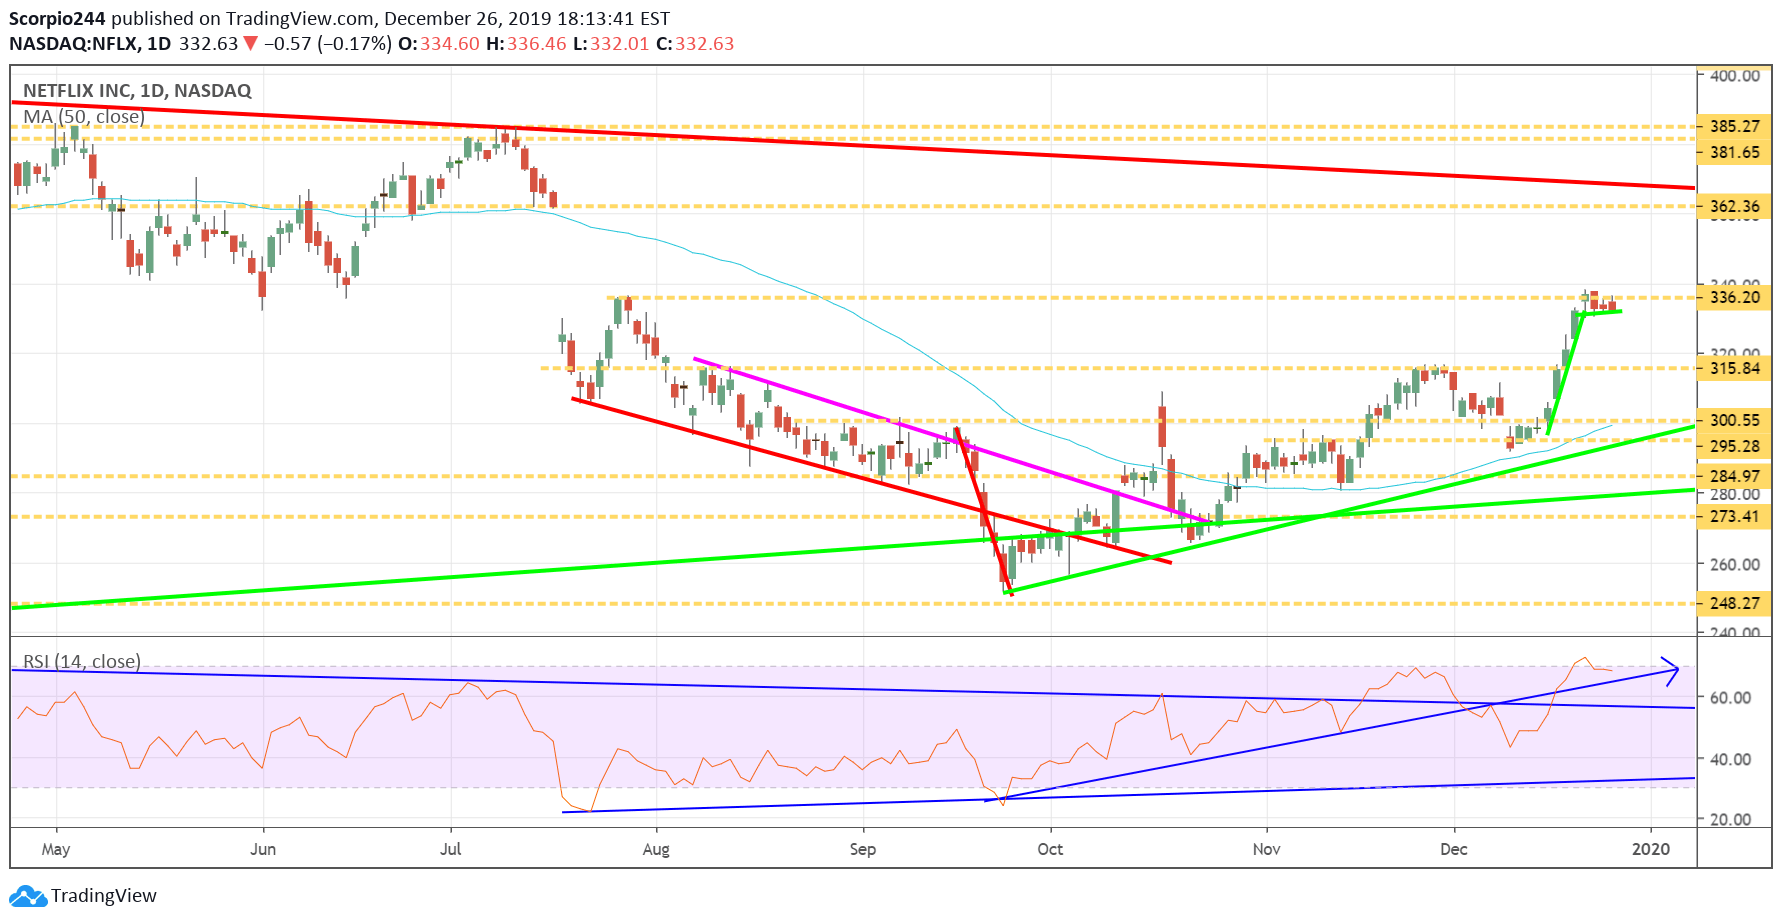
Netflix (NASDAQ:NFLX) has been consolidating around $336, and now it may be getting ready to make that push to $362.
Netflix Inc Daily Chart

Snap

Snap Inc Daily Chart

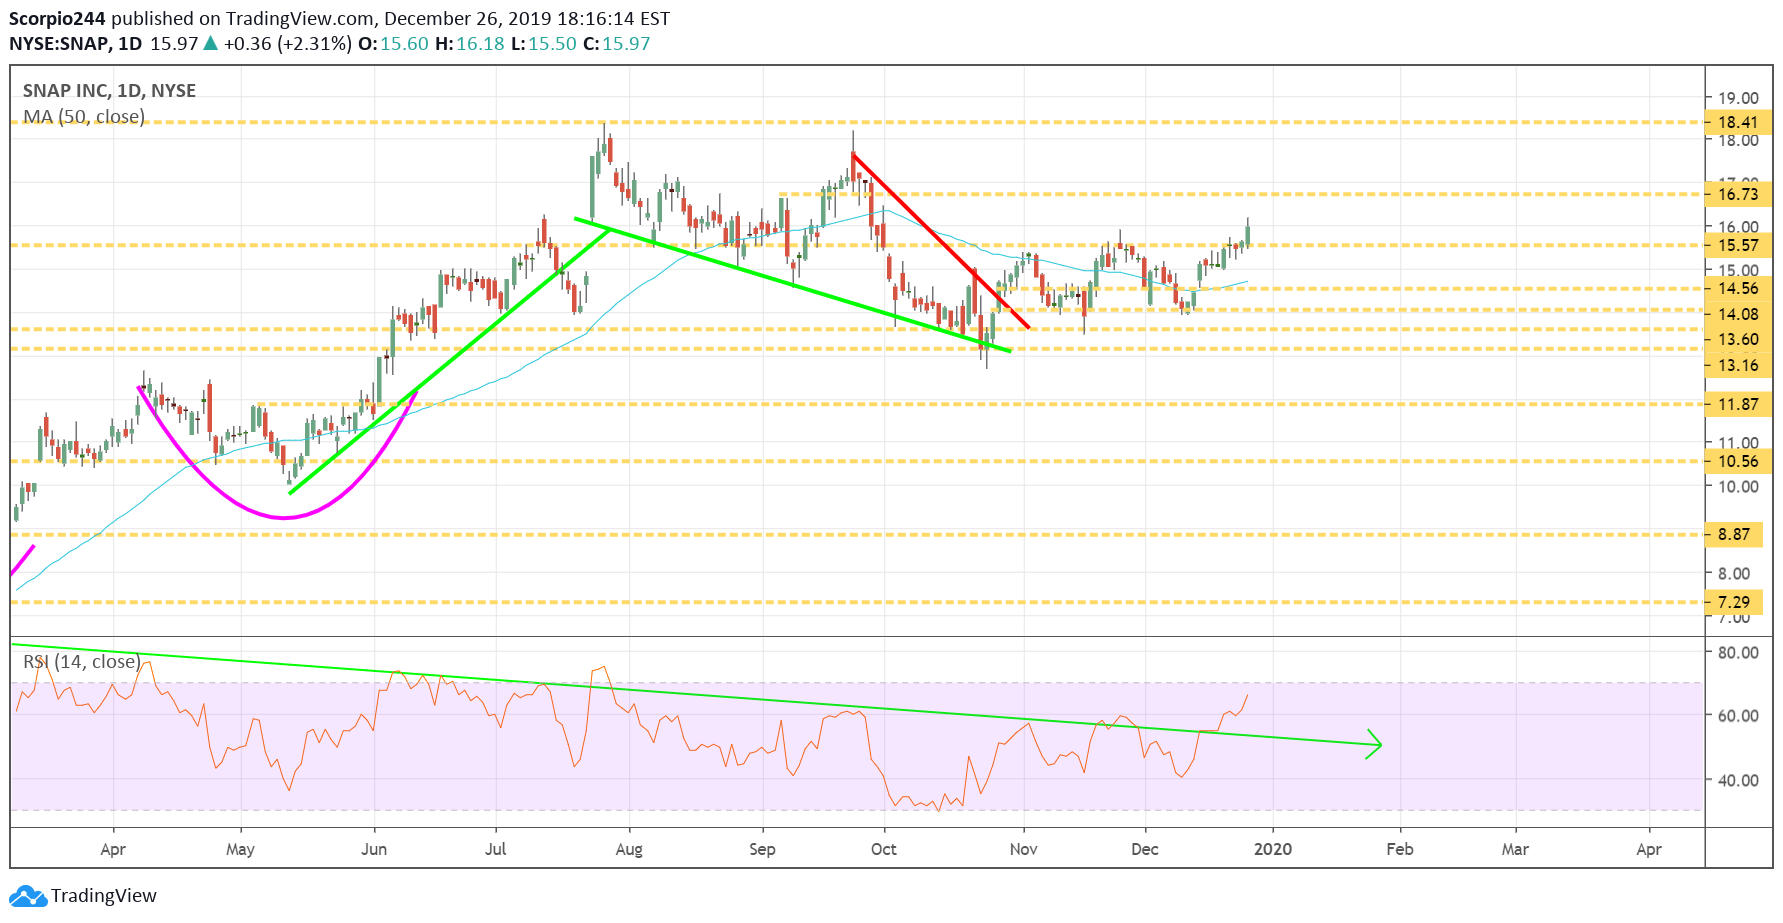
Snap (NYSE:SNAP) also had a good day rising above resistance at $15.50, and now the stock could be on a path to $16.75.

Original Post

Latest comments

Loading next article…
Risk Disclosure: Trading in financial instruments and/or cryptocurrencies involves high risks including the risk of losing some, or all, of your investment amount, and may not be suitable for all investors. Prices of cryptocurrencies are extremely volatile and may be affected by external factors such as financial, regulatory or political events. Trading on margin increases the financial risks.
Before deciding to trade in financial instrument or cryptocurrencies you should be fully informed of the risks and costs associated with trading the financial markets, carefully consider your investment objectives, level of experience, and risk appetite, and seek professional advice where needed.
Fusion Media would like to remind you that the data contained in this website is not necessarily real-time nor accurate. The data and prices on the website are not necessarily provided by any market or exchange, but may be provided by market makers, and so prices may not be accurate and may differ from the actual price at any given market, meaning prices are indicative and not appropriate for trading purposes. Fusion Media and any provider of the data contained in this website will not accept liability for any loss or damage as a result of your trading, or your reliance on the information contained within this website.
It is prohibited to use, store, reproduce, display, modify, transmit or distribute the data contained in this website without the explicit prior written permission of Fusion Media and/or the data provider. All intellectual property rights are reserved by the providers and/or the exchange providing the data contained in this website.
Fusion Media may be compensated by the advertisers that appear on the website, based on your interaction with the advertisements or advertisers.
© 2007-2025 - Fusion Media Limited. All Rights Reserved.