- Monitoring purposes SPX: Covered 6/13/16 at 2079.06 = gain .81%; Short SPX on 6/10/16 at 2096.07.
- Monitoring purposes Gold: Sold (NYSE:GDX) on 6/10/16 at 25.96 = gain 14.97%. Long GDX on 5/31/16 at 22.58.
- Long-Term Trend monitor purposes: Short SPX on 1/13/16 at 1890.28

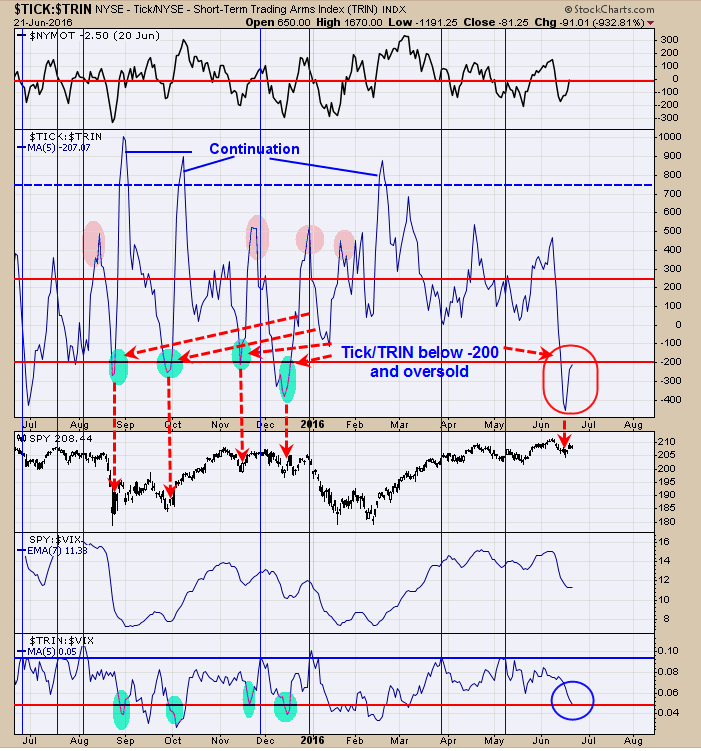
The middle window is the TICK/TRIN ratio with a 5-period moving average. This ratio hasn’t said much this year but it has now reached oversold levels suggesting there is support here at least short term. This indicator suggests the Gap near 210 on the (NYSE:SPY) will be tested and could even push higher than that. It appears the market will stay firm into the Brexit vote on Thursday.

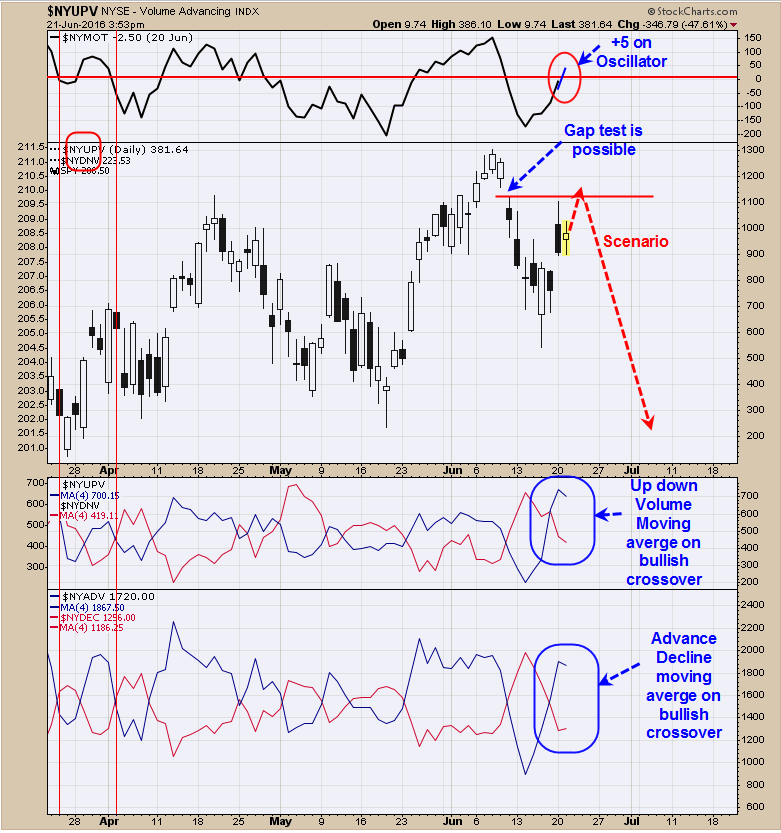
The top window is the McClellan Oscillator, which closed above “0” today and a short-term bullish sign. The vote on the Brexit is Thursday (not Wednesday like we said yesterday) and market could hold or work higher until then. A gap formed on June 10 and so far that gap has not been touched and is a likely upside target. If the gap is tested on lighter volume than that will imply resistance and if tested on higher volume will suggests market may move through the gap resistance. Both the Up volume/Down volume Moving average and Advancing/Declining Moving average remain on a bullish crossover and keeps the short term trend bullish for now. If this larger pattern is a “Three Drive to Top”, it has a downside target near 202 on the SPY.

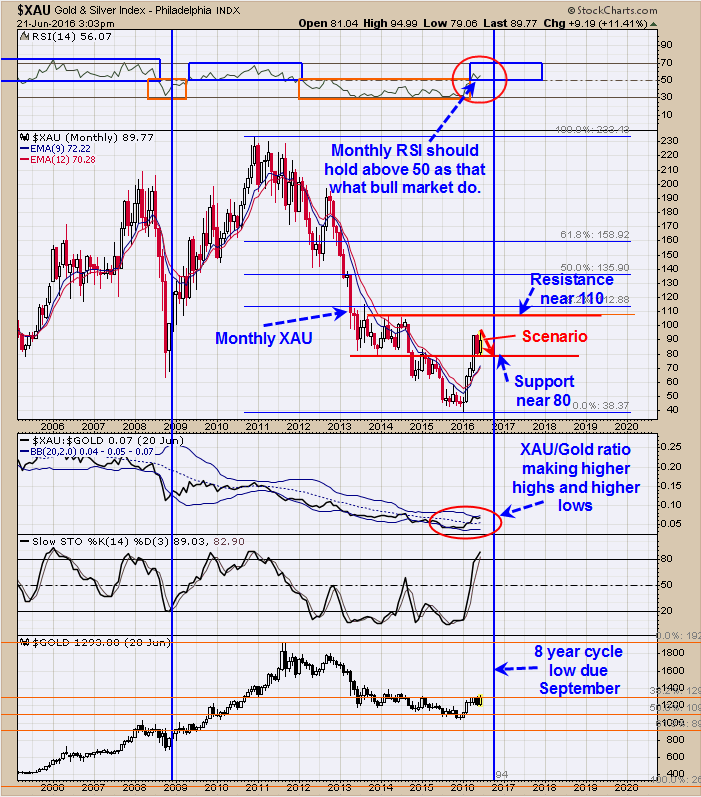
Above is the monthly XAU chart going back to 1999. The top window is the monthly RSI for the XAU. In bull markets the XAU stays above 50 and in bear market, stays below 50. When the market transition from bearish to bullish the RSI will surge and hold above the 50 level which it did in April. The monthly XAU jumped above the late 2014 and early 2015 high near 80 and that area should not act as support on pull backs. Resistance lines near 210 which is near the late 2013 and early 2014 highs. The blue vertical lines are the 8 year cycle low which the next one up is in September. It appears the major low occurred in January of this year and the 8 year cycle low due in September most likely will be a higher low. XAU has had a good run from the January low and what may come next is a trading range that could last into the 8 year cycle low due in September. The 8 year cycle can arrive early or late by a couple of months and not be “off the mark” as this is such a large time frame. The Brexit vote on Thursday could produce short term volatility; we will set on our hands for now.
Sold GDX on 6/10/16 at 25.96 = Gain 14.97.
