Recapping key takeaways from our last post during middle of February, we described oversold conditions in global stocks with extreme readings in sentiment and breadth. We stated that “even during strong downtrends and powerful bear markets, such selling pressure cannot last indefinitely without a relief rally to work off oversold conditions.” We went on to say that it was important to “monitor the recent stock market rebound, and how it behaves in days and weeks ahead. When coming out of extreme pessimism and oversold conditions… a strong follow through usually (but not always) indicates positive performance for the medium term as well.”
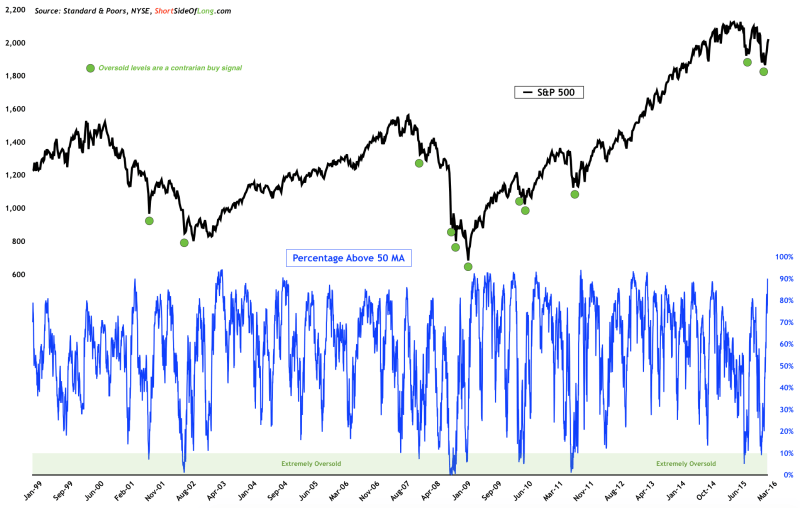
US equities did not rollover after an oversold bounce and displayed decently strong follow through off the lows, while credit risk and volatility declined. Short term market breadth, measured by the percentage of S&P components trading above their respective 50 day moving averages, is currently at its highest readings since late 2014. Furthermore, relative strength of equal weighted S&P 500 versus its classic index counterpart is currently outperforming. Basically, there is a lot more breadth participation on this move, as opposed to the one we saw in October 2015.
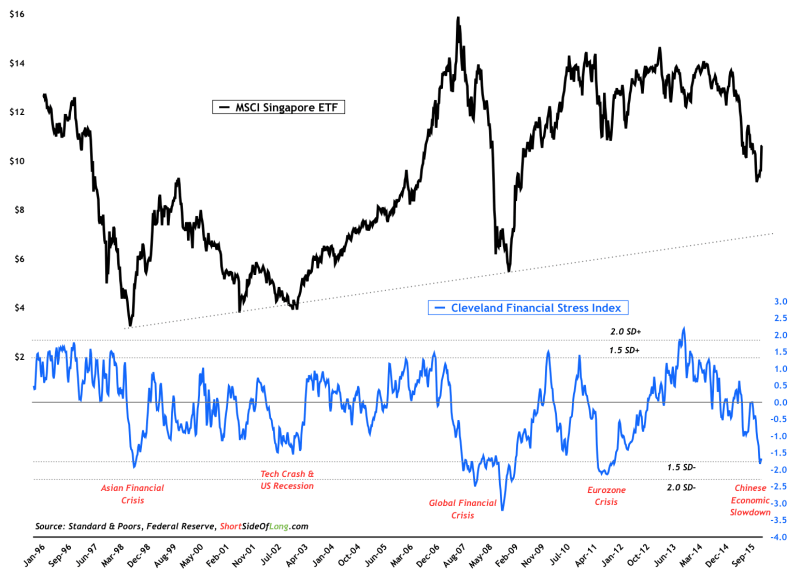
While the correction looks rather shallow in the US, I pointed out in previous posts that majority of the equity price declines were felt across emerging economies, and Asia in particular. China, Japan, Australia, South Korea, Hong Kong and Singapore (MSCI Asia Pacific components), experienced high financial stress and much stronger sell offs. Obviously, the economic activity of these countries has closer ties towards the slowing Chinese growth engine. While Asian valuations are rather attractive (consider that during January lows HK and Singapore traded at or below book value with attractive dividend yields), it will be difficult for these indices to push higher unless the S&P 500 returns into an uptrend (its currently testing the 200 day moving average resistance).
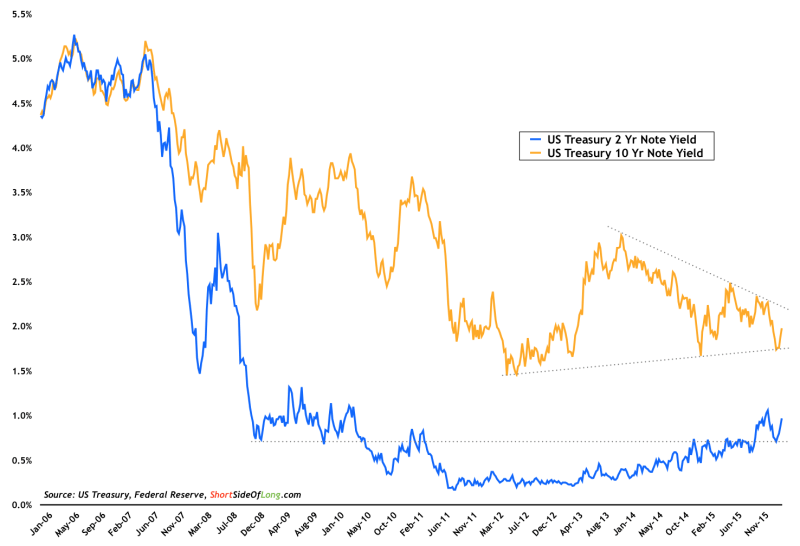
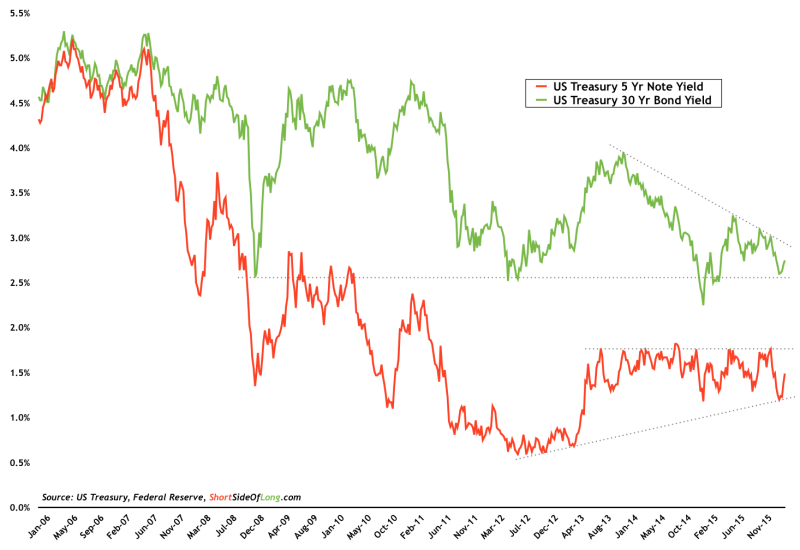
Risk taking over the last four weeks has pushed Treasury yields higher. All matures look very interesting from their current trend perspectives, with the overall Treasury bond market continuing to signal a flattening yield curve. The first chart above looks at 2s and 10s, while the second chart focuses on 5s and 30s. Here are a few observations, however I am sure you will be able to make many more yourself:
- 30 Year Long Bond was the only maturity to post a new interest rate lows in early 2015, while the rest of the yield curve bottomed around the Eurozone Debt Crisis inflection point (Draghi’s “whatever it takes” speech in middle of 2012)
- 10-Year Note has been triangulating for years now, showing indecision between bulls and bears with yields posting lower highs and higher lows
- Federals Reserves desire to get out of the zero bound range continues to put pressure on the front end of the yield curve, with the 2 Year Note rebounding strongly in recent weeks, as market prices a 75% chance of at least one rate hike in 2016
- 5 Year Note remains the most interesting of all maturities to me, with clear defined levels of risk linked to resistance around 1.8% and support around 1.2% yield
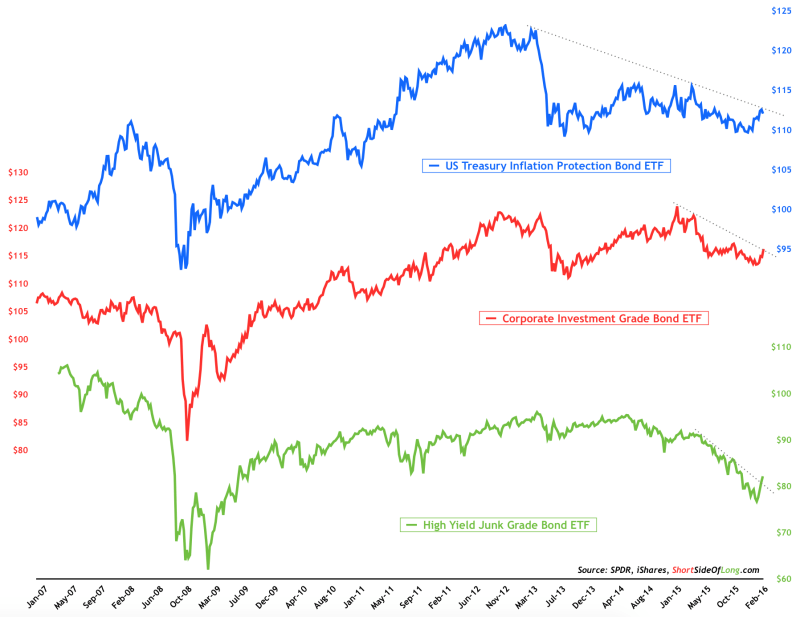
Since at least middle of 2014, a major headwind for the corporate bond market has been the widening spreads and rising default risk in the energy and mining junk debt. It seems we have now past through an important infection point, with commodity prices showing early signs of a bottom (more on this in the next post). In turn, this is helping to calm junk bond investors nerves and potentially revive appetite for Treasury Inflation Protection securities.
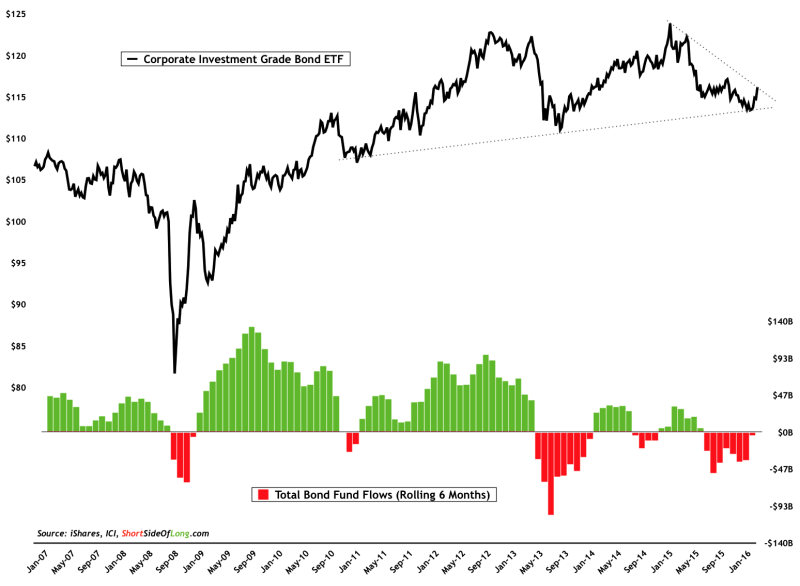
Furthermore, narrowing investment grade spreads are partly attributed to the recent shift in ECB policy to start purchasing debt of non-financial corporates, and partly attributed to Federal Reserve’s likelihood of slower interest rate tightening. From a contrary point of view, investors who purchased high quality corporate bonds at the beginning of the year, just as majority were selling (fund outflows), could be rewarded with a potential technical breakout on the upside.
A reader asked me which asset could surprise on the upside in 2016? Short answer is, all of them or non of them. Timing asset markets over the short term is extremely difficult, and sometimes I think to myself that we all have a better chance of guessing whether it will rain tomorrow. Nevertheless, I thought this was an interesting question and my pick would be depressed and oversold Agriculture Index, and in particular the grains sector.
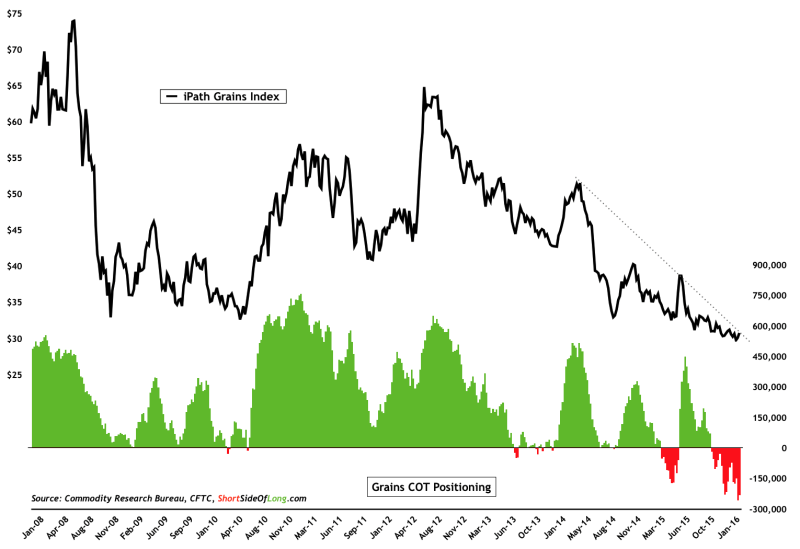
Hedge funds and other speculators hold extreme net shorts positions, betting on further price declines. My advice is that contrarians amongst us should summon courage and go the other way. The catalyst will most likely be the rapid temperature change, which occurs when a powerful El Nino (like we have today) swings sharply towards La Nina. Students of history should be able to recall that this type of dramatic change in temperature has occurred at least 9 times in the last five decades. And more importantly, out of 9 instances, all but one lead to a major rally in the grains market. This would be yet another reason why Inflation Linked Bonds might break out on the upside.
This coming weekend I shall be visiting the fabulous Singapore (its asset classes such as stocks and real estate are not performing so fabulous these days). Those who would like to catch up for a nice conversation over a coffee or another more fancy beverage, please do not hesitate to email me. Finally, I would like to wish all of you a very prosperous March, and to female readers of my bog, belated warm wishes for the International Women’s Day (which happened on 08th of March).
