According to Jay Powell, Chairman of the Federal Reserve, the U.S. economy is performing well. It is difficult to take the assessment seriously.
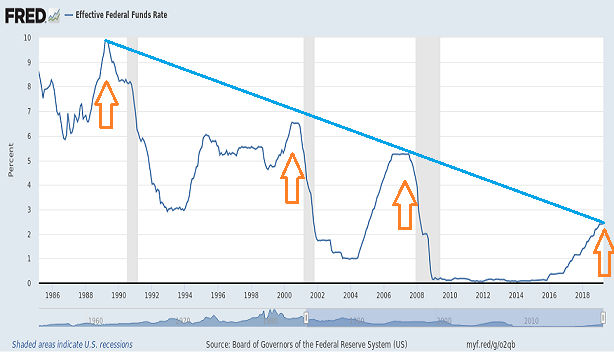
After all, as recently as mid-December, the Fed intended to raise interest rates three to four times in 2019. By January, central bank committee members wiped away the possibility of any rate hikes during the year. And now? The Fed is preparing the world for rate cuts as soon as July.
“We will act as needed including promptly if that’s appropriate and use our tools to sustain the expansion,” Powell uttered on Wednesday.
Is rate slashing monetary stimulus ever necessary when an economy is strong? When large-cap stock barometers are reaching all-time highs?
In truth, the economy is not hunky-dory. What’s more, large-cap U.S. stock indicators are misleading.
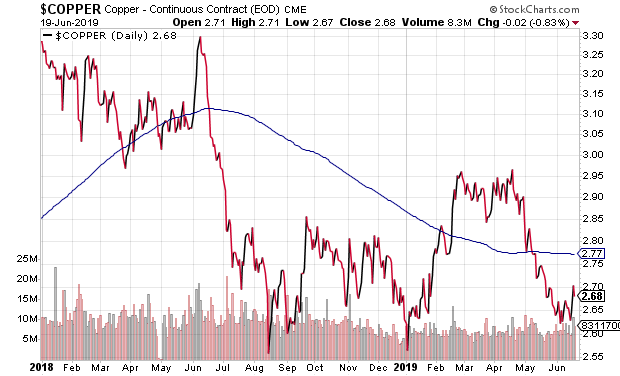
Let’s start with the economic backdrop by checking in on a variety of leading indicators. For example, the demand for copper is a leading indicator of economic well-being because of its extensive applications. Power generation, electronics, factories, homes — you name it.
It follows that copper prices tend to rise when an economy is healthy. Yet, prices of the industrial metal tend to fall when an economy is struggling.
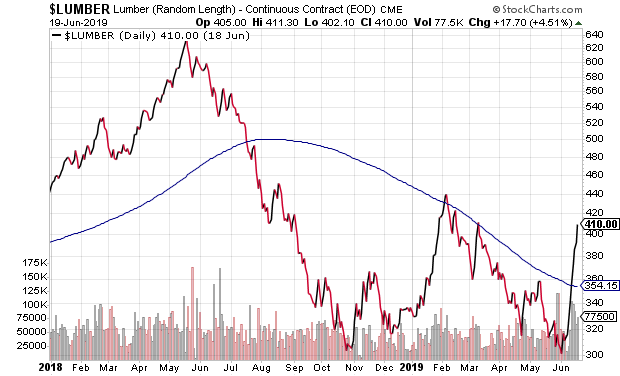
Another leading indicator is lumber. It is used in a variety of industries and it is particularly telling with respect to home construction.
A recent rate-related bounce notwithstanding, lumber has been lumbering. The slope of the longer-term downtrend remains intact.
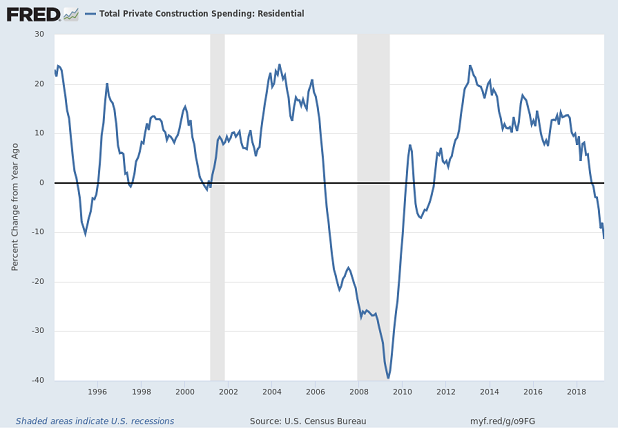
Speaking of construction, residential private construction spending is down more than 10% on a year-over-year basis. Contraction in this segment often precedes recessionary pressure in the economy at large.
What about the consumer? With traditional measures suggesting that the country is near “full employment,” shouldn’t employees continue to spend? Perhaps.
On the flip side, companies do not add to their human resources let alone maintain human resources levels when revenue stagnates and profits suffer. With U.S. public corporations deriving 40%-50% of their profits from overseas, how resilient would employment data remain if the world economy struggles?
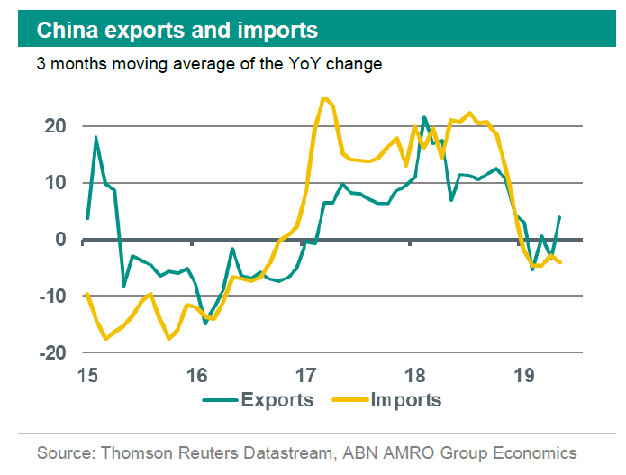
It is worth noting, then, that Chinese trade has screeched to a halt.
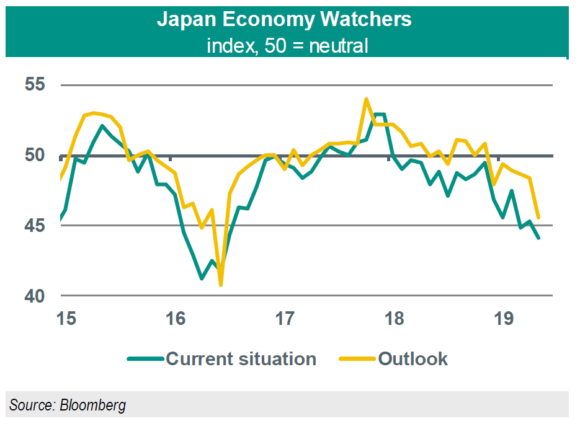
Meanwhile, analysts and economists polled in a monthly survey grow more and more negative about current conditions in Japan. Their outlook for Japan’s economic future is equally disturbing.
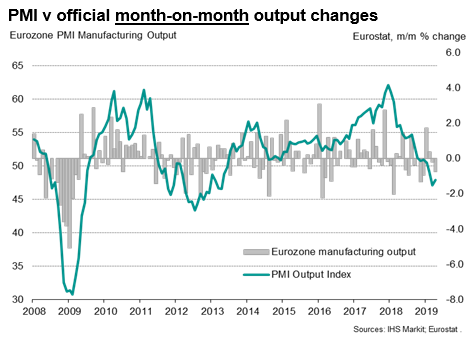
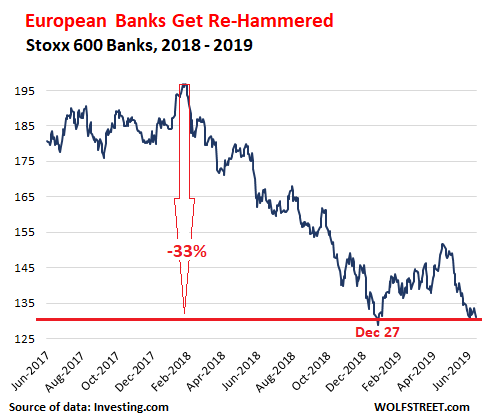
And Europe? The entire Eurozone is currently battling to keep its head above water. Worse yet, European banks may be coming unglued.
There’s more.
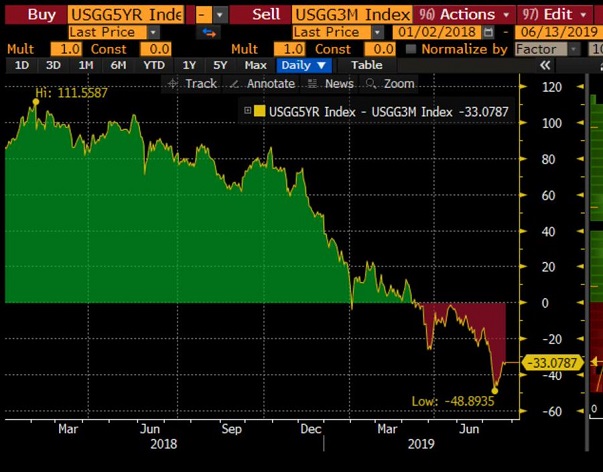
According to Samantha LaDuc at LaDuc Trading, the yield curve inversion between 5-year Treasuries and 3-3-month Treasuries has been in place for an entire quarter. As it turns out, the economist who tied inverted yield curves to recessions, Cam Harvey, focused his attention on three full months of inversion between the 5-year yield and the 3-month yield. So yeah… that’s happened.
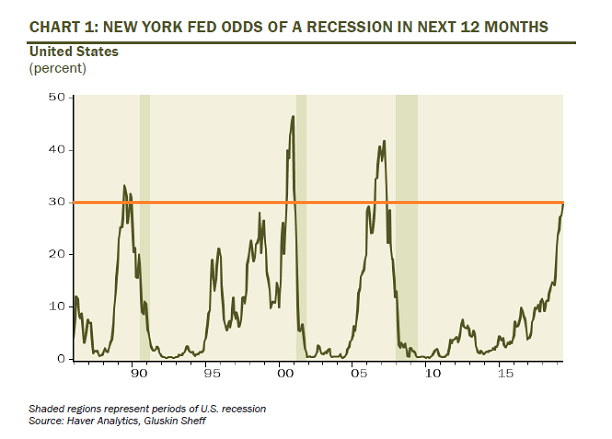
Keep in mind, Fed leaders are cognizant of the data. The New York Fed model for recession probability sits at levels not seen since 2007.
Not that anyone should anticipate honesty from Fed representatives. Still, claiming that the U.S. economy is strong plays better than expressing that the best days of the expansion are behind us. Using the media to push the notion of an “insurance rate cut” sounds better than acknowledging that the credit cycle is turning.
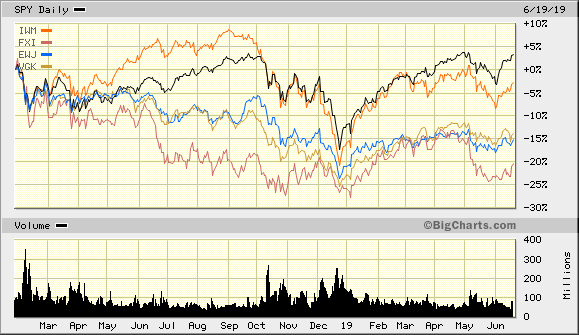
While it is true that large-cap stock barometers are pushing up against all-time records, few seem to recognize that other stock assets still remain below the peak set 17 months earlier (1/26/2018). Smaller-cap U.S. stocks, European stocks, Japanese stocks, Chinese stocks — the rest of the equity landscape is still trying to recover.
Let’s look at a variety of popular ETFs to illustrate the point. The S&P 500 SPDR Trust (SPY (NYSE:SPY)) is up marginally since the 2018 peak. In contrast, iShares Russell 2000 (IWM), Vanguard Europe (VGK), iShares Japan (EWJ), iShares China (FXI) and Vanguard Europe (VGK) are all negative across the17-month span.
Wouldn’t a “diversified portfolio” be more global? Almost every person believed so when it was advantageous from 2000-2009.
A global portfolio that represents 50% U.S equities and 50% foreign equities might be represented by iShares MSCI World (ACWI) or iShares Global 100 (IOO). Not a whole lot of progress in the 17 months since the January 2018 peak.
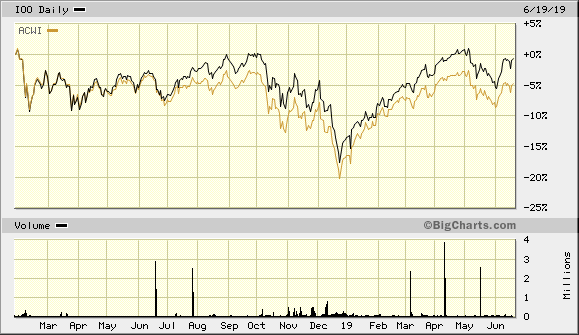
Even if one eschews foreign exposure altogether, few would dismiss the diversification element associated across small, mid-sized and large corporations. Even here, there has been negligible progress for U.S. stocks over the 17 months.
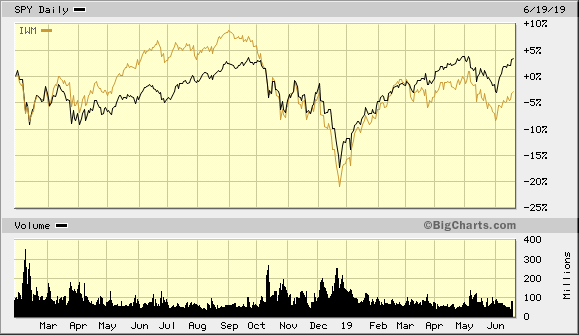
What we have seen in these 17 months, though, is a number of huge shifts in Fed policy. Tightening to neutrality. Then neutrality to easing (2nd half 2019). How else are they going to keep the wealth effect from unraveling?
We’ve even seen U.S. government bonds outperform the Wilshire 5000 Index Investment Fund (WFIVX) — a fund that tracks the capitalization-weighted index of the market value of ALL actively traded U.S.-headquartered stocks.
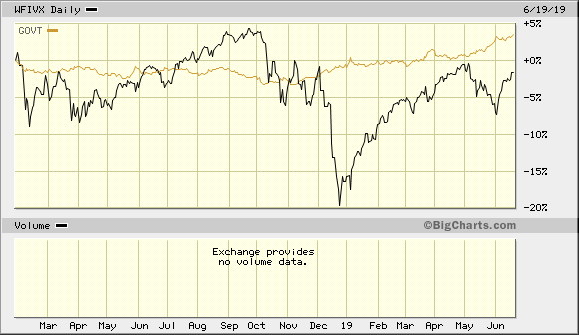
There are many who disagree with my insights. They have every right to do so.
That said, few debate the actual data that I regularly provide. Instead, with tremendous condescension, there are those who highlight the current price of U.S. large cap stocks as proof-positive that I am “wrong.”
(Of course, they tend to shrink sheepishly from comment streams during violent sell-offs like the one that occurred in the 4th quarter of 2018. And they disappeared entirely in 2008. Did they ever!)
What has been lost upon the condescending crowd? As well as the mainstream financial media? Less risky portfolios have outperformed heavy-stock portfolios for nearly a year-and-a-half.
If, for instance, one reduced diversified stock holdings at the start of 2018, and added to high quality bond holdings, the actions enhanced risk-adjusted performance and actual performance. That’s right. Selling some of SPY, IWM and ACWI at the start of 2018 and using the proceeds to to acquire funds like iShares US Core Treasury (GOVT), Vanguard Total Bond (BND) and iShares 20-Year-Plus Treasury (TLT) has provided better rewards with less risk.
For 100,000 readers across a variety of platforms, I have encouraged allocation shifts to less risky holdings. Am I “performing” as well as someone who has been 100% long the NASDAQ with no breaks? No, but I am doing just fine.
Still, if people want to run with the notion that the Fed can engineer the perfect soft landing for the U.S. economy, I am unlikely to persuade them otherwise. They’ve likely convinced themselves that lower interest rates imply that debt extremes do not matter and valuations are perfectly sane.
Who knows? Maybe they’re right and maybe I’m crazy.
