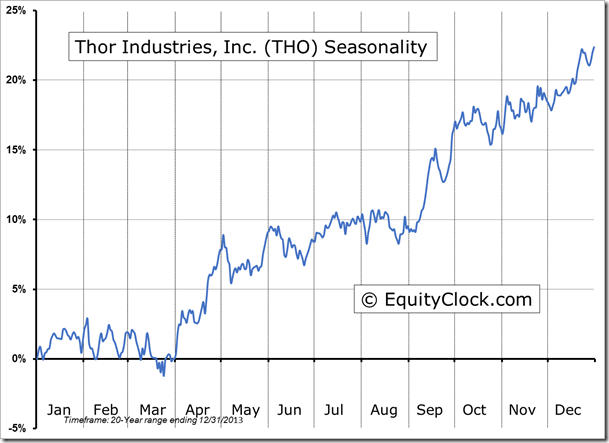
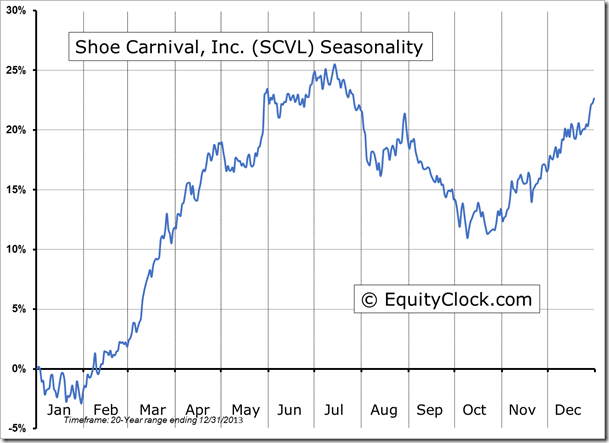
We are adding a section to the daily reports that details the stocks that are entering their period of seasonal strength, based on average historical start dates. Stocks highlighted are for information purposes only and should not be considered as advice to purchase or to sell mentioned securities. As always, the use of technical and fundamental analysis is encouraged in order to fine tune entry and exit points to average seasonal trends.
Stocks Entering Period of Seasonal Strength Today:
-
No stock identified for today.
The Markets
Stocks ended mixed on Friday in a low volume session as Americans continued to celebrate the US Thanksgiving holiday by spending time with loved ones (and unloved ones that happened to snatch the last door-crasher deal item at the local mall).
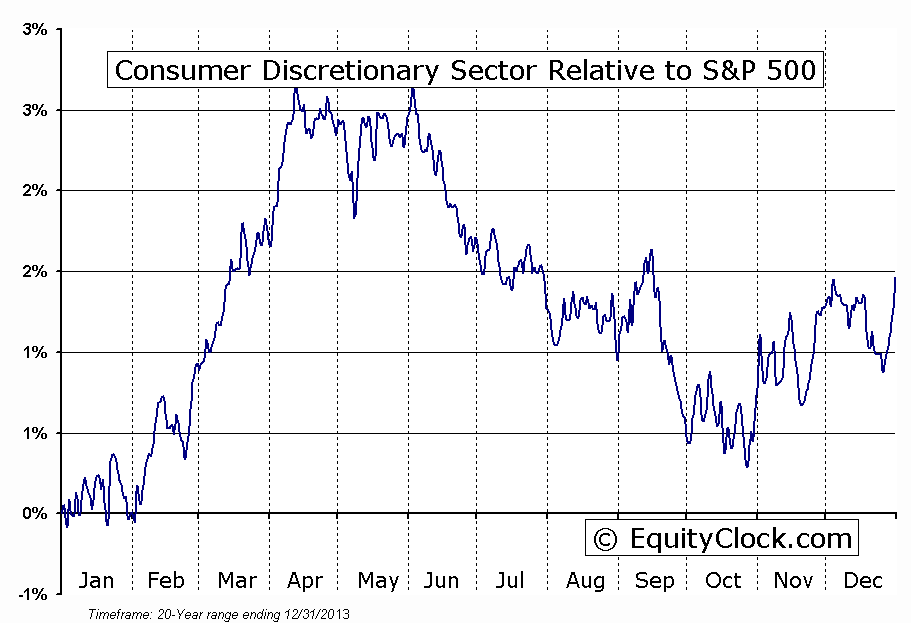
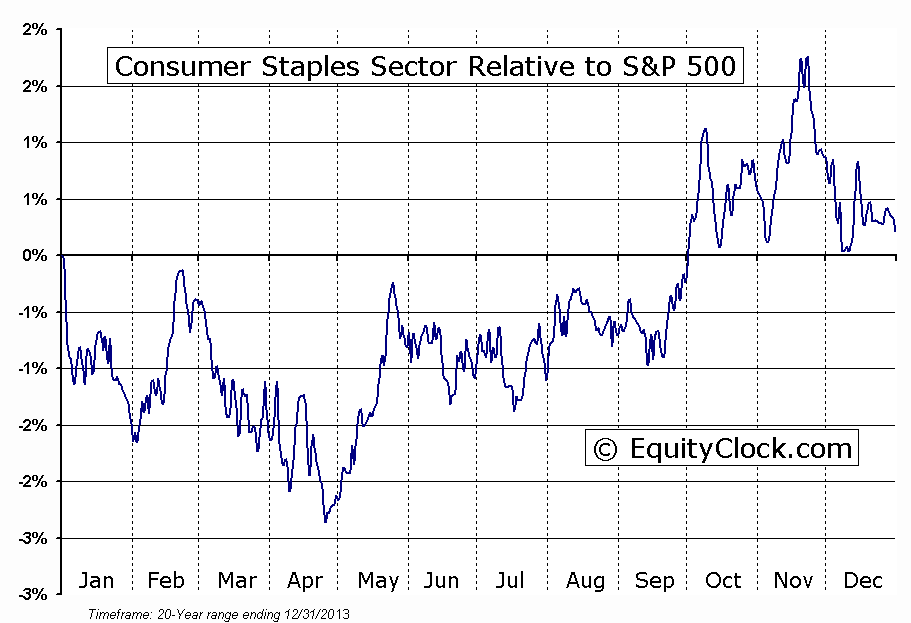
The session was dominated by two themes: consumer sector strength and energy sector weakness. The Consumer Discretionary and Consumer Staples sectors both gained over one percent on the day, topping the leaderboard and supporting the broad equity market that struggled under the weight of a commodity selloff. Anticipation of strong holiday sales continues to push these sectors further into overbought territory as the prospect of lower gas prices is expected to increase discretionary purchases.
Seasonally, consumer stocks can continue to gain through the end of the year, however, performance relative to the market typically becomes more erratic following the US Thanksgiving holiday as traders start to book profits during and after the Christmas holidays. Essentially, all of the good news is priced in as consumers wrestle over items in black Friday sales; stock prices turn volatile as the results of the spending event are released in a typical “buy the rumour, sell the news” scenario.
The trend for both the Consumer Discretionary ETF (SPDR Consumer Discretionary Select Sector (ARCA:XLY)) and the Consumer Staples ETF (SPDR - Consumer Staples (ARCA:XLP)), albeit overbought, remains firmly positive on a short, intermediate, and long-term timescale.
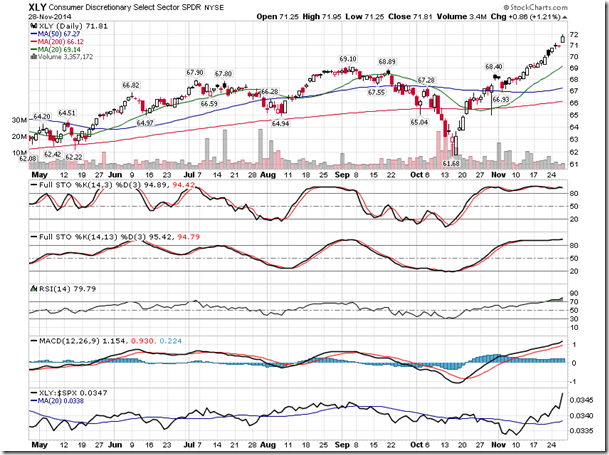
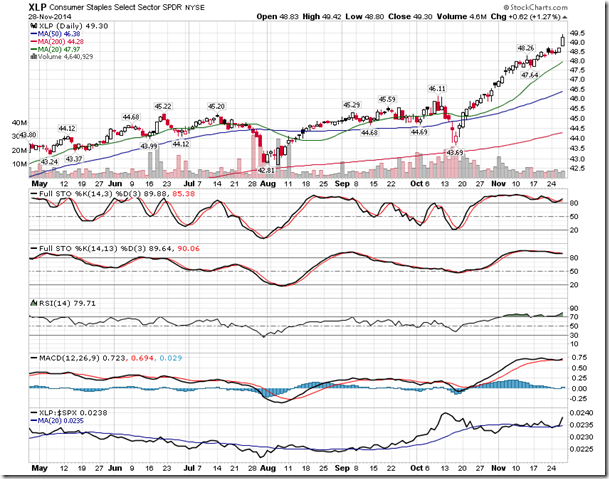
Despite the apparent strength of the consumer on an important shopping day in the US, the more significant event on Friday was the plunge in energy stocks, which reacted to OPEC’s decision to not cut oil production. The Energy Sector ETF (SPDR Energy Select Sector Fund (ARCA:XLE)) plunged 6.42%, recording the fourth largest negative divergence when compared with the daily return of the S&P 500 Index since the ETFs inception. The last significant divergence for energy stocks compared with the benchmark S&P 500 Index was on October 9th of 2008 in the midst of the significant market selloff related to the financial crisis.
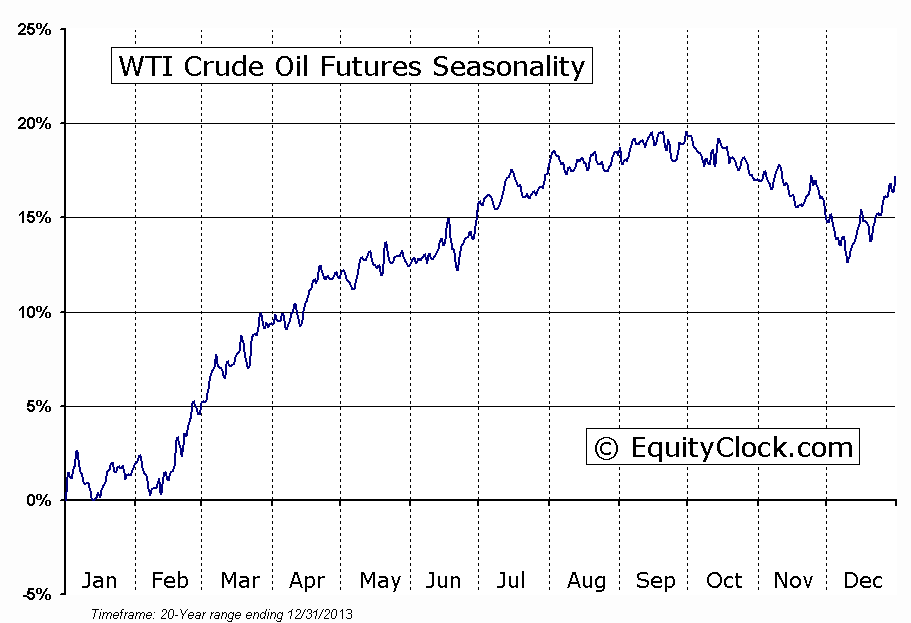
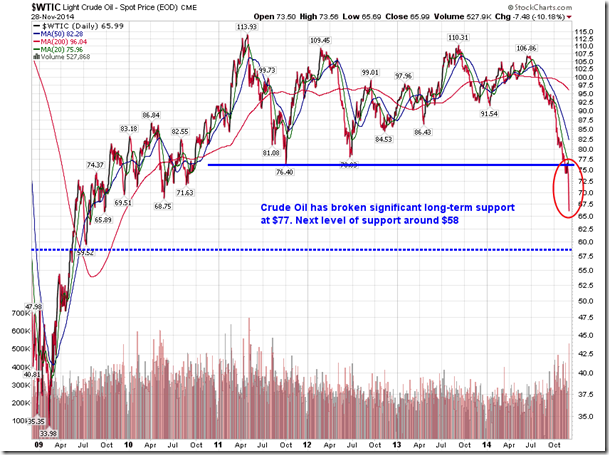
Of course, the significant weakness in Energy stocks follows the plunge in Oil prices, which declined by 10.18% on Friday, trading to the lowest level since 2009. The commodity has broken significant support around $77, sending it into a definitively negative trend and ending a range bound trade that spanned the last 5 years; the long-term trend is implied to be negative. On a positive note, the period of seasonal weakness for the commodity is quickly reaching a peak, bottoming by early to mid-December, on average.
The commodity tends to rise in the last three weeks of the year as negative bets are unwound. Oil then begins a period of seasonal strength in February, running through to the spring months as refiners switch production to meet the demands of the summer driving season. The price of Oil remains significantly oversold, suggesting downside pressures may be near exhaustion. Next level of potential support for the energy commodity is apparent at $58; upside resistance remains evident at the 20-day moving average at $75.96, a whopping 15.1% above present levels.
With a new month upon us, it is worthwhile to look at the returns for the equity market in this last month of the year. Following is an excerpt of our article published on Thursday in the Globe & Mail:
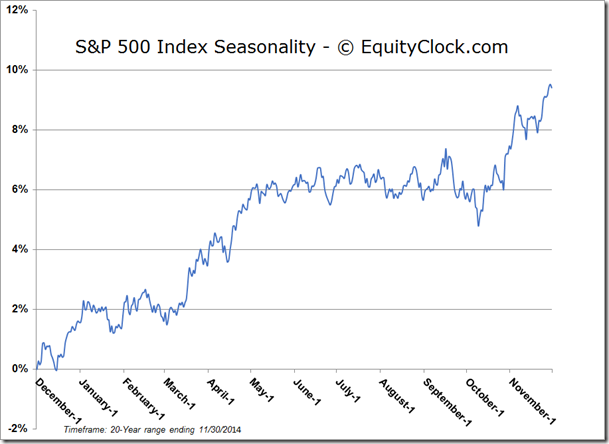
December historically has been a great month for equity markets. According to EquityClock.com, December has been the best performing month of the year for the S&P 500 Index during the past 63 years, both on a frequency and average return basis.
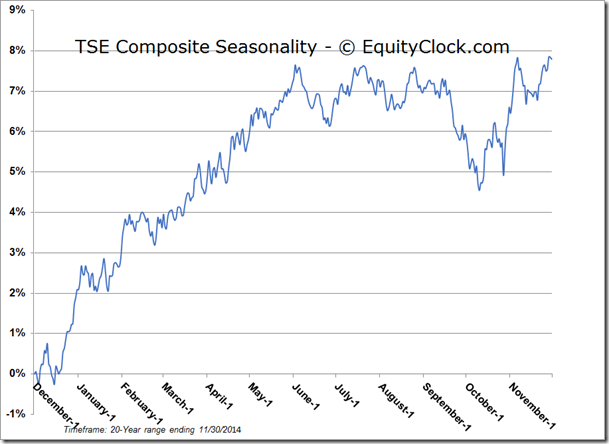
The benchmark has ended higher 76 per cent of the time, averaging a return per period of 1.7 per cent. December also has been the best performing month for the TSX Composite Index during the past 37 years. The Canadian benchmark gained in 86 per cent of the periods, returning an average of 2.2 per cent.
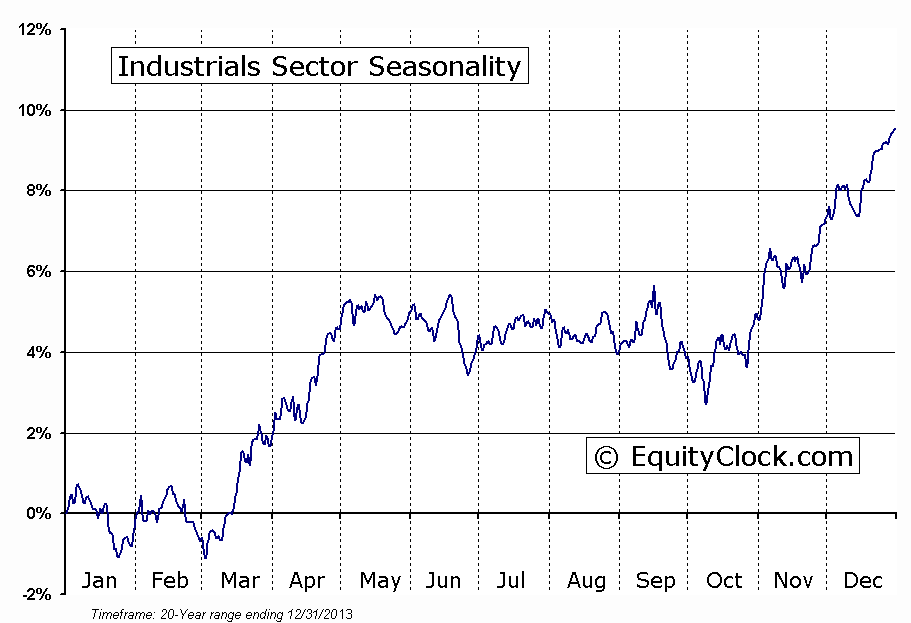
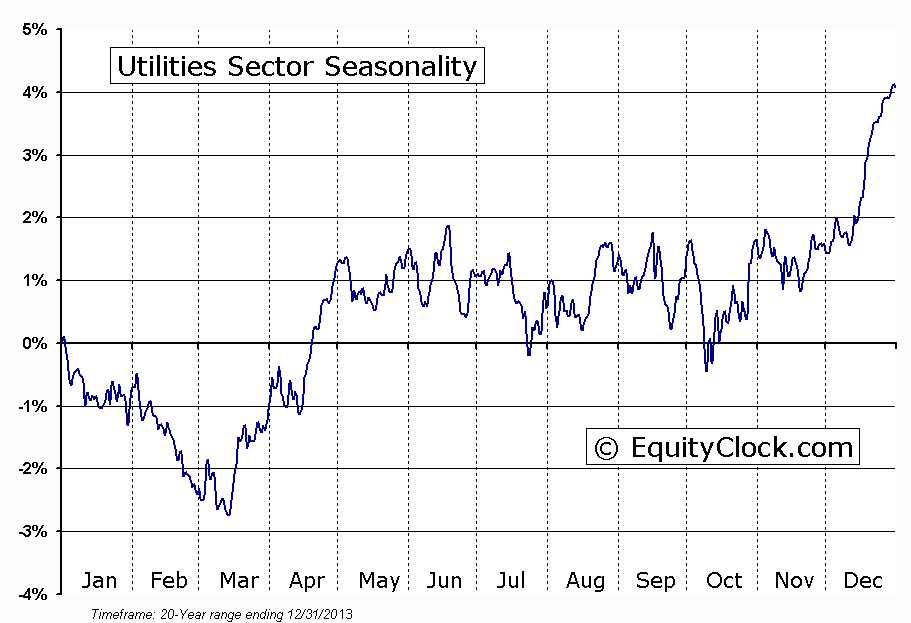
So what sectors tend to perform the best during the month of December? Over the past 20 years, Industrials and Utilities have averaged the highest returns, 2.3% and 2.5%, respectively, as well as the highest frequency of gains at 80% to 85% of the time. On the other hand, the Technology sector tends to be the weakest, gaining only 50% of the time, producing an average return of 0.7%. The results flip into the month of January when Technology takes the top spot for gains, on average, while Utilities and Industrials are amongst the weakest performers for the first month of the year.
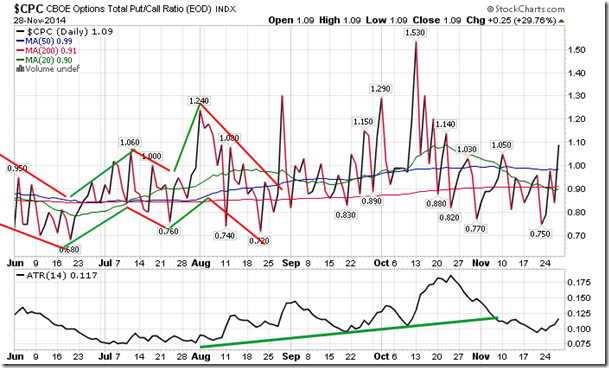
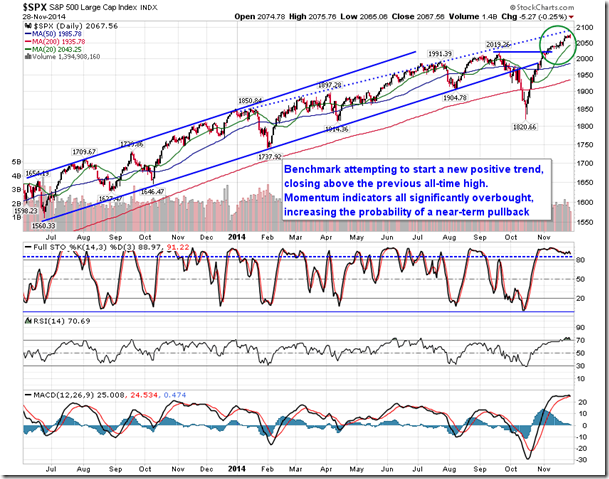
Sentiment on Friday, as gauged by the put-call ratio, ended bearish at 1.09. A bullish trend with respect to options activity has been evident since the put-call ratio peaked in mid-October, but now that trend may be showing signs of changing back to bearish, suggesting a retracement of some of the gains in equity indices may be ahead.
Seasonal charts of companies reporting earnings today:
S&P 500 Index
TSE Composite
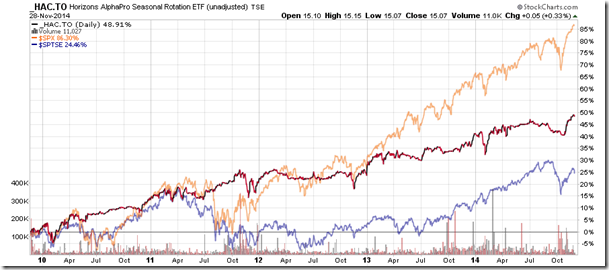
Horizons Seasonal Rotation ETF ((TO:HAC)
- Closing Market Value: $15.07 (up 0.33%)
- Closing NAV/Unit: $15.09 (down 0.09%)
Performance*
| 2014 Year-to-Date | Since Inception (Nov 19, 2009) | |
| HAC.TO | 5.52% | 50.9% |
* performance calculated on Closing NAV/Unit as provided by custodian
