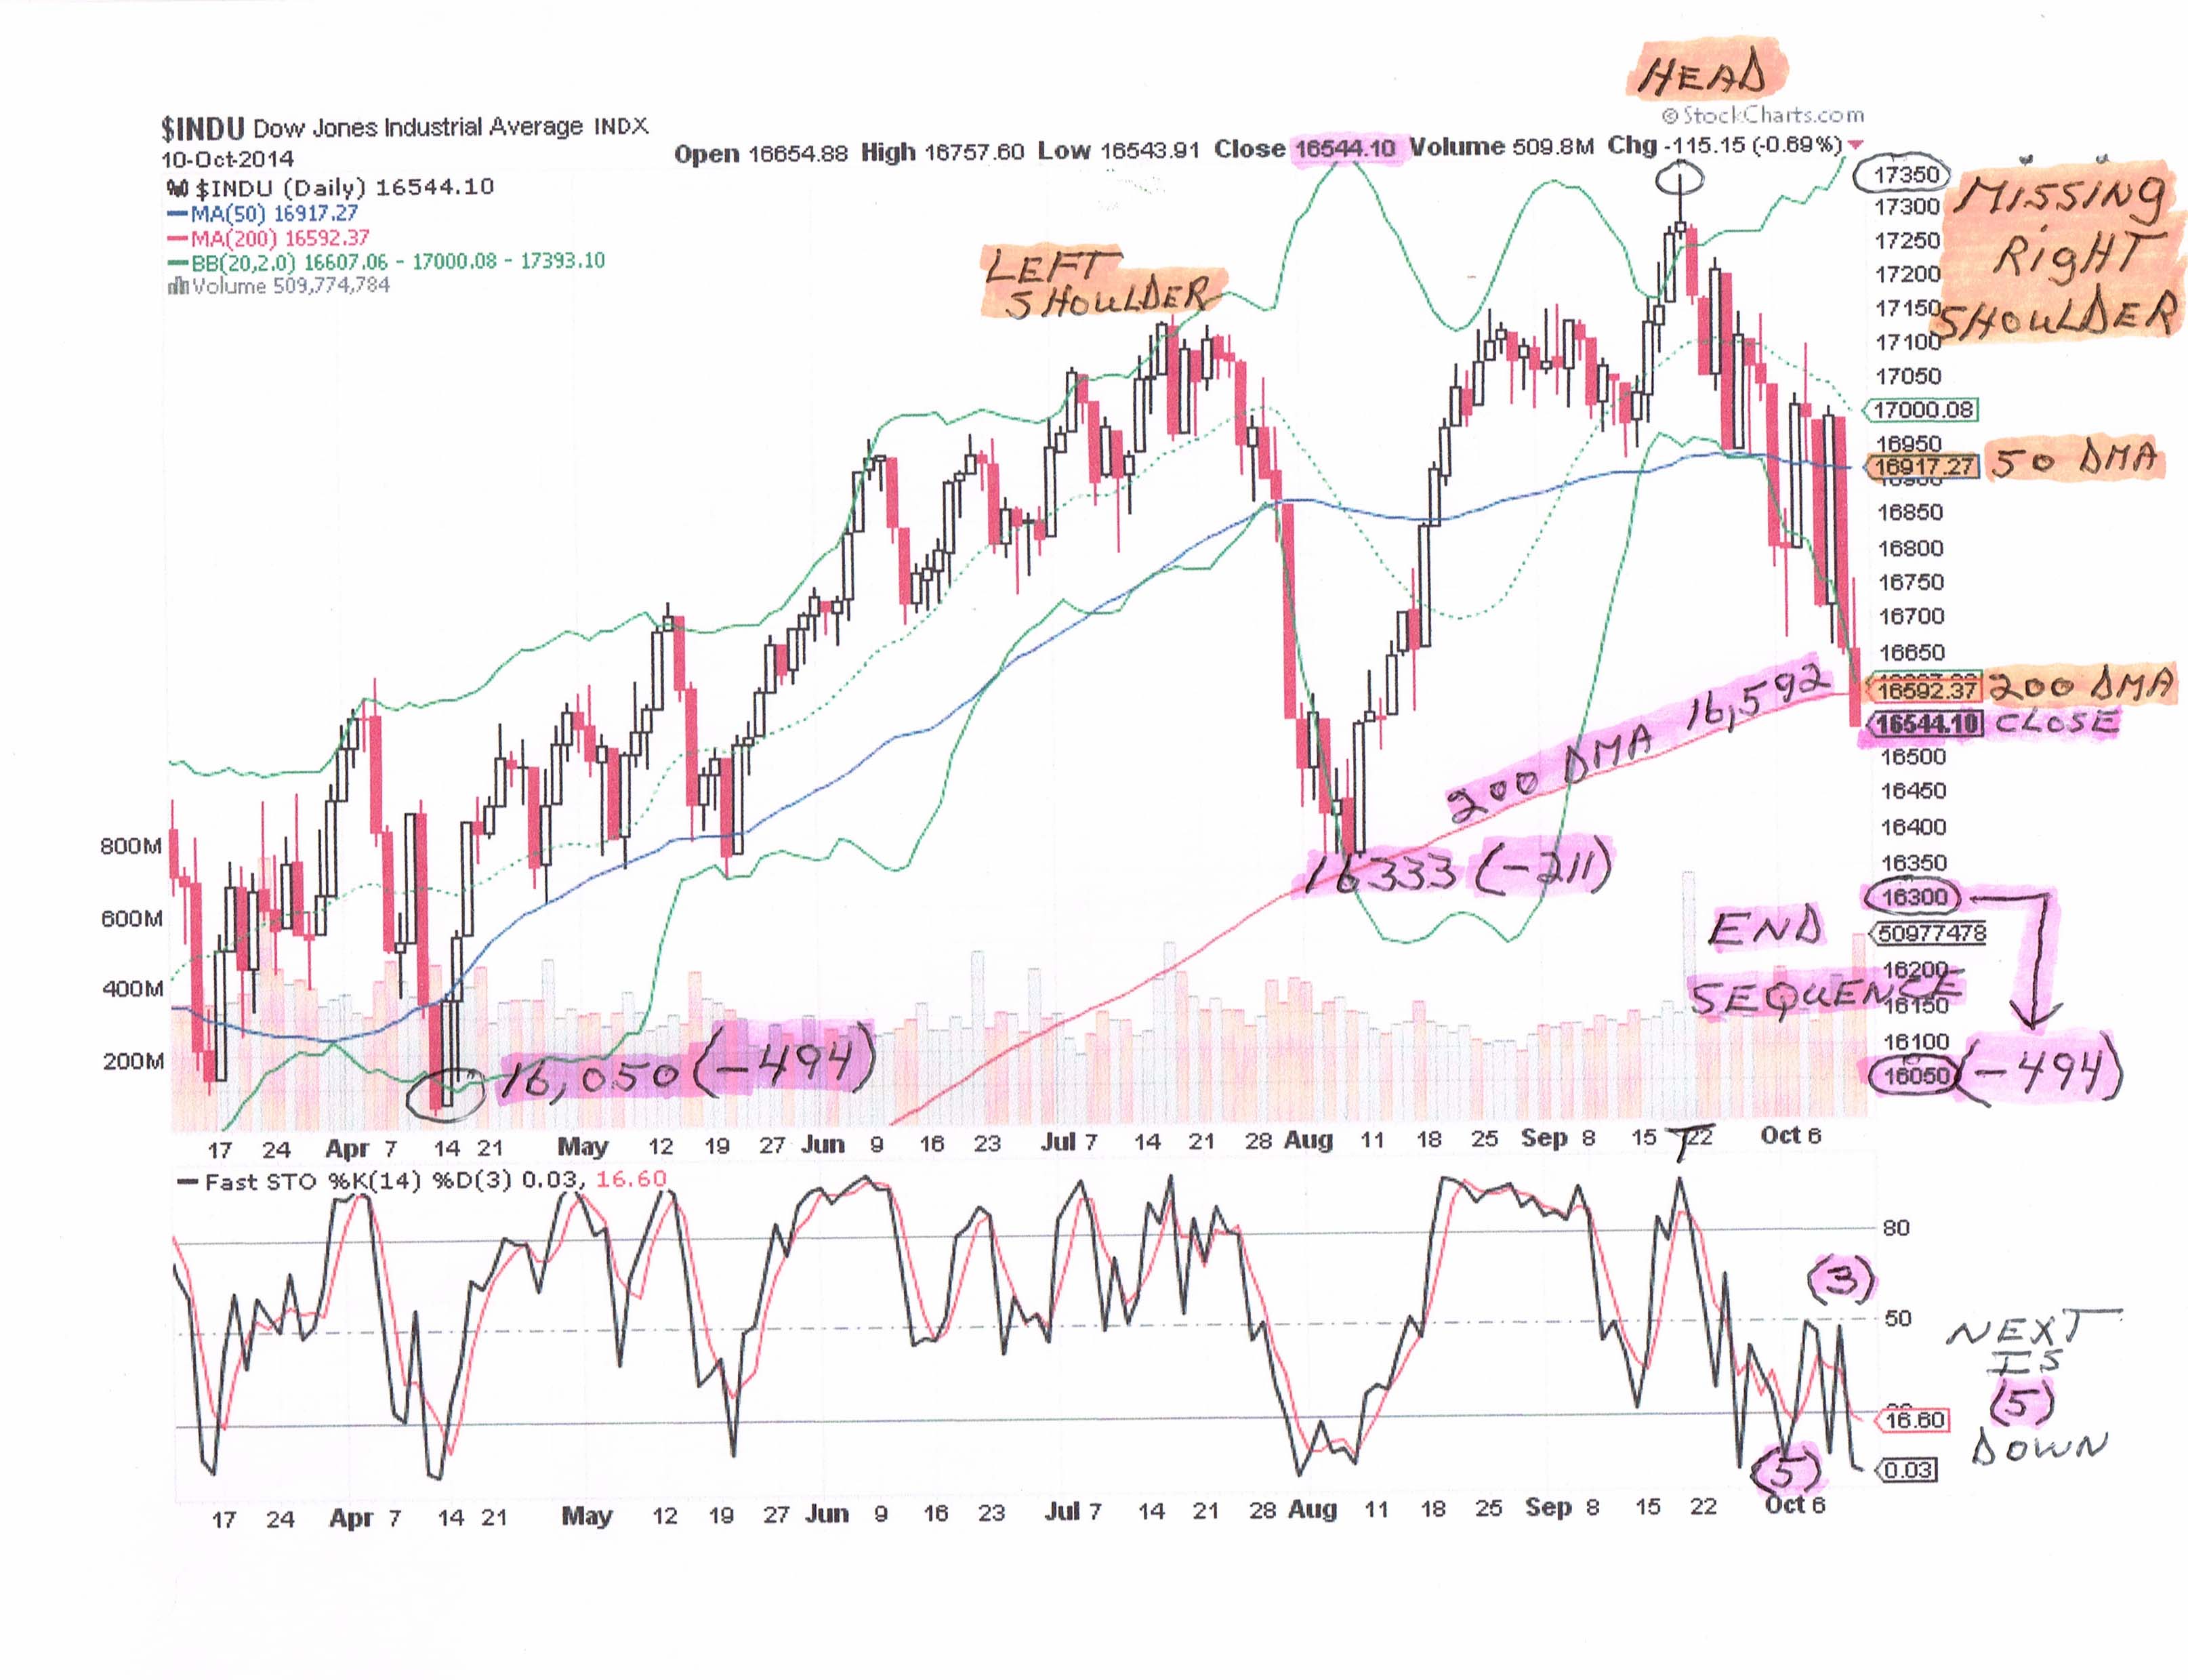
First lets discuss the "Strong Down" and that starts today. You can follow this discussion by referencing the highlighted "pink" information on the attached Dow chart.

I am currently processing the final sequence of 5 sub waves down. This final sequence started last Thursday when the DOW went down -335 points. That was just the 1st sub wave down and there will be a total of 5 sub waves, before this final down sequence is complete. Notice that we also broke the 200 day moving average on Friday and that was a "very" negative sign of weakness.
Observe on the DOW chart that we will open at 16,544. Our next support level is at 16,333 or -211 points to the downside. We could hit that today. The next support level is at 16,050 or -494 points down from the Monday open. I believe we could hit 16,050 or even go lower by Friday's close. There is also a possibility that we could see a mini-crash of 1,000 points by next Friday's close.
To summarize my "strong down" discussion I believe we could hit the 16,050 level by this coming Friday and even go lower than 16,050. At least down about 500 points from Monday's open and there is a possible mini-crash.
Now lets discuss the "Strong Up" part of this article. You can follow along by referencing the highlighted "gold" chart information. The bulls will like this
scenario.
Notice that we have been forming a large head and shoulders pattern on this DOW chart. That has also been happening with other indexes such as the S&P 500 and the NYSE.
This pattern says that when we complete our current down sequence, we have the potential of going back up and creating the "right shoulder". Notice on the chart that it says "missing right shoulder". I believe that could happen and that should start the following week on Monday - 10/20.
If we end this current down trend at 16,050, we have the potential of creating a right shoulder at the 50 day moving average (resistance) and that is currently
at 16917.
So we could see the Dow retrace back up +867 points to create the right shoulder. Again I believe that "could" happen and it will take about a month to complete this new uptrend.
There is also resistance at the 200 day moving average at 16592 and that could come into play if we sink a lot lower than 16,050 (mini -crash).
So these are "very" exciting times in the stock market and some great opportunities to make money on the "short" side and the "long" side.
