Upcoming US Events for Today:
- No significant economic events scheduled
Upcoming International Events for Today:
- German Unemployment Rate for May will be released at 3:55am EST. The market expects no change at 6.7%.
- Euro-Zone Economic Sentiment for May will be released at 5:00am EST. The market expects 102.4 versus 102.0 previous.
- Japan Retail Sales for April will be released at 7:50pm EST. The market expects a year-over-year decline of 3.3% versus an increase of 11.0% previous.
Recap of Yesterday’s Economic Events:
| Event | Actual | Forecast | Previous |
| JPY Small Business Confidence | 46.6 | 45.4 | |
| CHF Trade Balance (Swiss franc) | 2.43B | 2.10B | 2.00B |
| CHF Exports (MoM) | 0.60% | -1.10% | |
| CHF Imports (MoM) | -0.50% | -3.90% | |
| USD Durable Goods Orders | 0.80% | -0.70% | 3.60% |
| USD Durables Ex Transportation | 0.10% | 0.00% | 2.90% |
| USD Cap Goods Orders Nondef Ex Air | -1.20% | -0.30% | 4.70% |
| USD Cap Goods Ship Nondef Ex Air | -0.40% | -0.20% | 2.10% |
| USD S&P/Case-Shiller US Home Price Index (YoY) | 10.35% | 9.90% | 11.37% |
| USD House Price Purchase Index (QoQ) | 1.30% | 1.30% | 1.20% |
| USD S&P/CS 20 City (MoM) SA | 1.24% | 0.70% | 0.78% |
| USD S&P/Case-Shiller Home Price Index | 166.8 | 166.23 | 165.35 |
| USD S&P/Case-Shiller US Home Price Index | 150.76 | 150.5 | |
| USD House Price Index (MoM) | 0.70% | 0.50% | 0.60% |
| USD S&P/Case-Shiller Composite-20 (YoY) | 12.37% | 11.75% | 12.86% |
| USD Markit Services PMI | 58.4 | 54.5 | 55 |
| USD Markit Composite PMI | 58.6 | 55.6 | |
| USD Consumer Confidence | 83 | 83 | 81.7 |
| USD Richmond Fed Manufacturing Index | 7 | 8 | 7 |
| USD Dallas Fed Manufacturing Activity | 8 | 9.2 | 11.7 |
The Markets
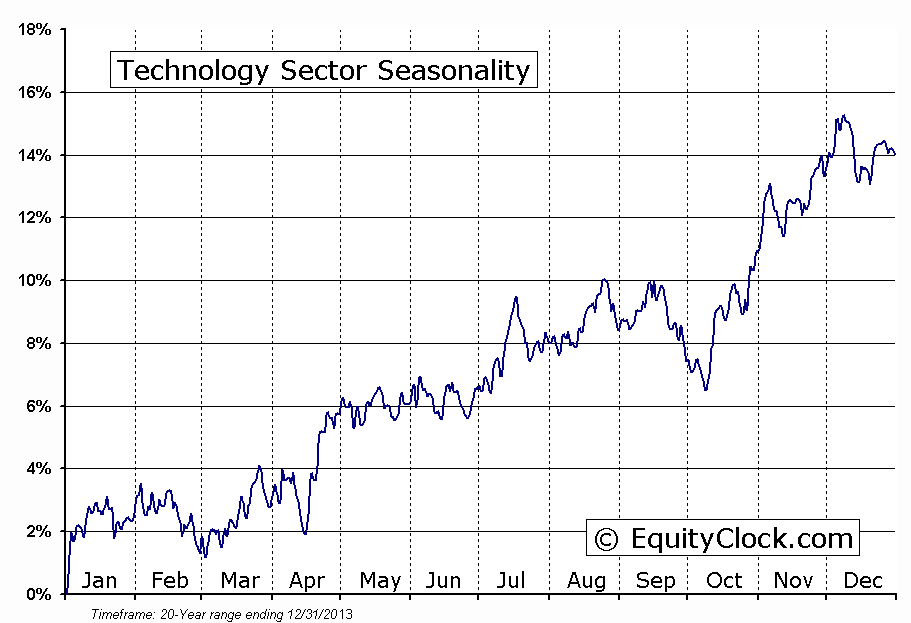
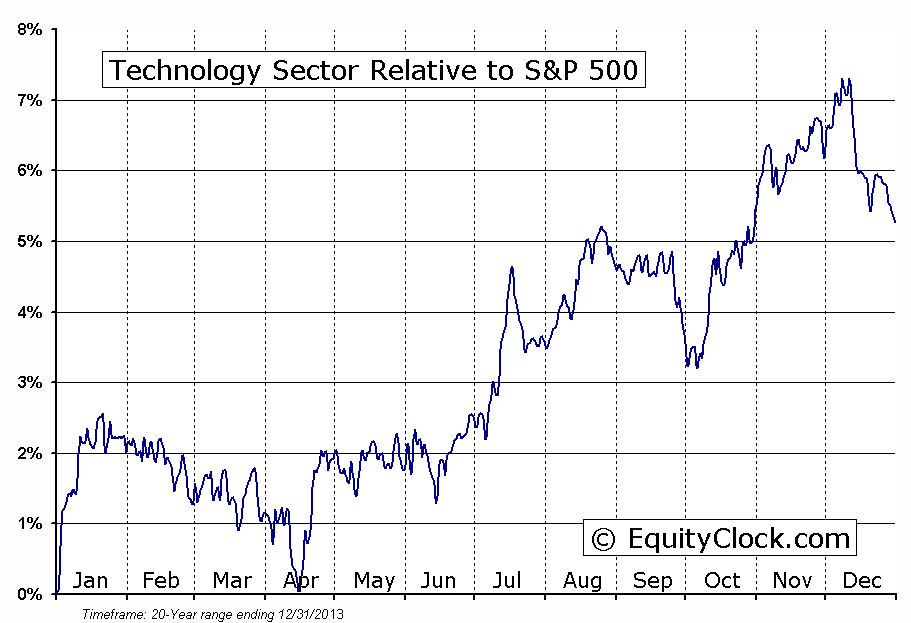
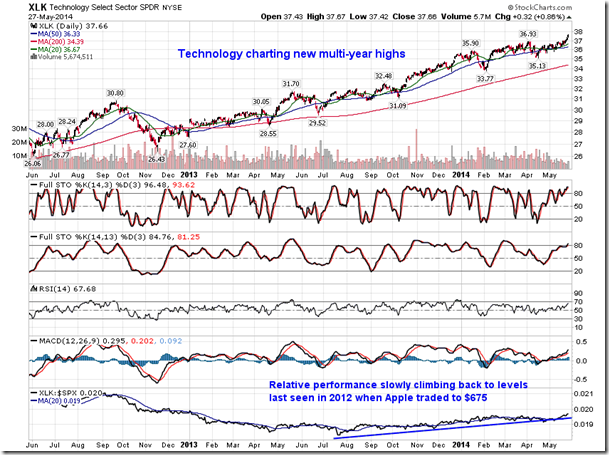
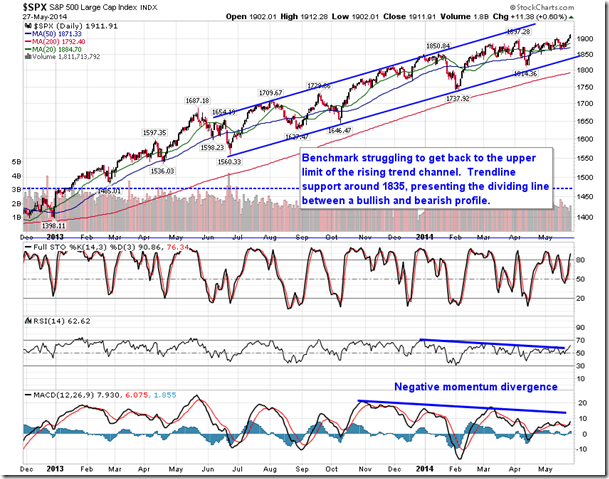
Stocks in the US ended higher as traders welcomed a number of stronger than expected economic reports, continuing the recent trend of economic beats. The S&P 500 Index closed at a new all-time high, fuelled by the benchmarks largest sector weighting, Technology. The Technology sector ETF charted a fresh multi-year high and the relative performance of the market segment is slowly climbing back to the highs that were last seen when shares of Apple traded around their all-time high back in 2012. The Technology sector remains seasonally strong through to July.
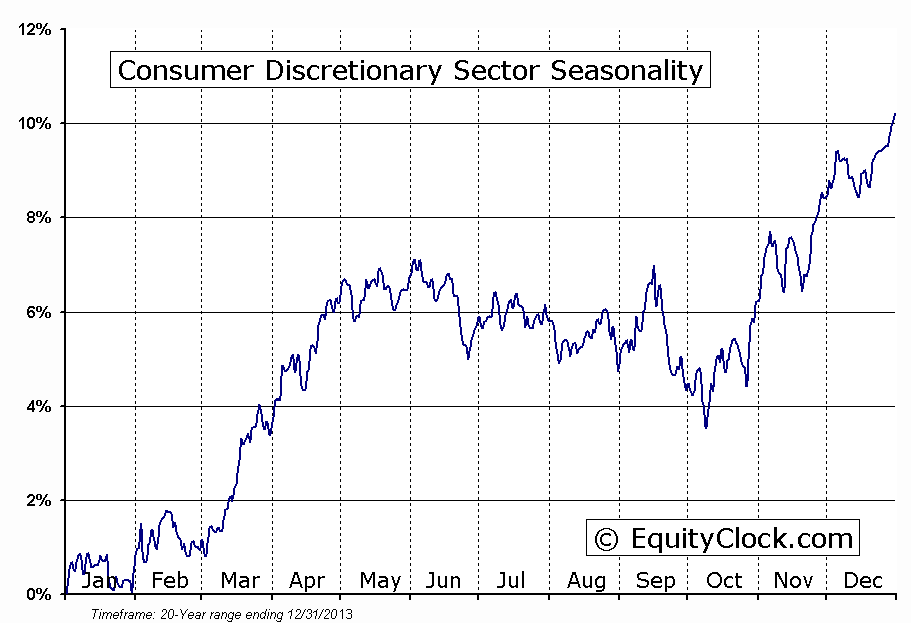
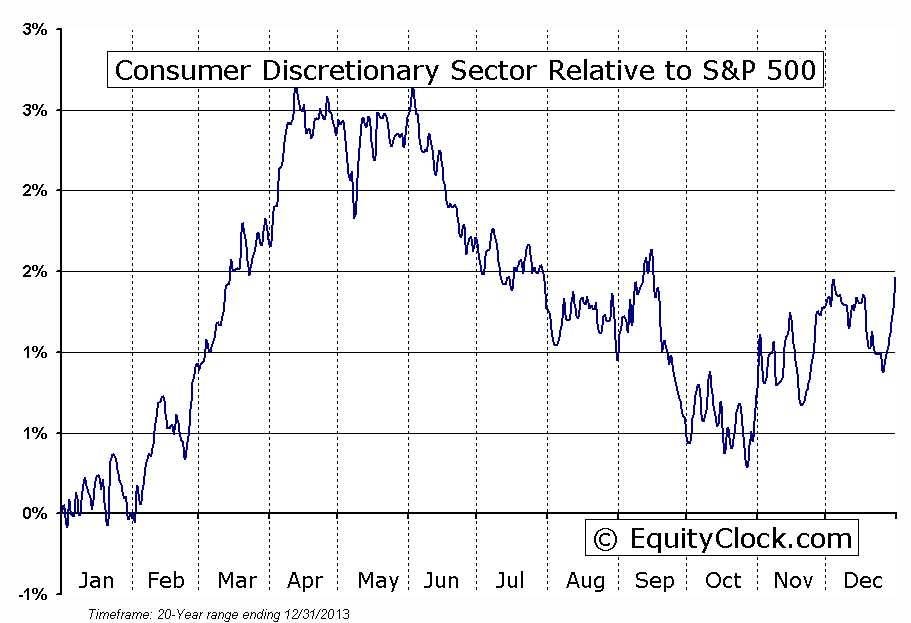
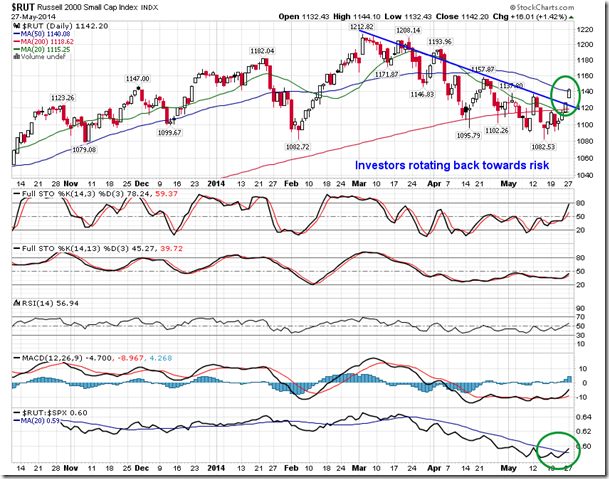
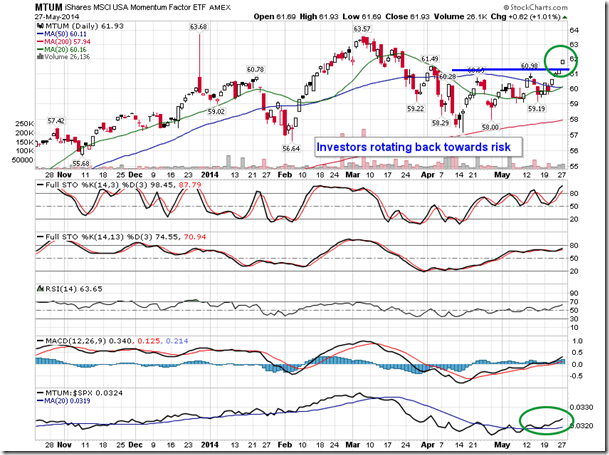
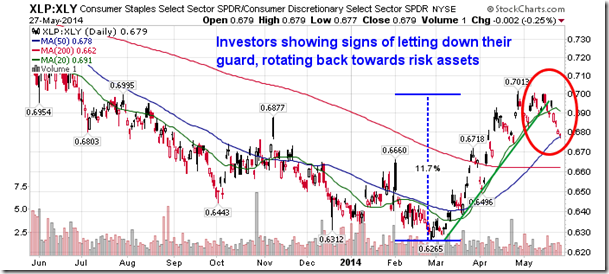
Investors were witnessed rotating back towards risk assets during Tuesday’s session, adding beta to portfolios amidst the recent breakout in the S&P 500. Small-Caps and momentum stocks are starting to outperform the market as investors buy the recent dip. Defensive sectors, including Consumer Staples and Utilities, are showing signs of lag versus the market. The ratio of the Consumer Staples ETF (XLP) versus the Consumer Discretionary ETF (XLY), a gauge of risk-aversion, is pulling back from the highs of the year, signalling that investors are letting down their guard. The ratio had surged nearly 12% in March and April as the discretionary trade, mainly retail, showed signs of unwinding after a strong 5 year run. The consumer discretionary sector is seasonally negative between the start of June through to October, declining by just over 3%, on average, and underperforming the S&P 500 by just over 2%. Discretionary, Materials, and Industrials are the three weakest sectors during the summer months as investors seek to reduce portfolio beta during the often volatile trading environment.
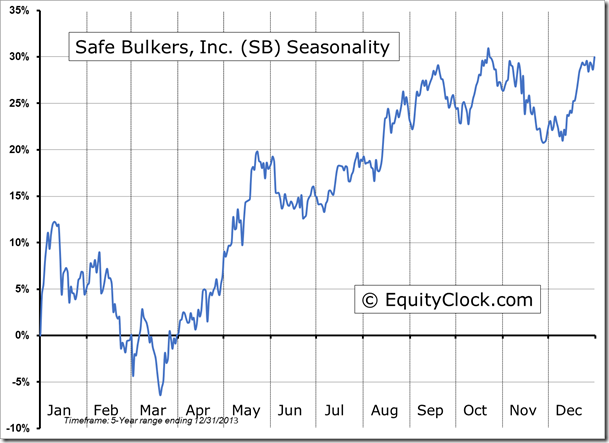
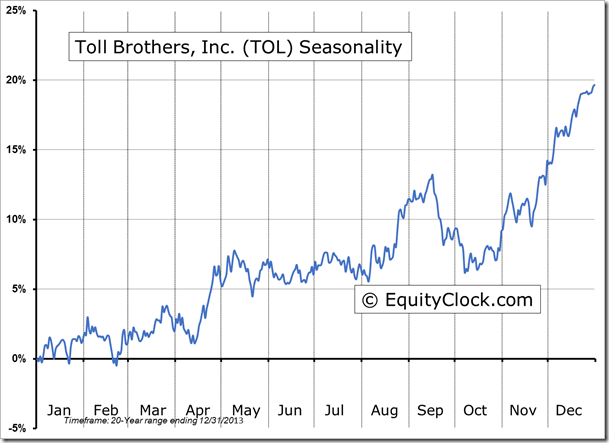
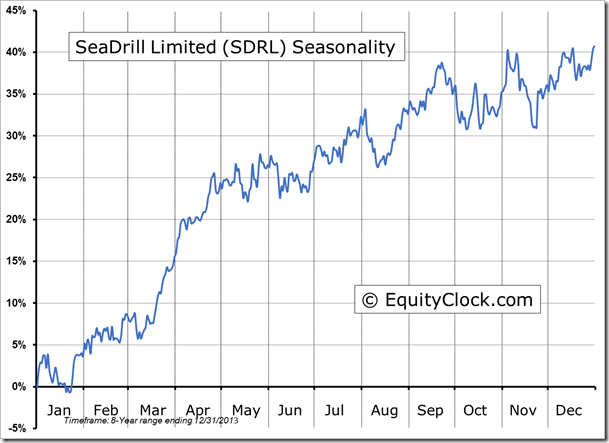
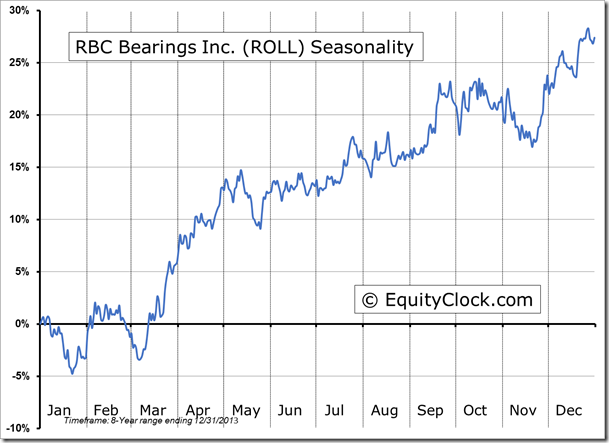
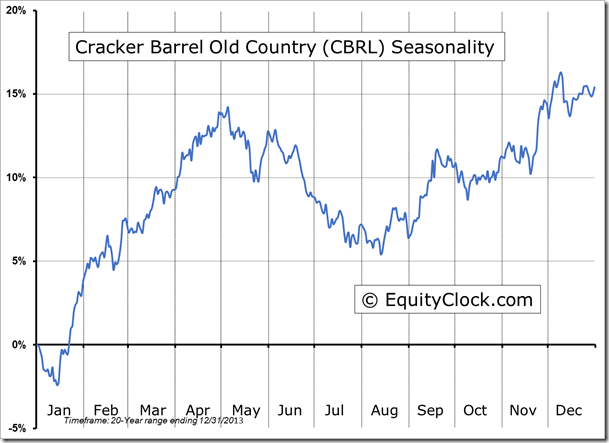
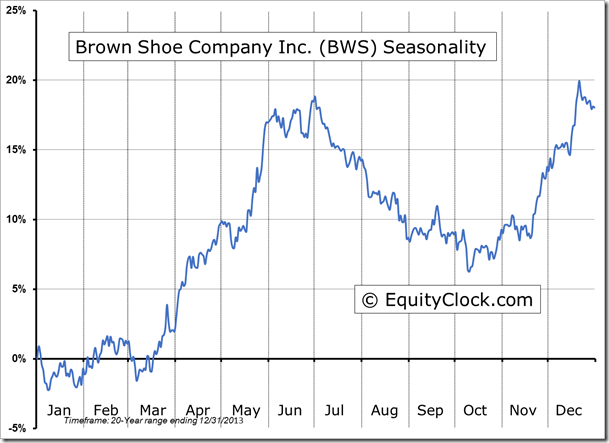
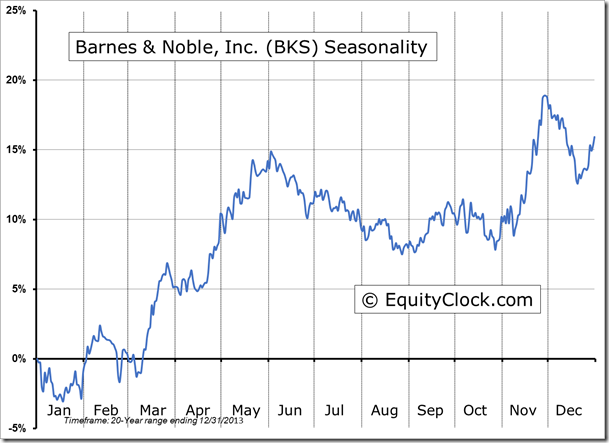
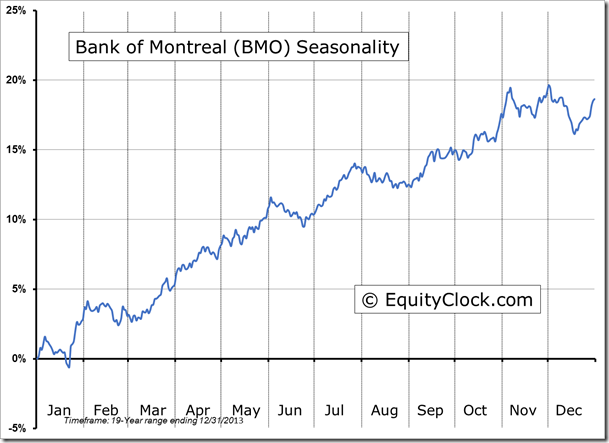
Seasonal charts of companies reporting earnings today:
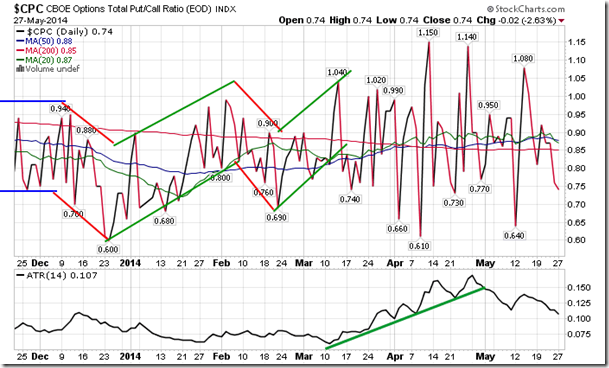
Sentiment on Tuesday, as gauged by the put-call ratio, ended bullish at 0.74.
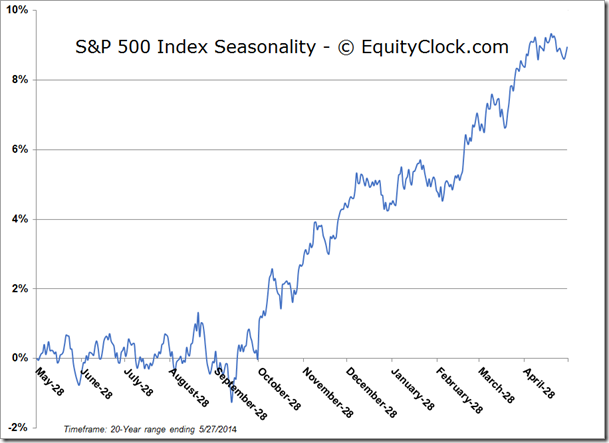
S&P 500 Index
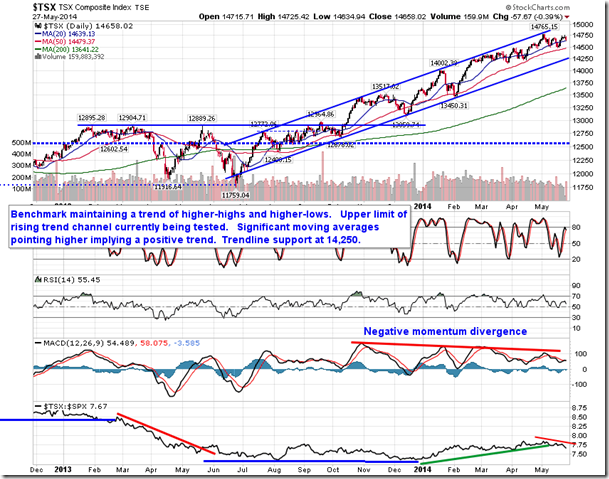
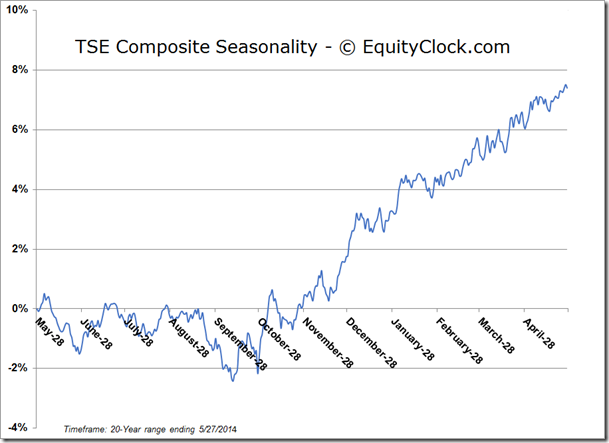
TSE Composite
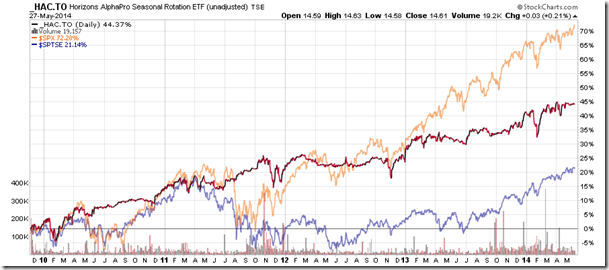
Horizons Seasonal Rotation ETF (TSX:HAC)
- Closing Market Value: $14.61 (up 0.21%)
- Closing NAV/Unit: $14.61 (down 0.17%)
Performance*
| 2014 Year-to-Date | Since Inception (Nov 19, 2009) | |
| HAC.TO | 2.17% | 46.1% |
* performance calculated on Closing NAV/Unit as provided by custodian
