Upcoming US Events for Today:
- Weekly Jobless Claims will be released at 8:30am. The market expects Initial Claims to show 297K versus 293K previous.
- Factory Orders for August will be released at 10:00am. The market expects a month-over-month decline of 9.3% versus an increase of 10.5% previous.
Upcoming International Events for Today:
- Great Britain PMI Construction for September will be released at 4:30am EST. The market expects 63.5 versus 64.0 previous.
- Euro-Zone PPI for August will be released at 5:00am EST. The market expects a year-over-year decline of 1.2% versus a decline of 1.1% previous.
- ECB Monetary Policy Announcement will be released at 7:45am EST. The market expects no change in rates at 0.05%.
The Markets
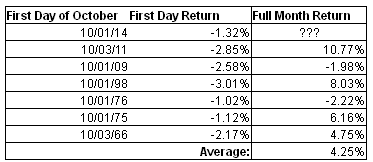
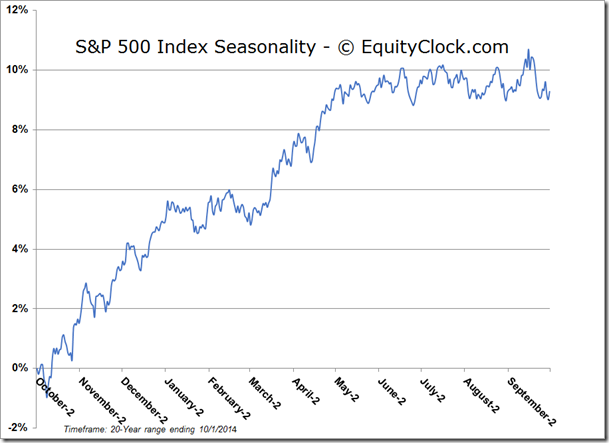
Stocks plunged on Wednesday, starting the month of October, as well as the third quarter, on a negative note. Wednesday’s plunge was the 5th worst start to October in the last 50 years, a month that is characterized by significant volatility. Despite October being a volatile month, it is also a profitable month, on average. Since 1964, years with declines of 1% or more on the first trading day of October have turned around to average a full month gain of 4.25%, which includes the loss recorded to start the month. October is typically a turnaround period, concluding the weakest period of the year for stocks and beginning the strongest, which runs through to the spring of the following year. It remains up to the technicals to trigger the start of the seasonal trend ahead.
Weakest starts to October over the past 50 years for the S&P 500 Index:
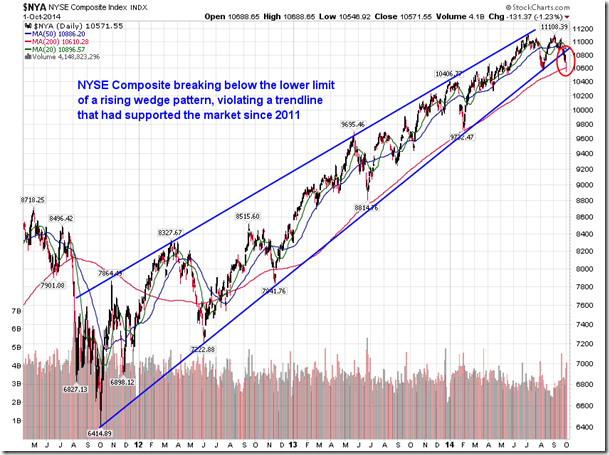
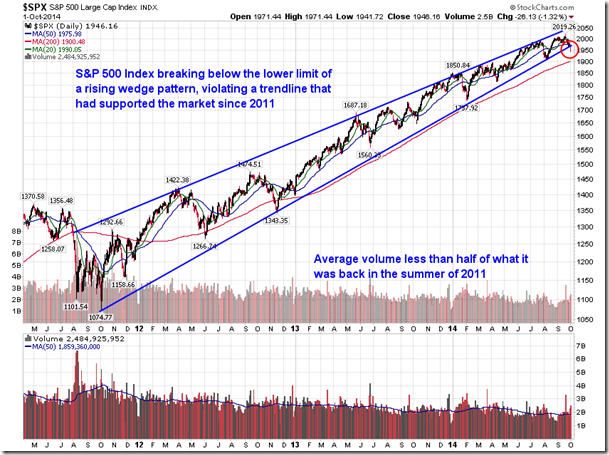
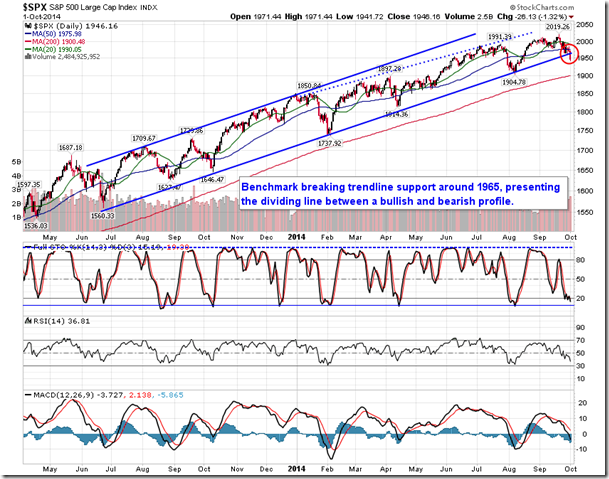
Much of the selling pressure on the day was related to technical selling as the S&P 500 Index, Dow Jones Industrial Average, Nasdaq Composite, and Dow Jones Transportation Average all pushed firmly below their 50-day moving averages, quickly reaching oversold levels. Perhaps more important than the break of this significant moving average was the breach recorded by the S&P 500 Index and NYSE Composite. Both benchmarks broke below the lower limit of a long-term rising wedge pattern, a bearish setup that typically leads to a substantial retracement of gains accumulated since the pattern started. The lower limit of the pattern has supported the broad equity market since the last major correction in 2011, just as QE 2 concluded and before the announcement of Operation Twist. With October marking the last month for the current quantitative easing program, a monetary stimulus that has been tremendously successful for equity markets, it would appear that stocks are playing out the familiar scenario of correcting following the withdrawal of bond purchases in the US. It remains to be seen how monetary policy/stimulus from other central banks around the globe will manipulate equity markets now that the US Fed is in the process of tightening.
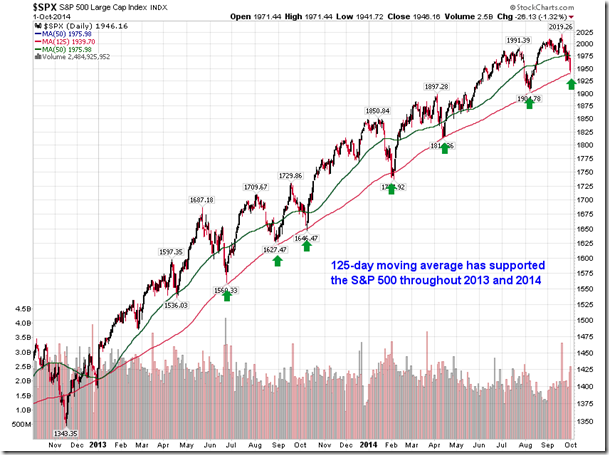
Despite the break of trendline resistance, support for the S&P 500 at the 125-day moving average cannot be overlooked. Many investors are watching this level, presently at 1940, since it has supported the large-cap benchmark throughout 2013 and 2014. Higher-highs and higher-lows continue to dominate the long-term trend, certainly not suggestive of a market that may correct. Declining trends are characterized by a series of lower-highs and lower-lows, something that certainly isn’t yet evident on the daily chart. Therefore, without that lower-high or lower-low it must be anticipated that the ongoing positive trend will remain. But if a lower-high or lower-low is revealed, as the broken rising wedge pattern is suggesting may occur, a positive equity market bias may need to be traded for a negative bias, allowing for the equity market weakness to play out before “buying the dip” becomes prudent. The previous low at 1904 remains a critical level to watch.
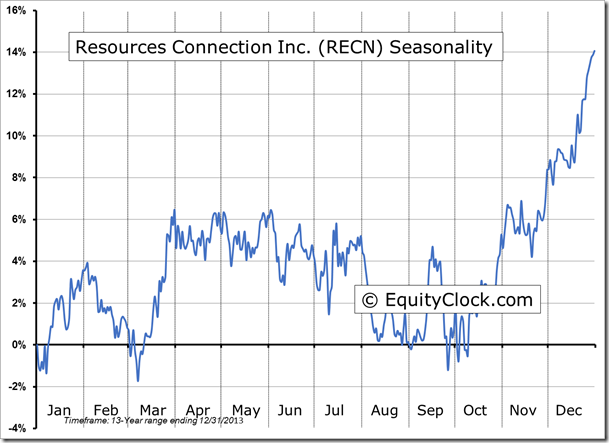
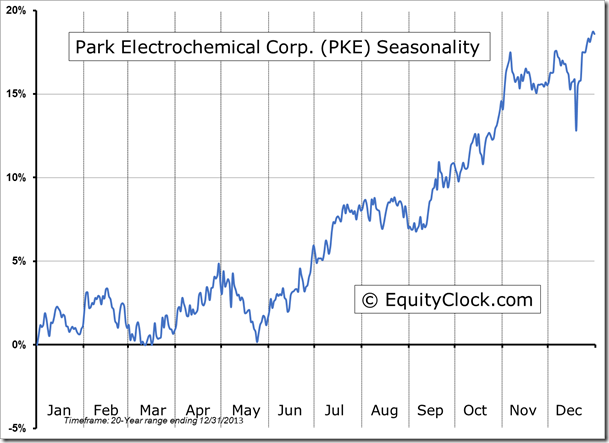
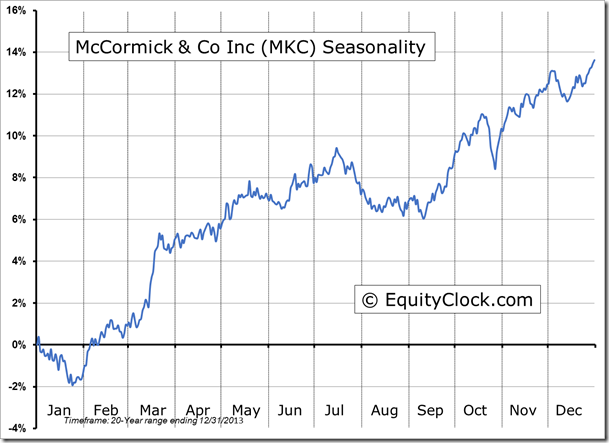
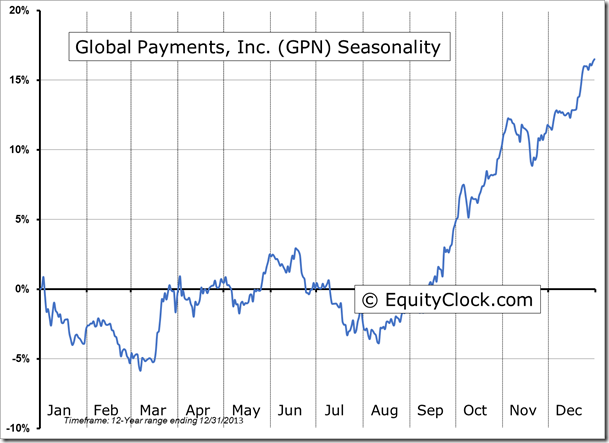
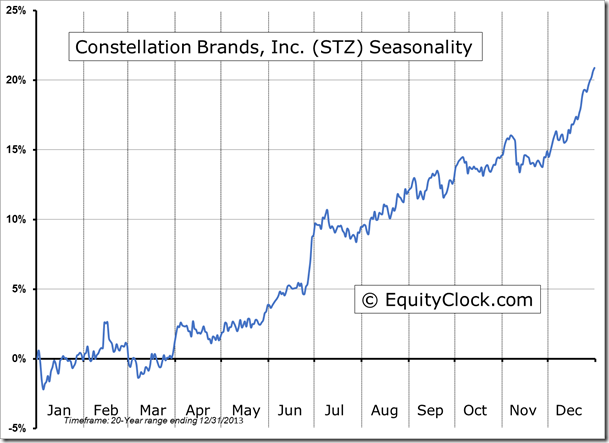
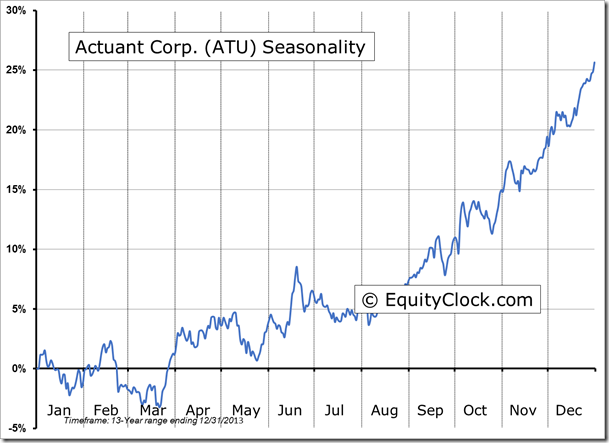
Seasonal charts of companies reporting earnings today:
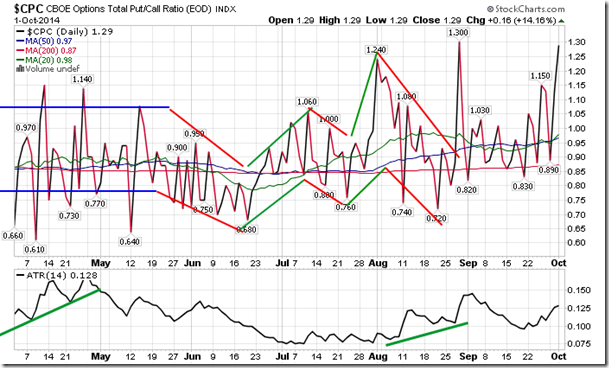
Sentiment on Wednesday, as gauged by the put-call ratio, ended bearish at 1.29. This is the second highest reading of the year and indicative of extreme pessimism as investors aggressively hedge portfolios with put options. Typically, extreme readings, such as this, coincide with short-term turning points in the market as investors lean too far in one particular direction. With support at the 125-day moving average for the S&P 500 Index and excessive bearishness presented by options activity, conditions are favourable for a bounce in the short-term.
S&P 500 Index
TSX Composite
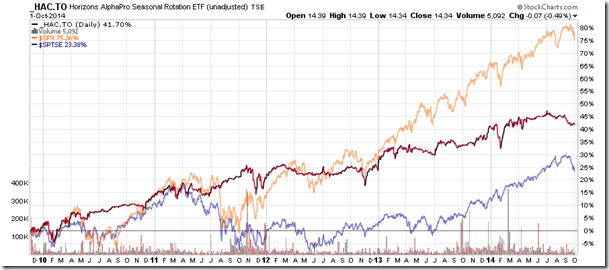
Horizons Seasonal Rotation ETF (TO:HAC)
- Closing Market Value: $14.34 (down 0.49%)
