**NEW** As part of the ongoing process to offer new and up-to-date information regarding seasonal and technical investing, we are adding a section to the daily reports that details the stocks that are entering their period of seasonal strength, based on average historical start dates. Stocks highlighted are for information purposes only and should not be considered as advice to purchase or to sell mentioned securities. As always, the use of technical and fundamental analysis is encouraged in order to fine tune entry and exit points to average seasonal trends.
Stocks Entering Period of Seasonal Strength Today:
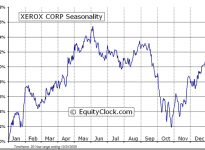
Xerox Corporation (NYSE:XRX) Seasonal Chart
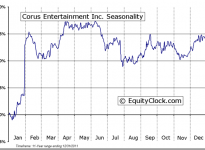
Corus Entertainment Inc. (TO:CJRb) Seasonal Chart
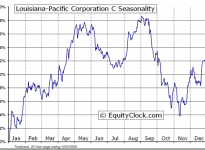
Louisiana-Pacific Corporation (NYSE:LPX) Seasonal Chart
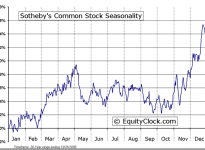
Sotheby’s (NYSE:BID) Seasonal Chart
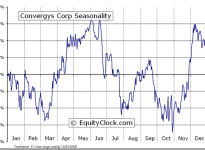
Convergys Corporation (NYSE:CVG) Seasonal Chart
The Markets
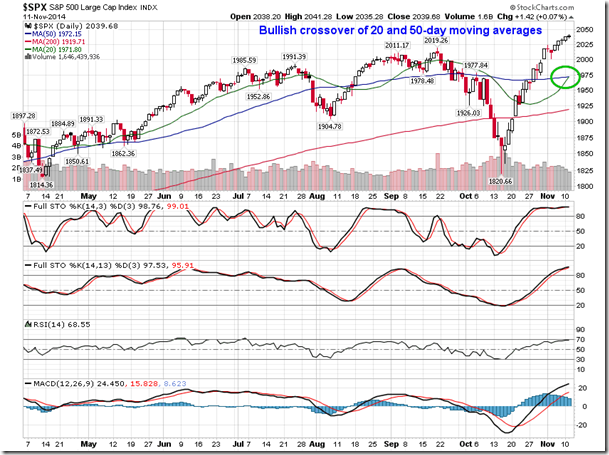
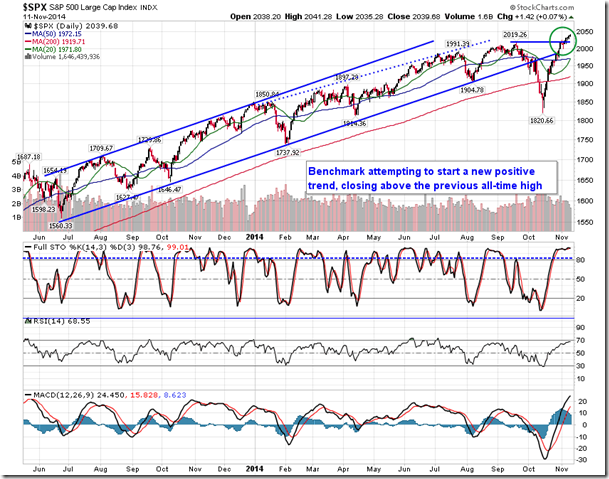
Stocks traded higher on light volume on Tuesday with the S&P 500 Index and Dow Jones Industrial Average charting fresh closing highs. Momentum continues to show signs of waning as the abrupt rebound rally from the October low appears to be reaching a short-term peak. Hints of a short-term high are becoming apparent as the 20-day moving average pushes above the 50-day in a bullish cross formation, often perceived as a positive sign for the intermediate trend; using these short-term crossovers as buy or sell triggers can often realize unfavourable results. A bearish crossover of the 20 and 50-day moving averages was recorded on October 10th, just three sessions prior to the low for the month, suggesting it would have been better used as a signal to buy the S&P 500 rather than selling it. The opposite scenario may become apparent now that a bullish crossover has been realized.
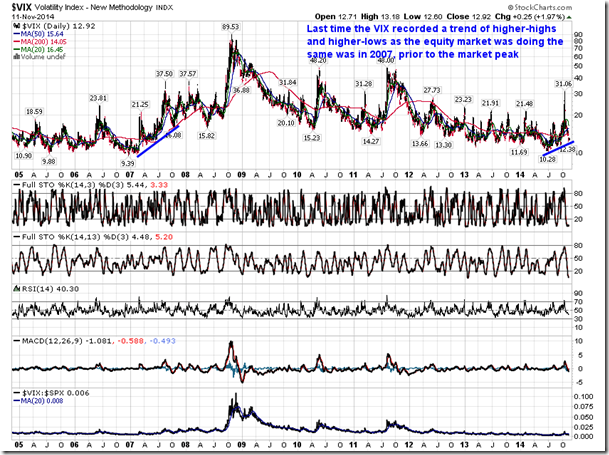
Despite the unprecedented rebound in equity prices over the last few weeks, the Volatility Index (VIX), a gauge of fear and uncertainty in the equity market, continues on a positive path. The rising trendline stretching from the summer lows remains intact; the 50-day moving average of the “fear” indicator remains at the highest level since the start of 2013. The benchmark is also testing longer-term support around 12. What this index is telling is very much open to interpretation, however, it is interesting to note that the previous instance of a rising multi-month trend of at least five months in length, characterized by higher-highs and higher-lows over an intermediate timescale, was back in 2007, just as the equity market was continuing a trend of higher-highs and higher-lows. Of course we now know that this was the first sign of destabilization prior to the ultimate peak in the market later that year. It is certainly premature to imply anything as extreme as the decline realized back in 2008/2009, however, at current prices in the equity market, the risks are starting to outweigh the potential reward over the near-term, suggesting better levels to buy may be around the corner.
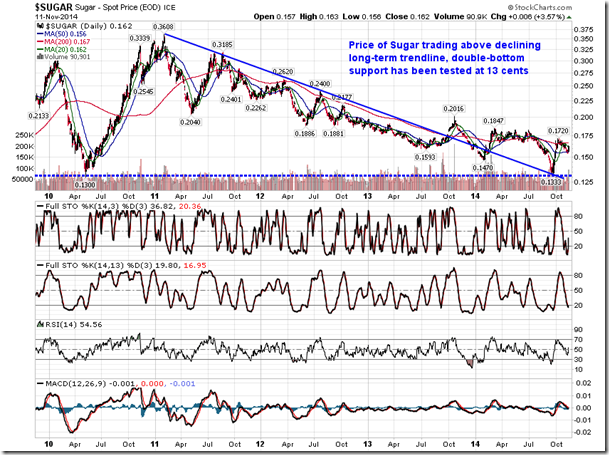
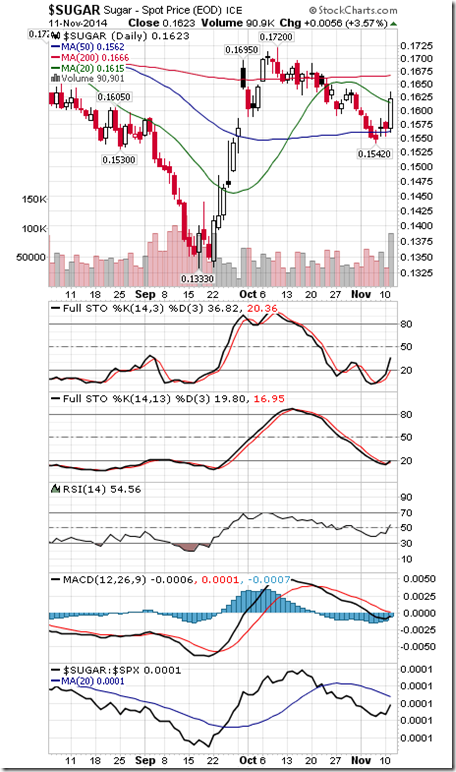
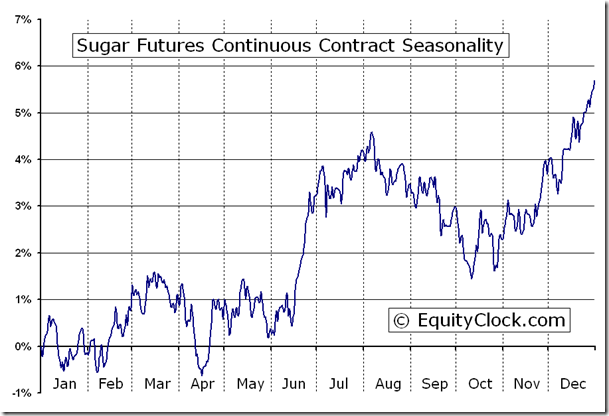
And finally for today, Sugar prices soared on Tuesday on news that production in Brazil fell sharply as mills shut for the season. The price of the commodity has been in a decline since the start of 2011, but evidence is starting to amount that a significant low has been reached. For most of this year, the price of sugar has been trading above a declining trendline that constrained trading activity for the past few years. Sugar has also tested double bottom support at 13 cents per pound. Price has very recently tested support at a now rising 50-day moving average, suggesting intermediate-term strength; momentum indicators are beginning to curl higher. Sugar just entered a period of seasonal strength that runs through the end of the year, benefiting from the seasonal decline in production and the pickup in demand surrounding the holiday season. Look for a move above resistance at 17.2 cents to confirm the start of a new leg higher within the period of seasonal strength.
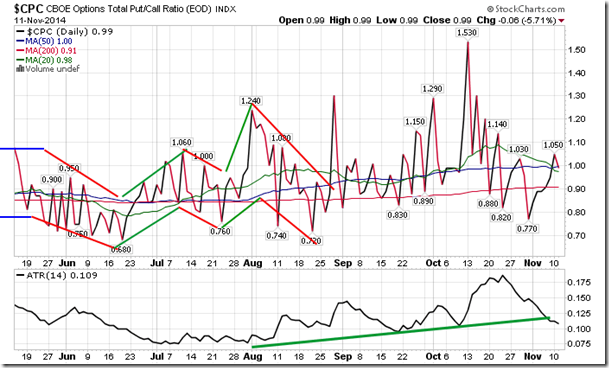
Sentiment on Tuesday, as gauged by the put-call ratio, ended close to neutral at 0.99.
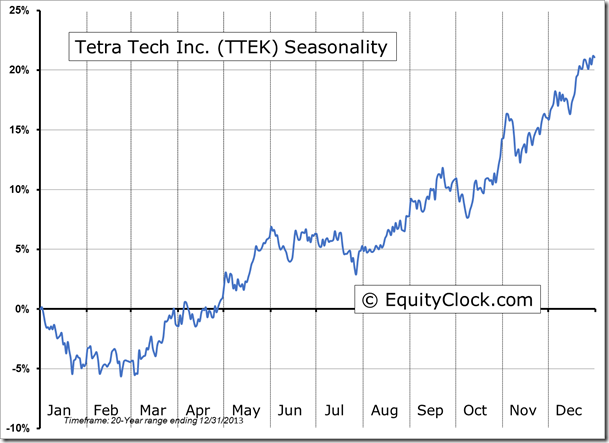
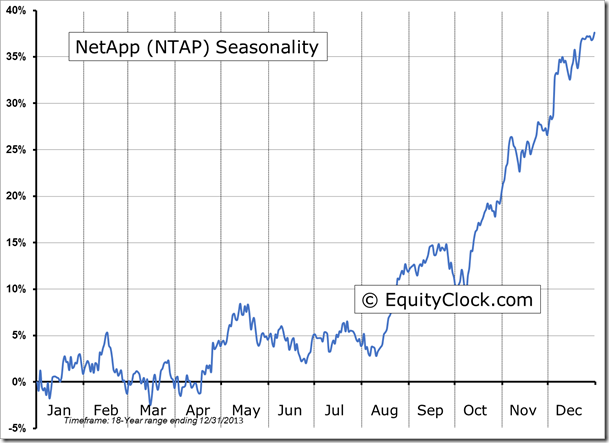
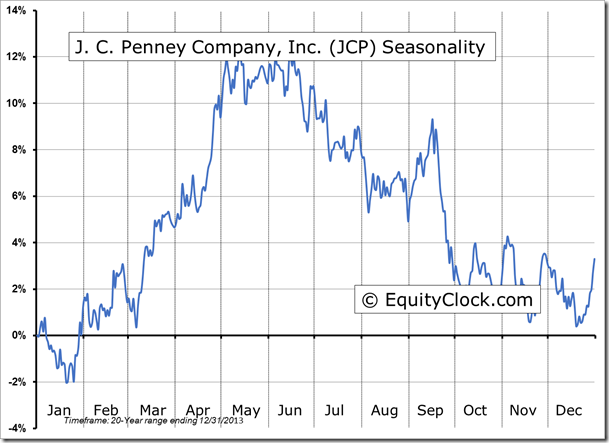
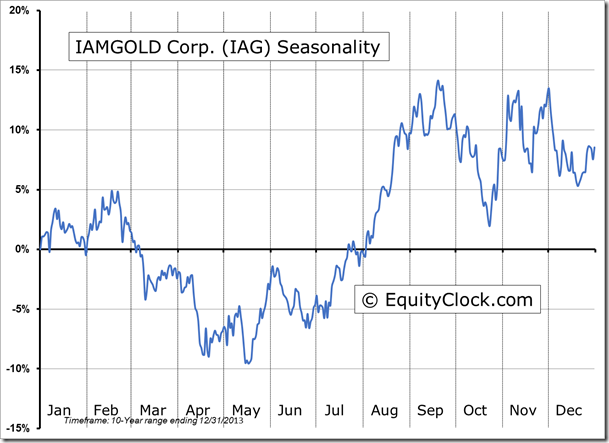
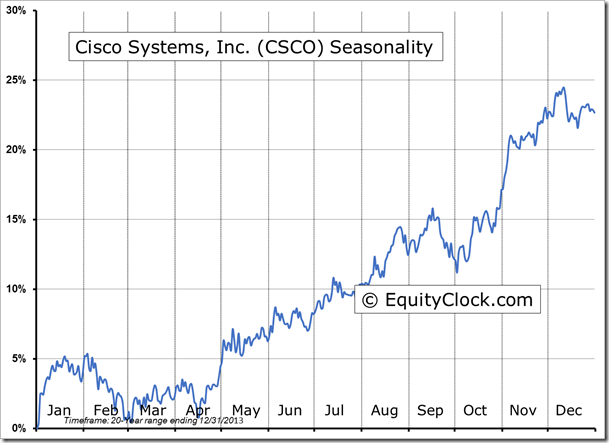
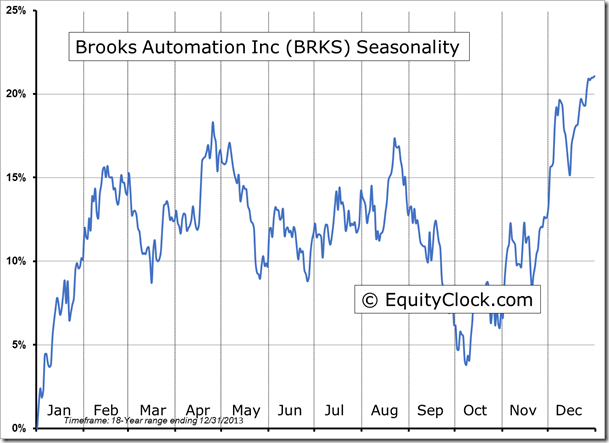
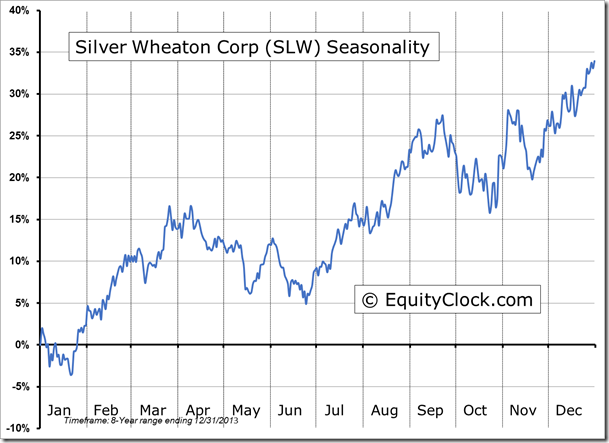
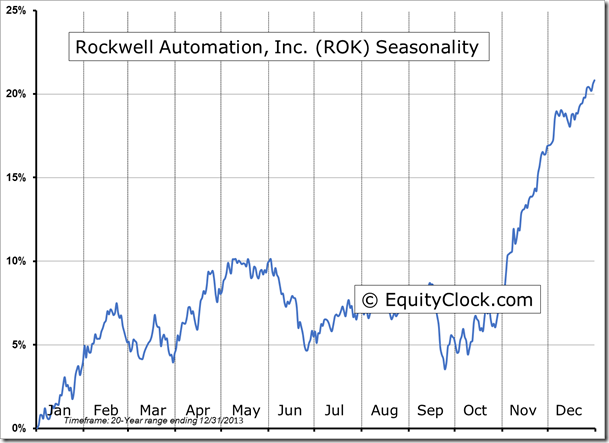
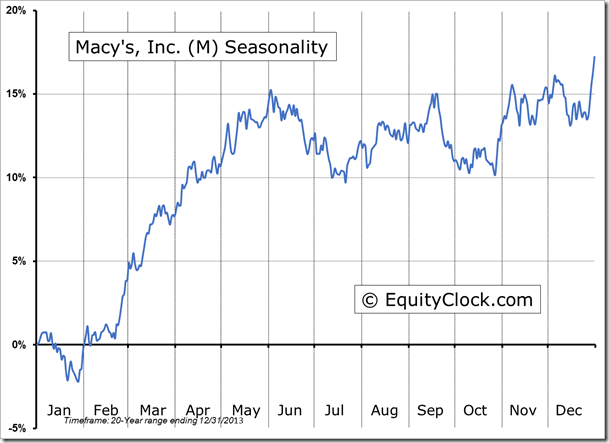
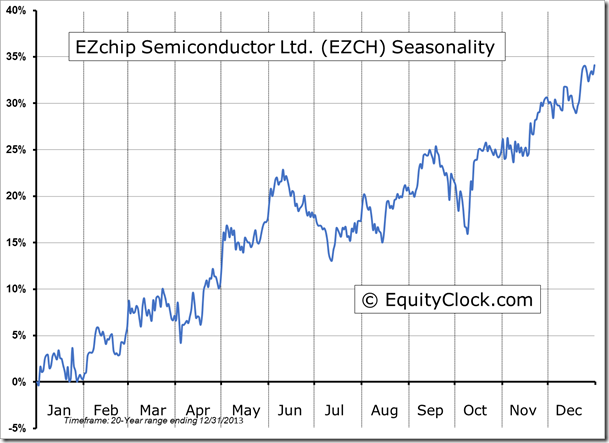
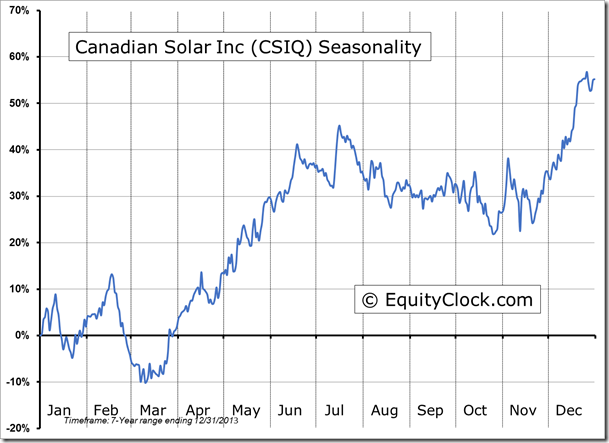
Seasonal charts of companies reporting earnings today:
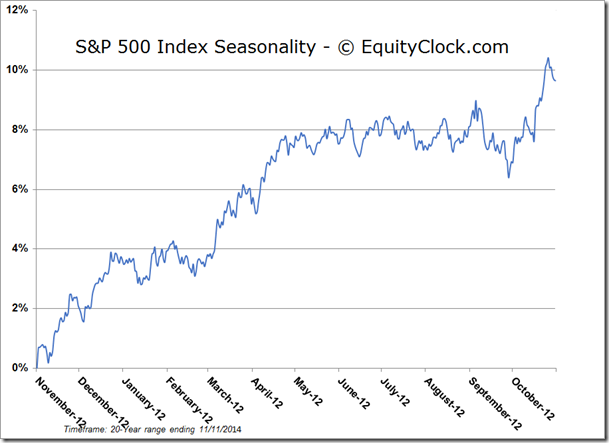
S&P 500 Index
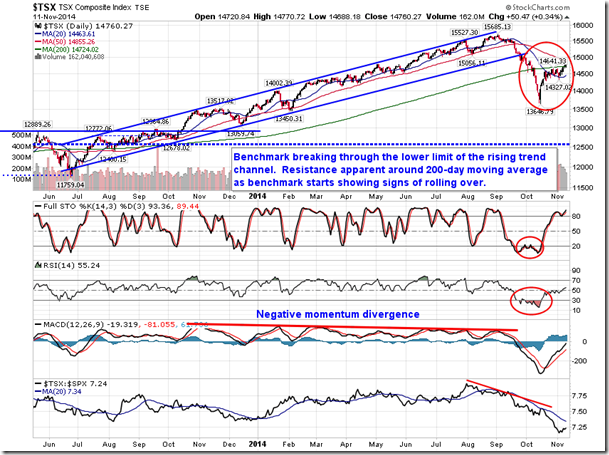
TSE Composite
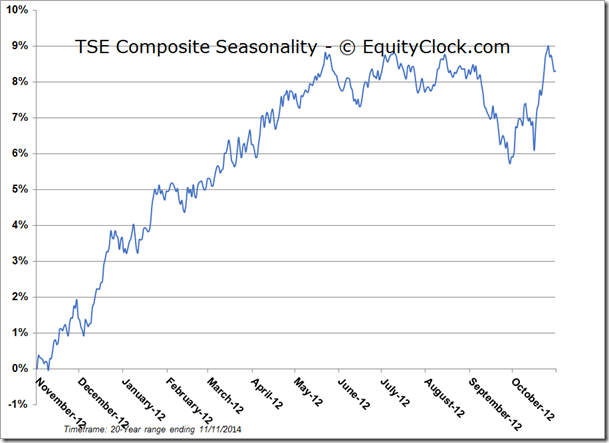
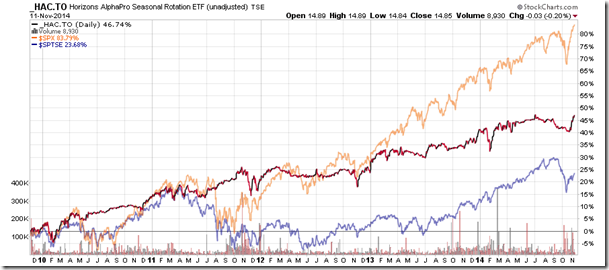
Horizons Seasonal Rotation ETF (TO:HAC)
- Closing Market Value: $14.85 (down 0.20%)
- Closing NAV/Unit: $14.86 (down 0.01%)
Performance*
| 2014 Year-to-Date | Since Inception (Nov 19, 2009) | |
| HAC.TO | 3.92% | 48.6% |
* performance calculated on Closing NAV/Unit as provided by custodian
