Upcoming US Events for Today:- Weekly Jobless Claims will be released at 8:30am. The market expects Initial Claims to show 310K versus 312K previous.
- Personal Income and Spending for May will be released at 8:30am. The market expects Personal Income to show a month-over-month increase of 0.4% versus an increase of 0.3% previous. Consumer Spending is expected to show a month-over-month increase of 0.4% versus a decline of 0.1% previous.
- Kansas City fed Manufacturing Index for June will be released at 11:00am. The market expects 9 versus 10 previous.
Upcoming International Events for Today:
- Japan National Consumer Price Index for May will be released at 7:30pm EST. The market expects a year-over-year increase of 3.7% versus an increase of 3.4% previous.
- Japan Jobless Rate for May will be released at 7:30pm EST. The market expects 3.6%, consistent with the previous report.
- China Industrial Profits for May will be released at 9:30pm EST.
The Markets
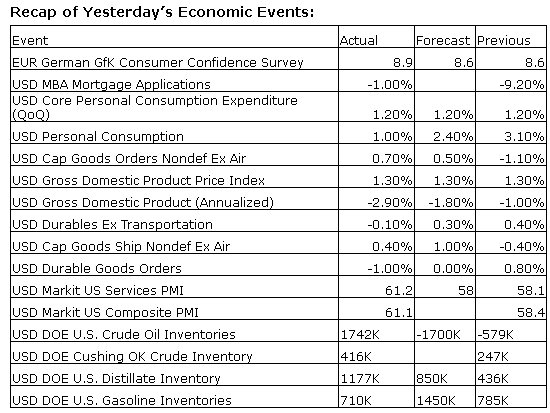
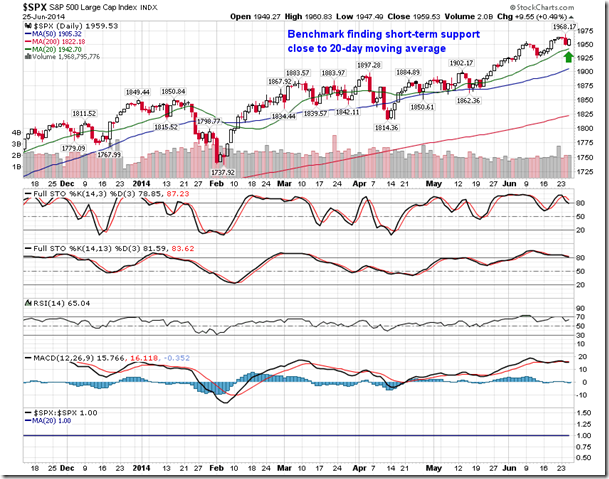
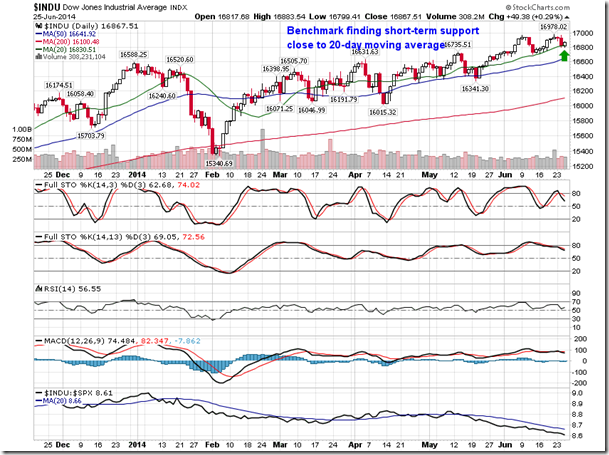
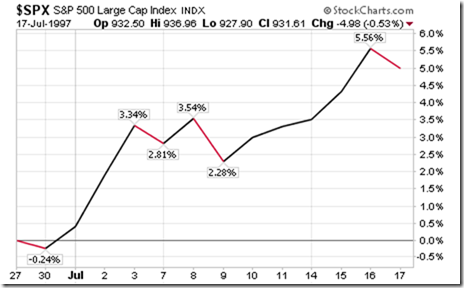
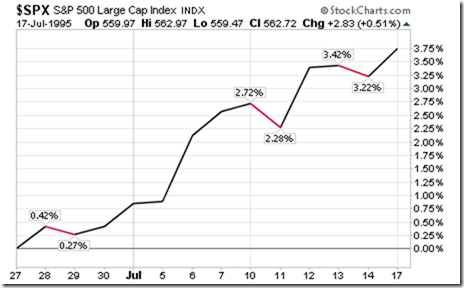
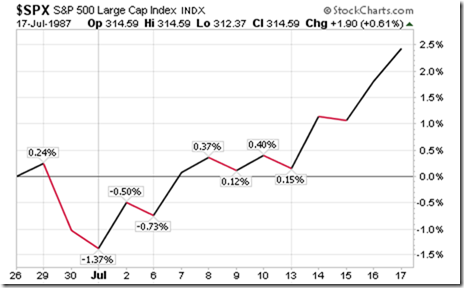
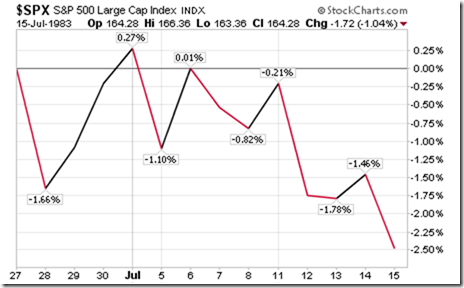
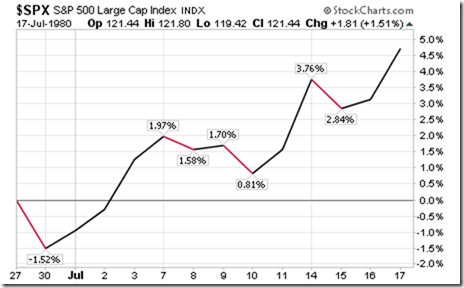
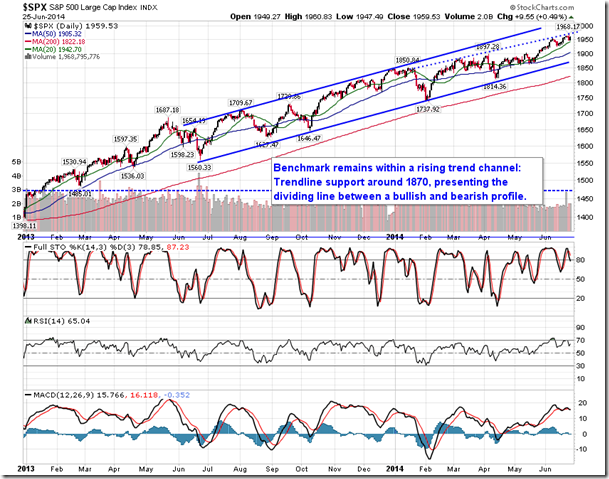
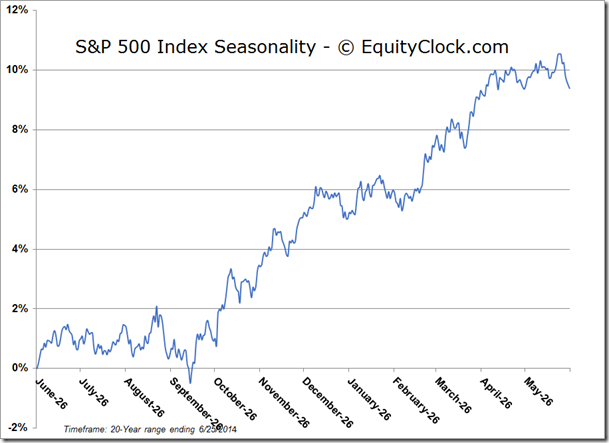
Stocks ended higher on Wednesday, despite one of the weakest non-recessionary GDP reports in decades. The economy is indicated to have contracted by 2.9% in the first quarter, primarily as a result of the adverse winter weather conditions. Still, investors are counting on a rebound for the second quarter of around 4%, which is maintaining the positive momentum and optimism in equity markets. The S&P 500 Index and Dow Jones Indusrtial Average bounced from around their rising 20-day moving average lines, keeping the short-term positive trend intact. As mentioned in yesterday’s report, equity markets are entering the “summer rally” period where gains are common over the last few days of June through the first couple of weeks of July. Over the past 50 years, the S&P 500 index has averaged a return of 1.08% between June 27th and July 17th. The trade has been profitable in 34 of the past 50 periods (68%); 22 of the past 30 periods (73.3%) have ended with gains averaging 1.20%. The start of July offers a number of positive influences, including beginning of month and quarter fund inflows, upbeat sentiment surrounding the Independence Day holiday and the start of summer, and anticipation of quarterly earnings reports that typically start to be released by mid-month. Volumes are generally lower over this period as traders start taking their summer vacations, often limiting significant directional bets on the market and thereby allowing buyers to exceed sellers over the three week period.
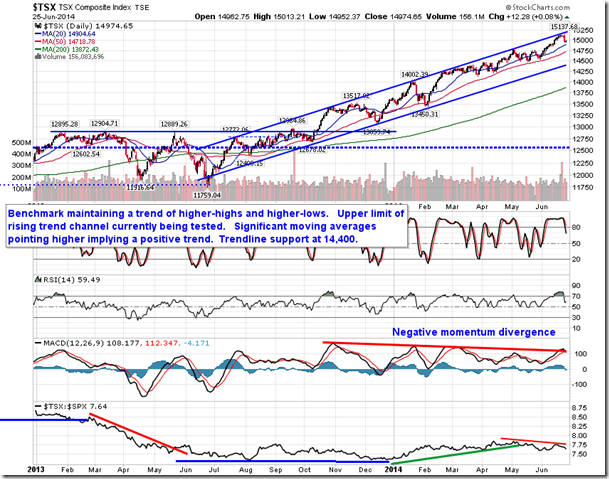
Gains are similarly upbeat for Canadian stocks over the next three weeks as investors on this side of the border have the added benefit of being able to trade on July 4th when US markets are closed. Between June 27th and July 17th, the PowerShares TSX Composite Low Vol (TO:TLV)has averaged a return of 1.49% since 1980 with positive results recorded in 25 of the past 34 periods (74%); 21 of the past 30 periods (70%) have ended with gains averaging 1.48%. On July 4th alone, the TSX has averaged a gain of 0.23% with positive results realized in 71% of sessions since 1980. The New York Stock Exchange closes early at 1:00pm on July 3rd, reopening the following Monday
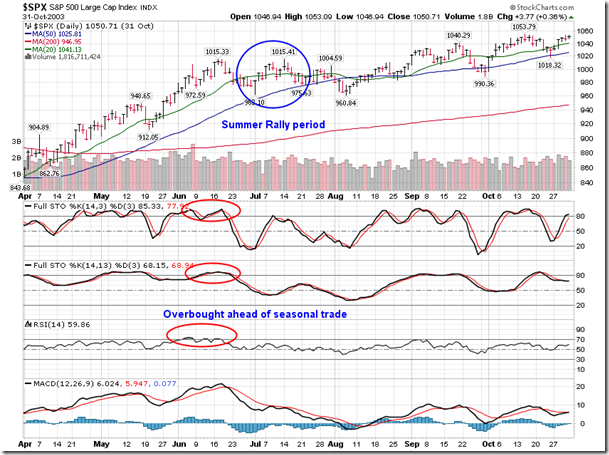
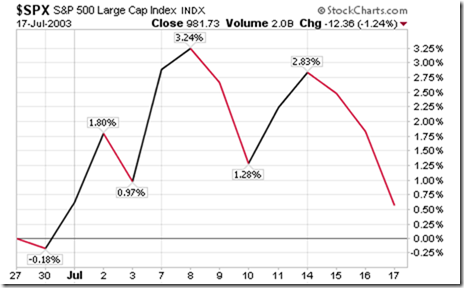
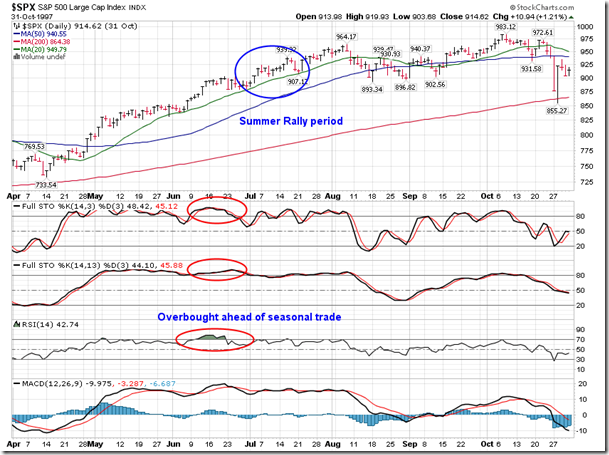
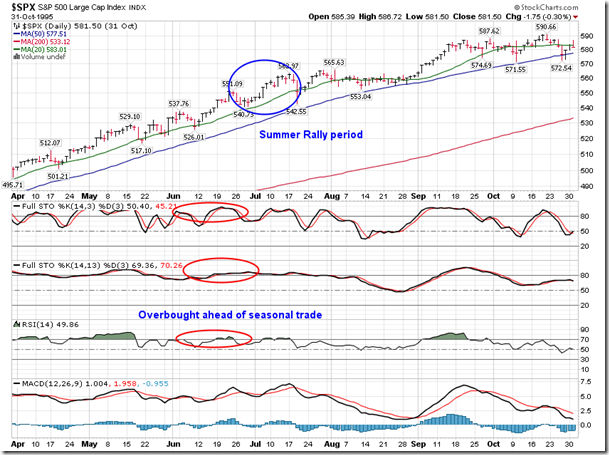
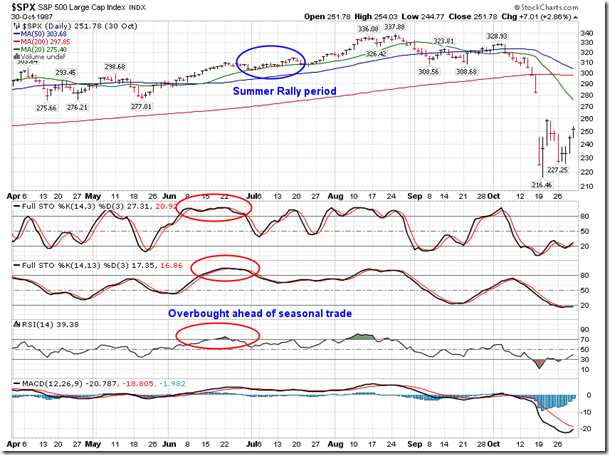
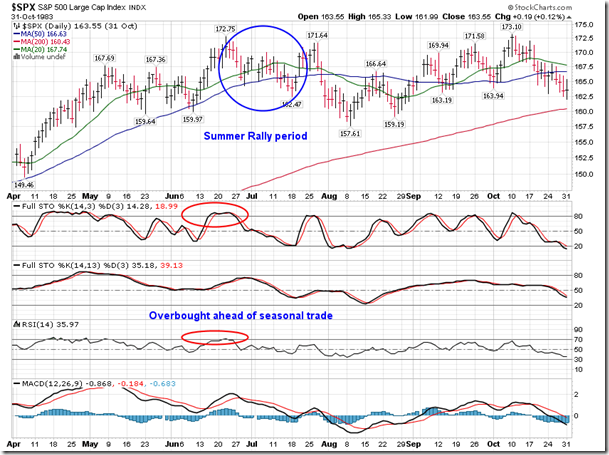
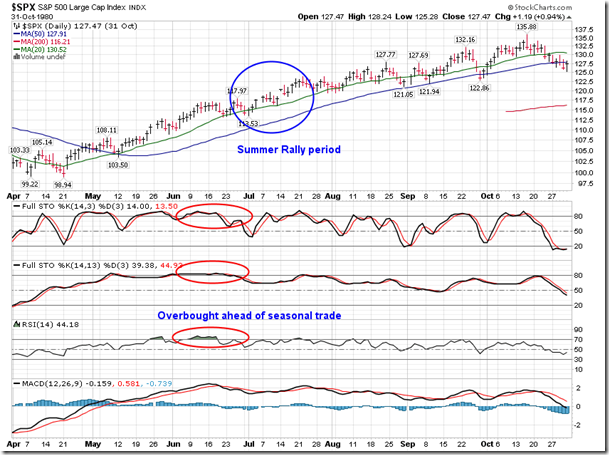
So what are the prospects this year? Equity benchmarks continue to struggle with overbought conditions, potentially limiting upside gains over the weeks ahead. The S&P 500’s Relative Strength Index just crossed below the 70 line within the last few sessions, typically a “sell” trigger as overbought conditions begin to unwind. Looking back at similar instances since 1980 of the Relative Strength Index showing a reading of 70 or higher within 15 days of the end of June, ahead of the “Summer Rally” trade, results remain predominantly positive. Of the six instances that the S&P 500 was significantly overbought just ahead of the seasonal trade, 5 still produced gains during the three week stretch at the end of June and beginning of July. Overbought conditions can be a limiting factor, however, it does not preclude further gains in equity benchmarks.
Charts of S&P 500 around and during the “Summer Rally” period – instances shown are all of the years since 1980 when the benchmark was overbought, according to RSI, within 15 days of June month-end:
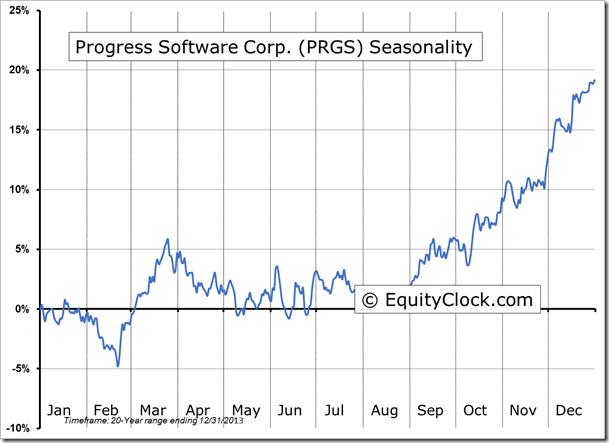
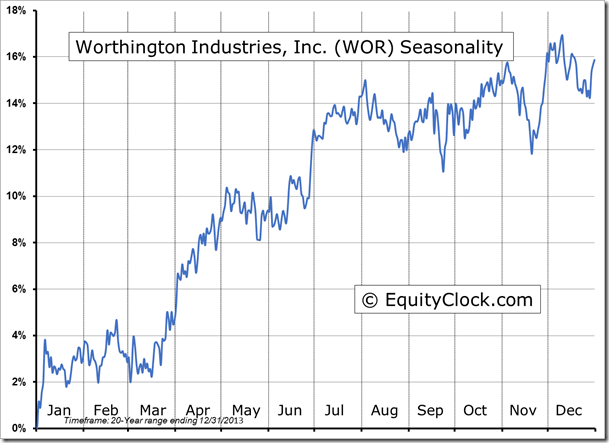
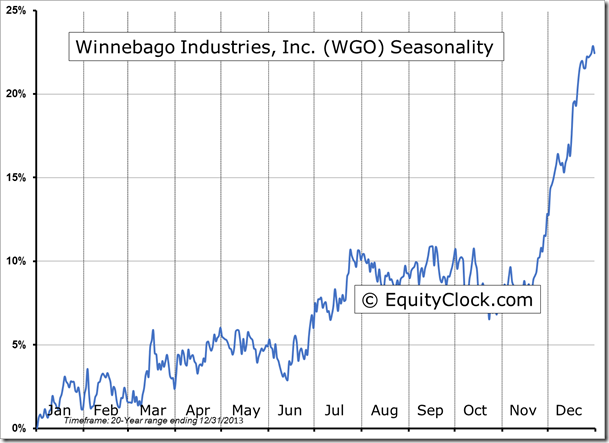
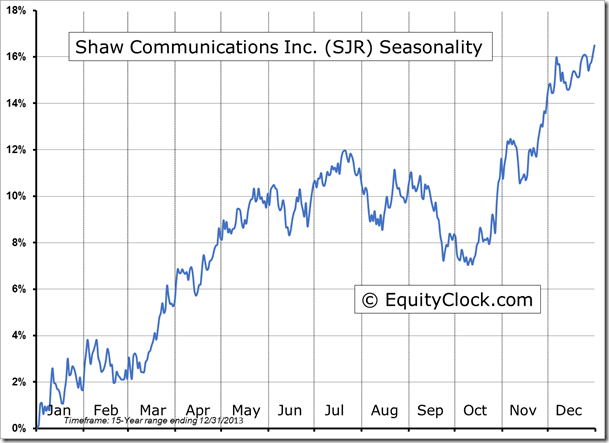
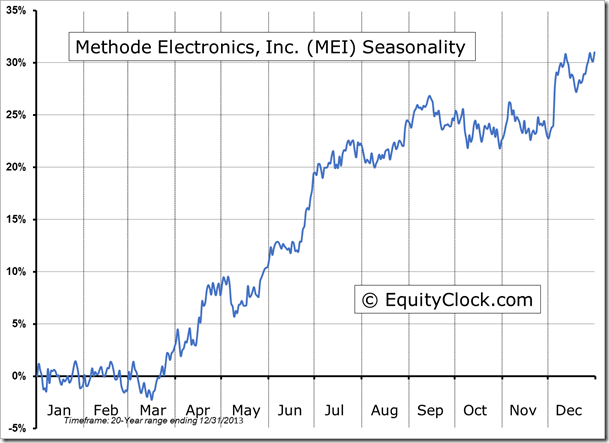
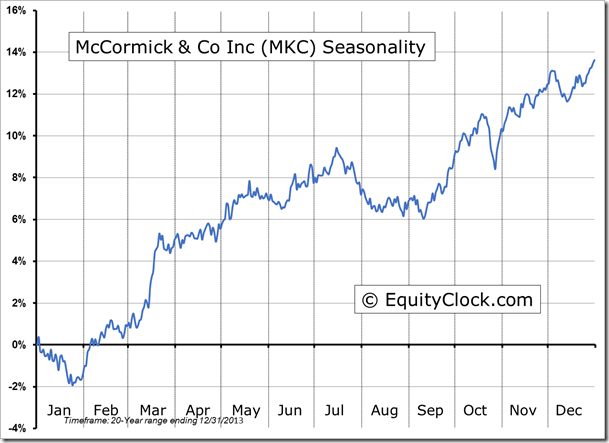
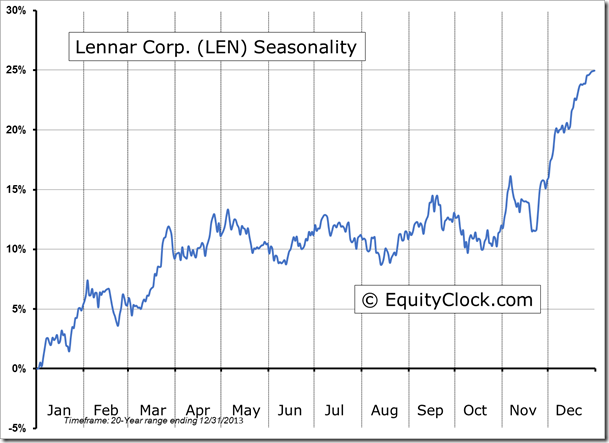
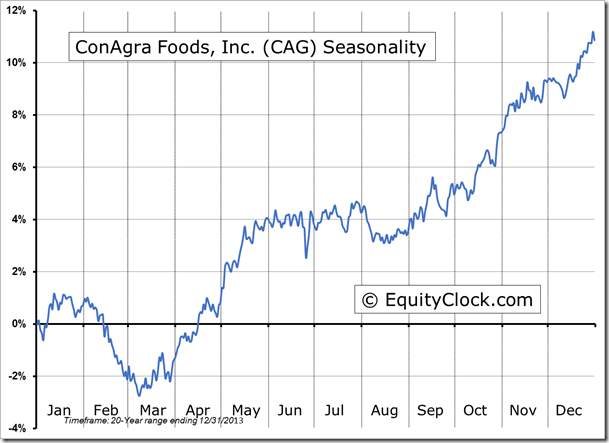
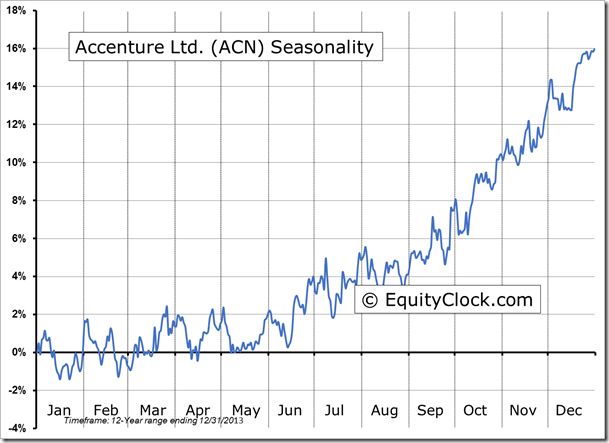
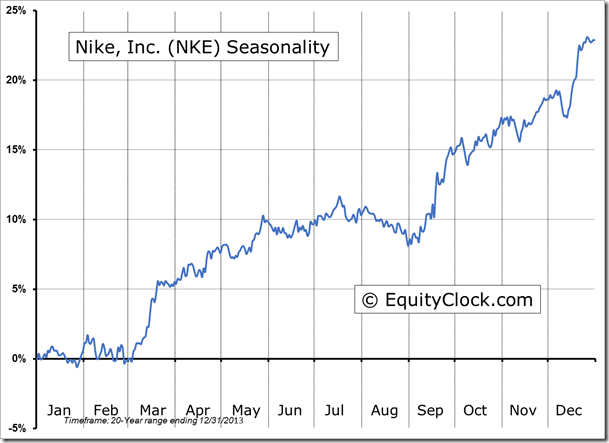
Seasonal charts of companies reporting earnings today:
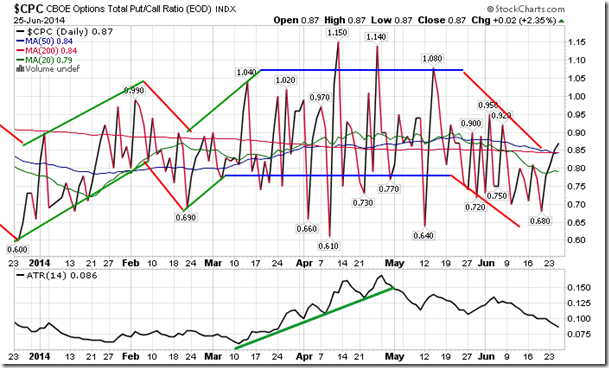
Sentiment on Wednesday, as gauged by the put-call ratio, ended bullish at 0.87.
S&P 500 Index
TSE Composite
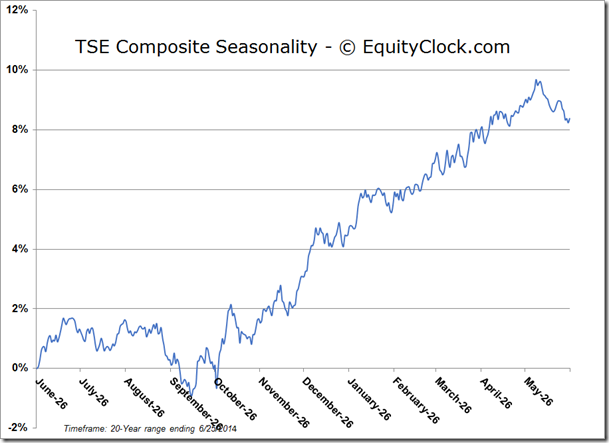
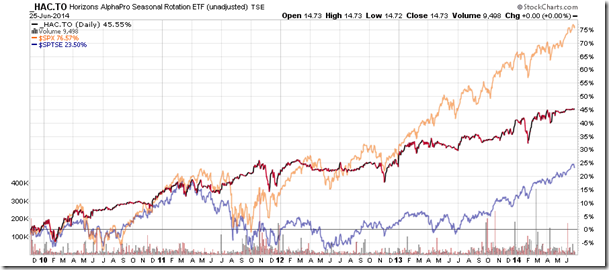
Horizons Seasonal Rotation ETF (TO:HAC)
- Closing Market Value: $14.73 (unchanged)
- Closing NAV/Unit: $14.71 (up 0.05%)
Performance*
| 2014 Year-to-Date | Since Inception (Nov 19, 2009) | |
| HAC.TO | 2.87% | 47.1% |
* performance calculated on Closing NAV/Unit as provided by custodian
