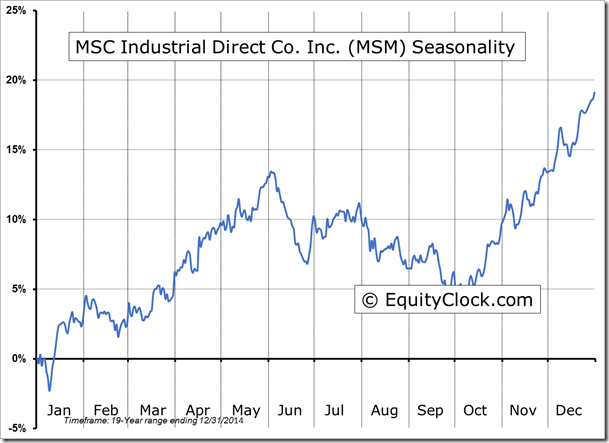
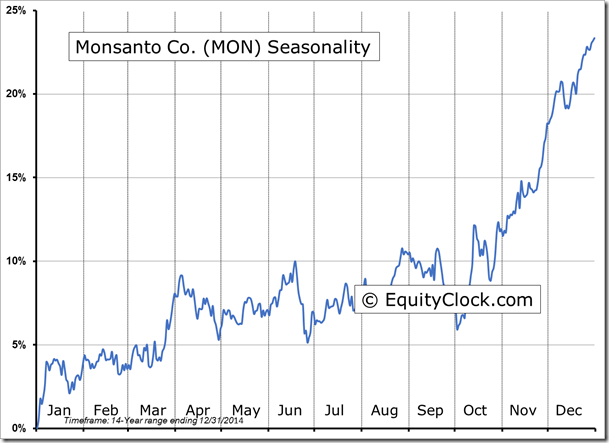
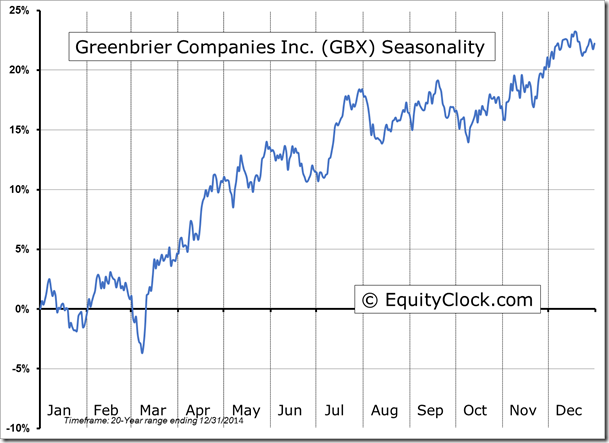
**NEW** As part of the ongoing process to offer new and up-to-date information regarding seasonal and technical investing, we are adding a section to the daily reports that details the stocks that are entering their period of seasonal strength, based on average historical start dates. Stocks highlighted are for information purposes only and should not be considered as advice to purchase or to sell mentioned securities. As always, the use of technical and fundamental analysis is encouraged in order to fine tune entry and exit points to average seasonal trends.
Stocks Entering Period of Seasonal Strength Today:
-
No stocks identified for today
The Markets
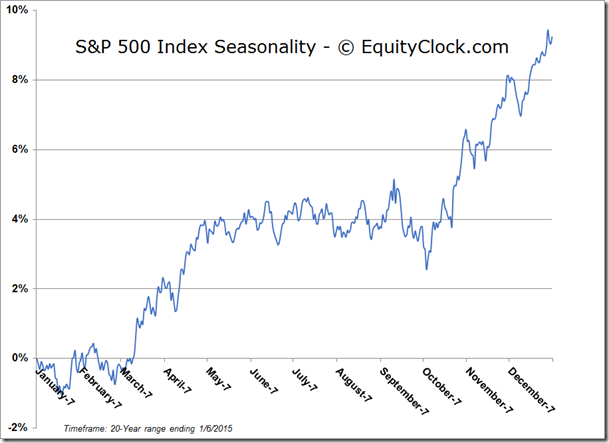
Stocks ended lower for a fifth straight session as the price of oil continued charting its parabolic decline. Year-to-date, the S&P 500 Index is down by 2.73%, the weakest start to the year, after three sessions, since 2008 when the large-cap benchmark posted a loss of 3.86%. Following that rough start seven years ago, the benchmark went on to post a decline of 38.5% by the time the year was through, fuelling the recession that the world economy is still trying to recover from. Over the last 60 years, there has been four instances of losses greater than 2.73% after the first three trading days, including the 2008 event: 2008 and 2000 resulted in sizeable full year losses, while 1991 and 1982 resulted in impressive full year gains. It remains premature to speculate on the kind of year 2015 will be for equity markets based on the first few days of trading. With earnings season ahead of us, investors are more willing to reallocate portfolios to protect themselves from any unexpected results, as was the case last earnings season in October. Given the shock of the freefall in Oil prices, the spin-off impact on companies with exposure to the energy sector remains fairly unknown, leaving investors uneasy. Fourth quarter earnings start to roll with full force next week.
| Years with steep declines to start the year |
||
| Year | Return after 3 trading sessions | Full year return |
| 2015 | -2.73% | |
| 2008 | -3.86% | -38.49% |
| 2000 | -4.57% | -10.14% |
| 1991 | -2.79% | 26.31% |
| 1982 | -2.75% | 14.76% |
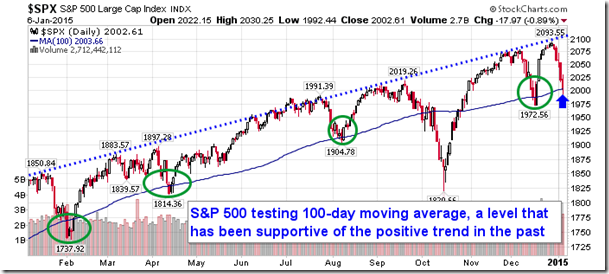
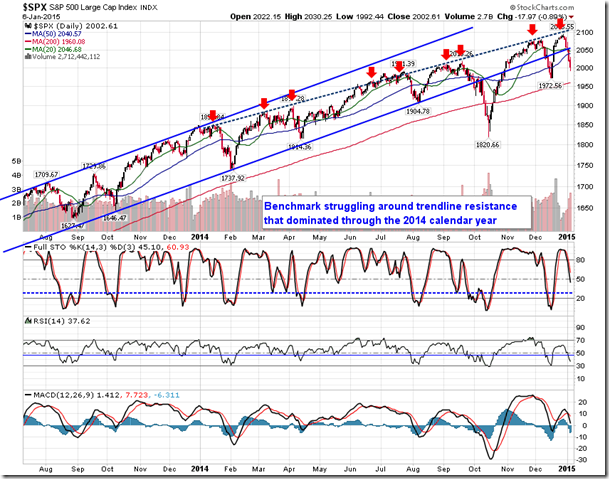
Turning to the technicals, the S&P 500 Index is hovering around its 100-day moving average, a level that in the past has been supportive of the longer-term positive trend. A decisive move below this level could raise concerns of a more pronounced decline ahead, perhaps leading to the long overdue correction of 10% or more; October’s pullback fell just short of this correction target. With support apparent around the 100-day moving average and trendline resistance now hovering around 2100, a 100-point trading range appears to have established; assuming the upper and lower limits are maintained, buying support and selling resistance could yield profitable results. Keep an eye on support, including the December low at 1972, over the days ahead.
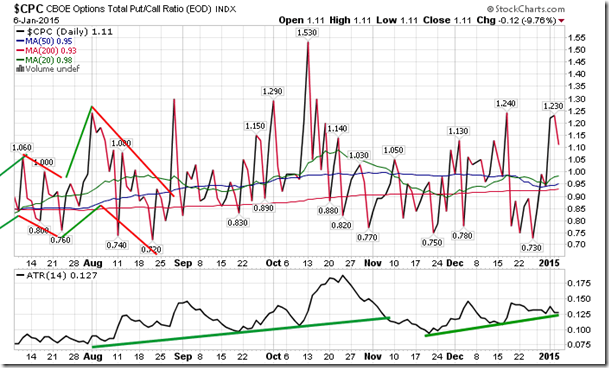
Sentiment on Tuesday, as gauged by the put-call ratio, ended bearish at 1.11
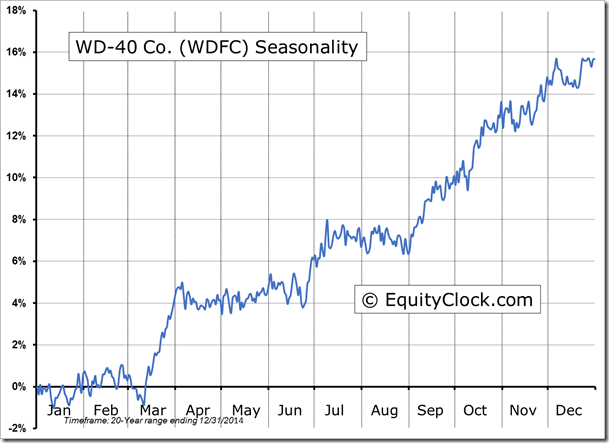
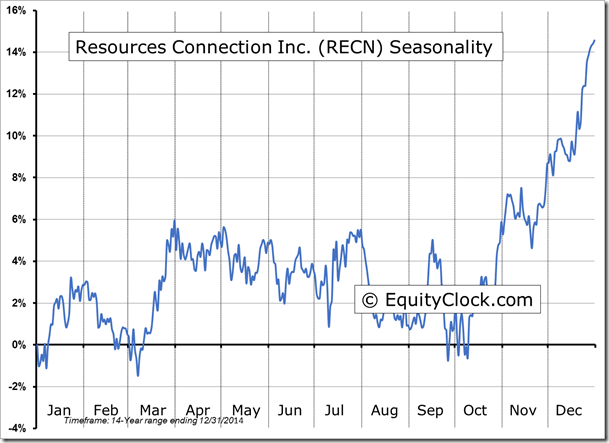
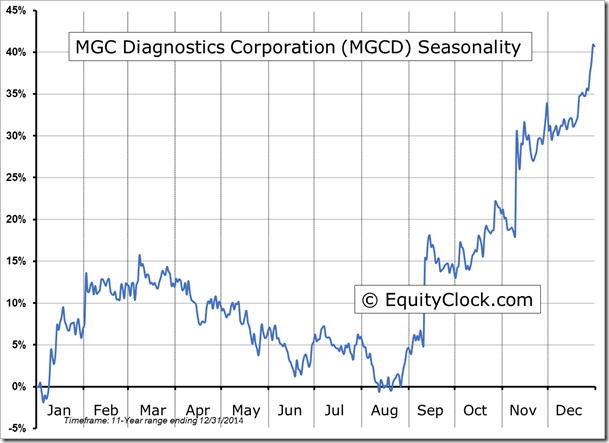
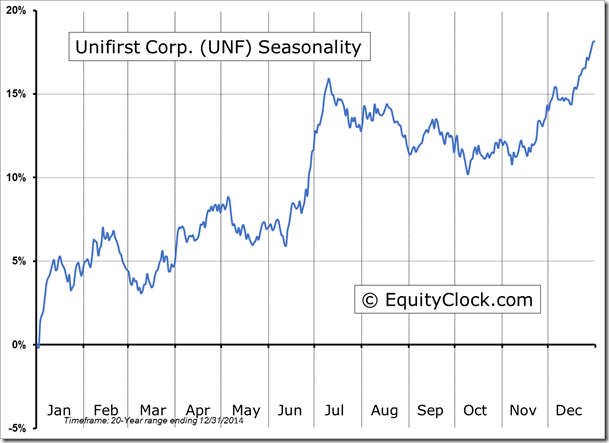
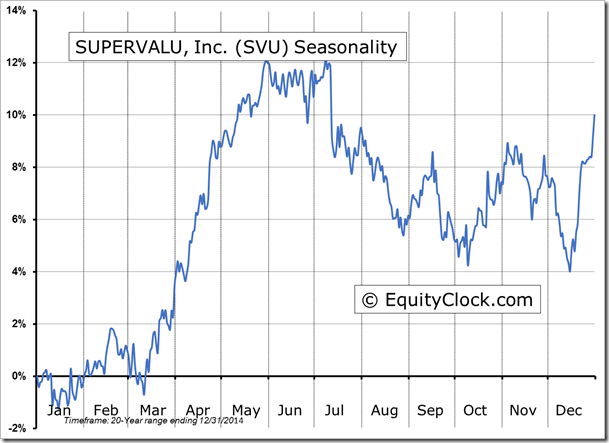
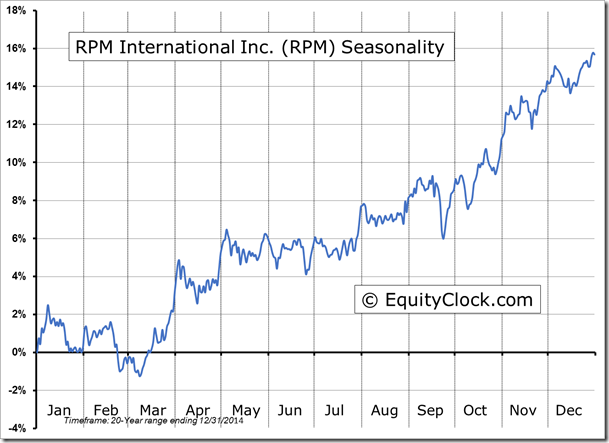
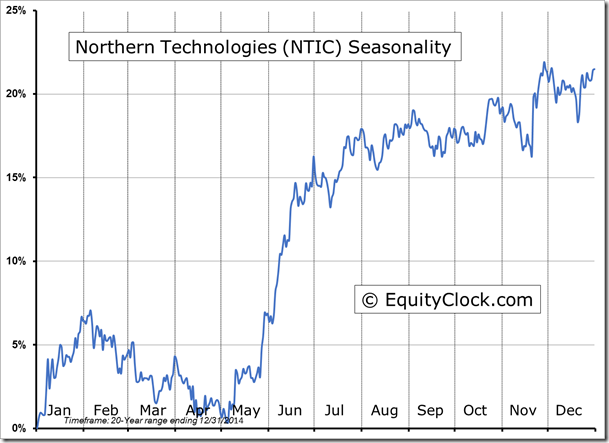
Seasonal charts of companies reporting earnings today:
S&P 500 Index
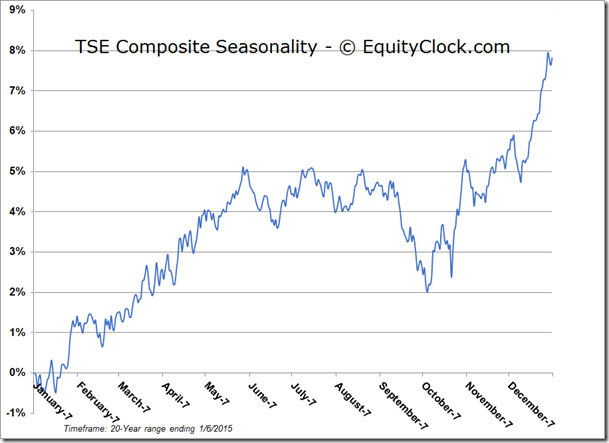
TSE Composite
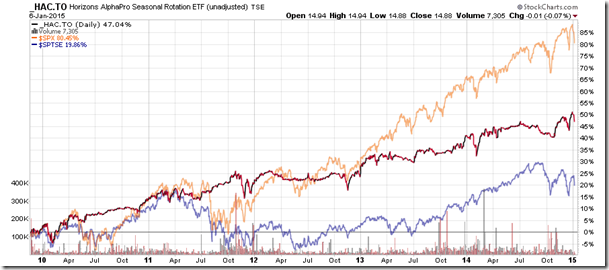
Horizons Seasonal Rotation ETF (TO:HAC)
- Closing Market Value: $14.88 (down 0.07%)
- Closing NAV/Unit: $14.84 (down 0.60%)
Performance*
| 2015 Year-to-Date | Since Inception (Nov 19, 2009) | |
| HAC.TO | -1.92% | 48.4% |
* performance calculated on Closing NAV/Unit as provided by custodian
