Upcoming US Events for Today:
- Retail Sales for June will be released at 8:30am. The market expects a month-over-month increase of 0.6% versus an increase of 0.3% previous. Less Autos and Gas, the increase is expected to show 0.5% versus no change (0.0%) previous.
- Empire State Manufacturing Survey for July will be released at 8:30am. The market expects 17.80 versus 19.28 previous.
- Import/Export Price for June will be released at 8:30am.
- Business Inventories for May will be released at 10:00am. The market expects a month-over-month increase of 0.6%, consistent with the previous report.
- Janet Yellen delivers her semi-annual monetary policy testimony to Senate Banking Committee at 10:00am.
Upcoming International Events for Today:
- Great Britain CPI for June will be released at 4:30am EST. The market expects a year-over-year increase of 1.6% versus an increase of 1.5% previous.
- German ZEW Survey for July will be released at 5:00am EST. The market expects the Current Situation to show 67.4 versus 67.7 previous. Economic Sentiment is expected to show 28.2 versus 29.8 previous.
- China GDP for the Second Quarter will be released at 10:00pm EST. The market expects a year-over-year increase of 7.4%, consistent with the previous report.
- China Industrial Production for June will be released at 10:00pm EST. The market expects a year-over-year increase of 9.0% versus an increase of 8.8% previous.
- China Retail Sales for June will be released at 10:00am EST. The market expects a year-over-year increase of 12.4% versus an increase of 12.5% previous.
The Markets
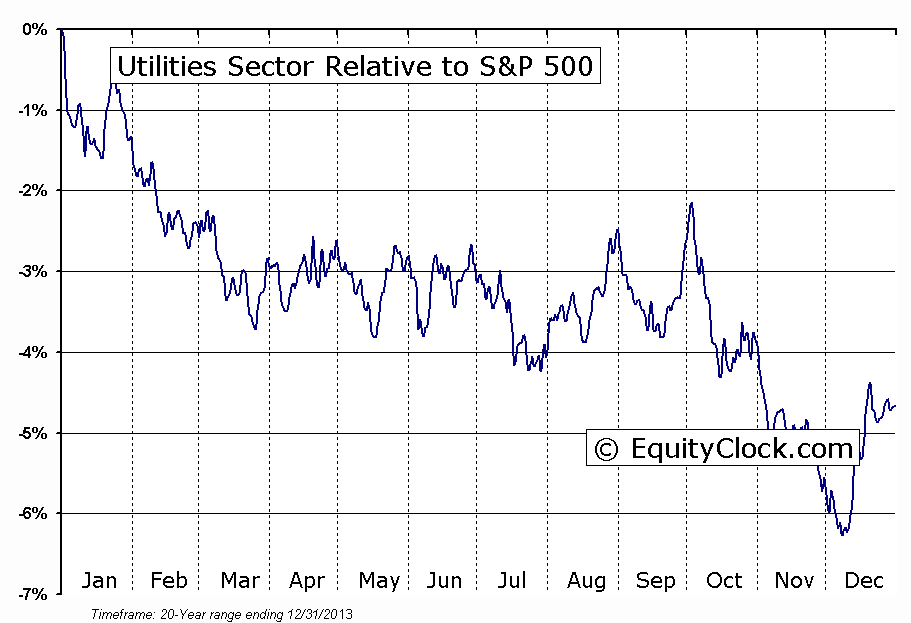
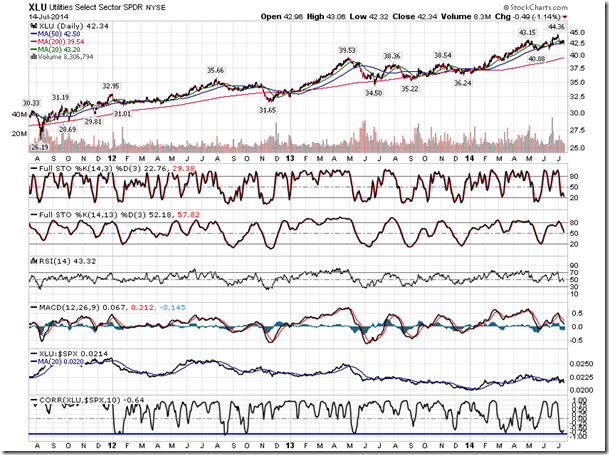
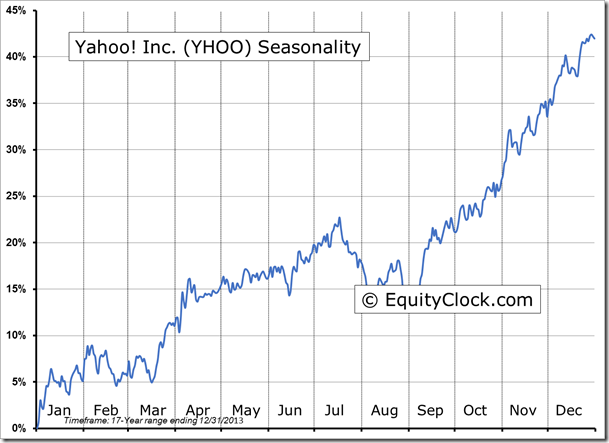
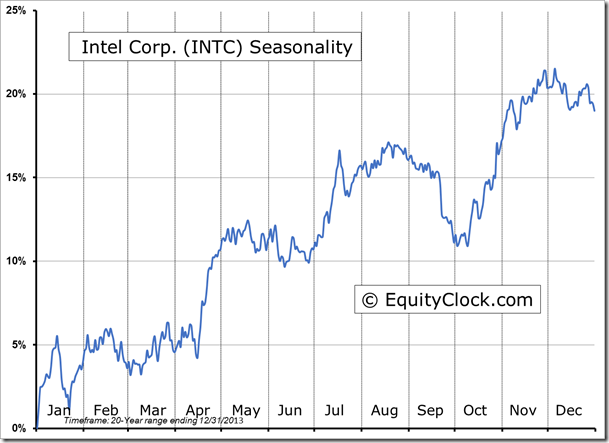
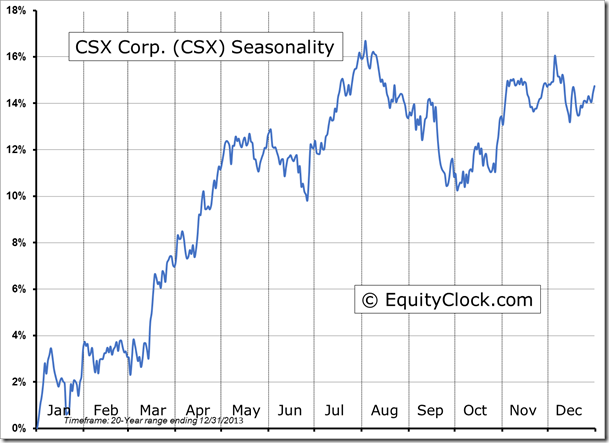
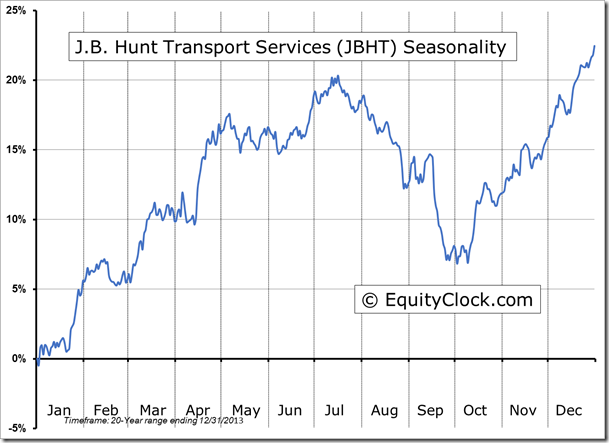
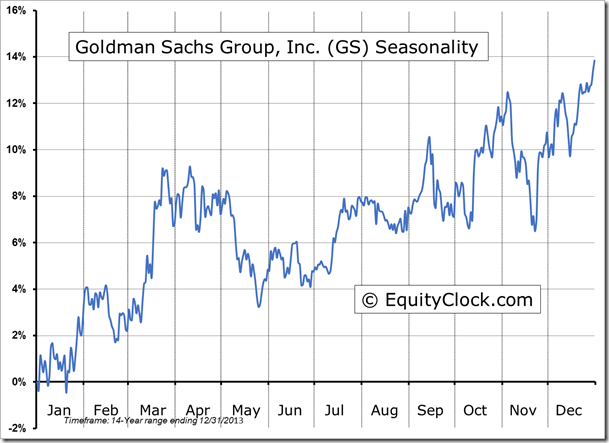
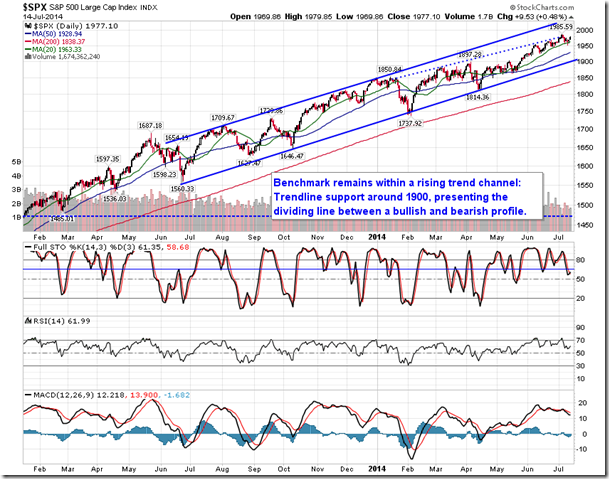
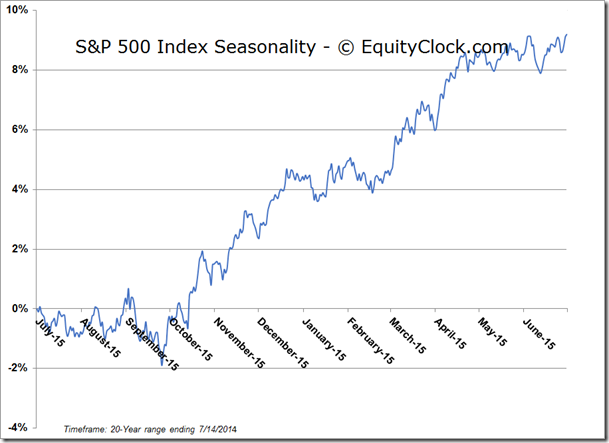
Stocks gained on Monday, recouping some of the losses accumulated last week, as investors remain upbeat on the earnings season ahead. Notable earnings reports to be released today include Goldman Sachs Group Inc (NYSE:GS), Johnson & Johnson (NYSE:JNJ), J P Morgan Chase & Co (NYSE:JPM), CSX Corporation (NYSE:CSX), Intel Corporation (NASDAQ:INTC), and Yahoo! Inc (NASDAQ:YHOO), the seasonal charts of which are included later in this report. The gains on the session pushed the Dow Jones Industrial Average to a new all-time intraday high as short-term support at a rising 20-day moving average remains easily apparent. Utility stocks were one of the few laggards during Monday’s session, trading firmly lower as the market recorded healthy gains; the more defensive USPDR Select Sector - Utilities (NYSE:XLU) has seen its 10-day correlation with the market fall to one of the lowest levels since 2012 as traders buy and sell the stocks in this space inversely to the direction of the broad market. The Utilities Sector enters a period of seasonal strength in mid-to-late July.
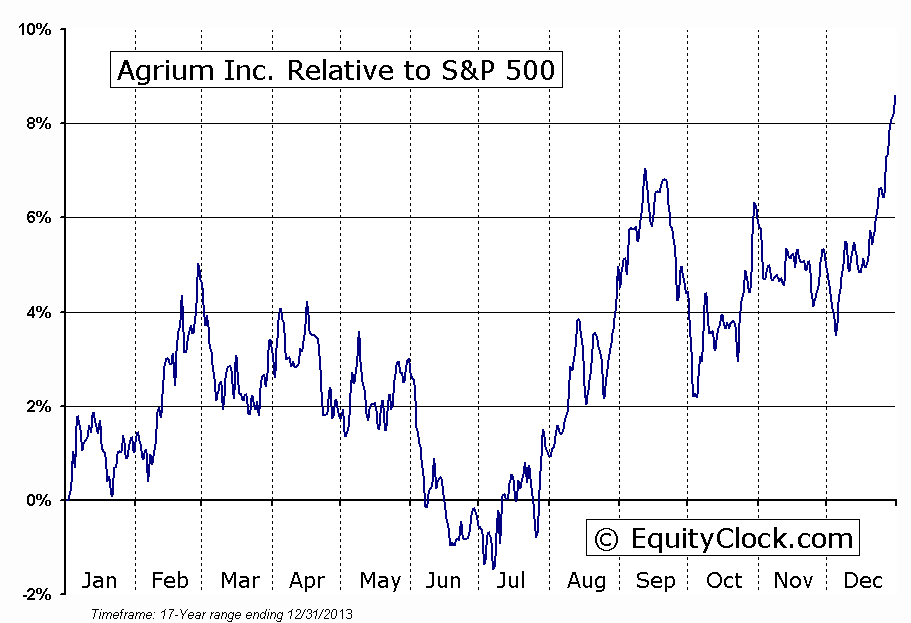
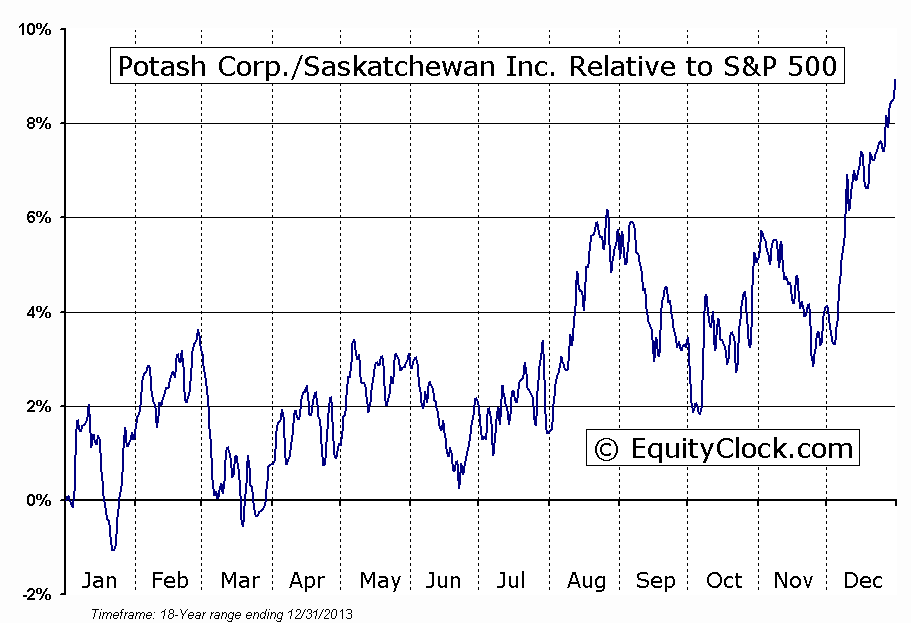
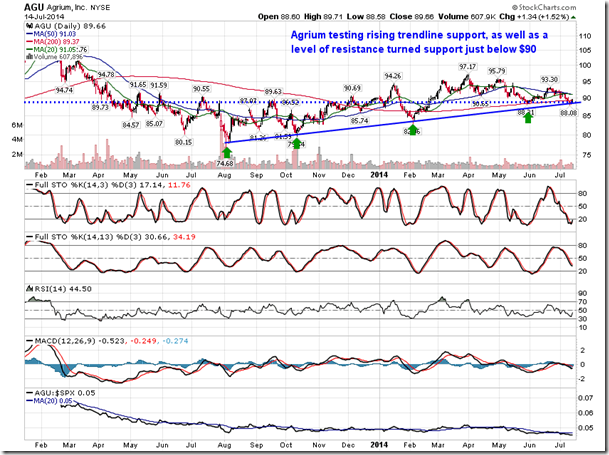
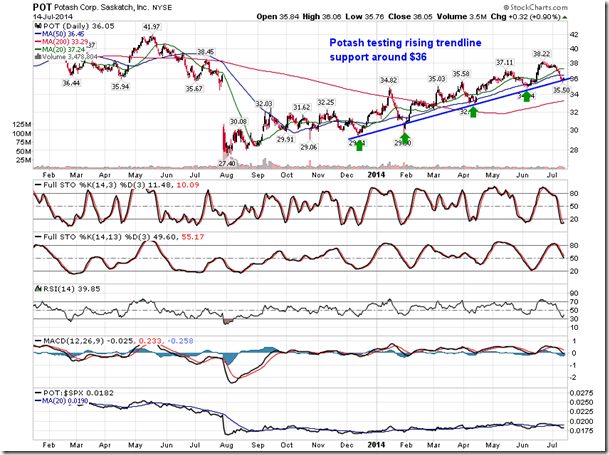
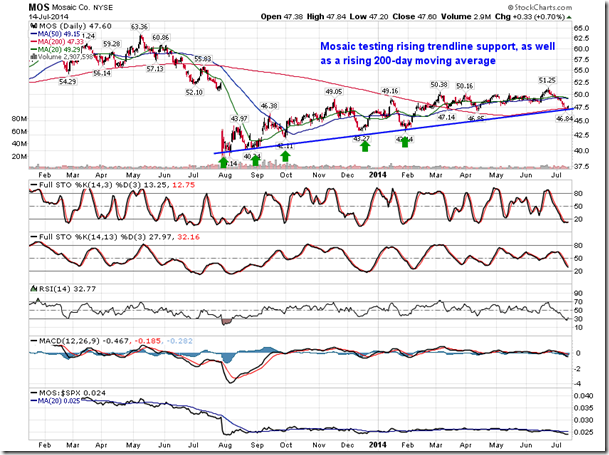
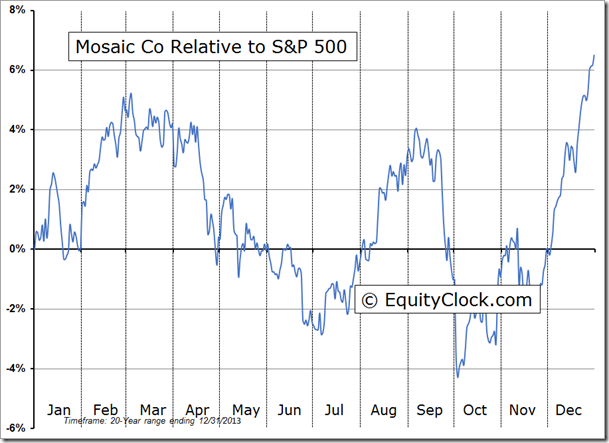
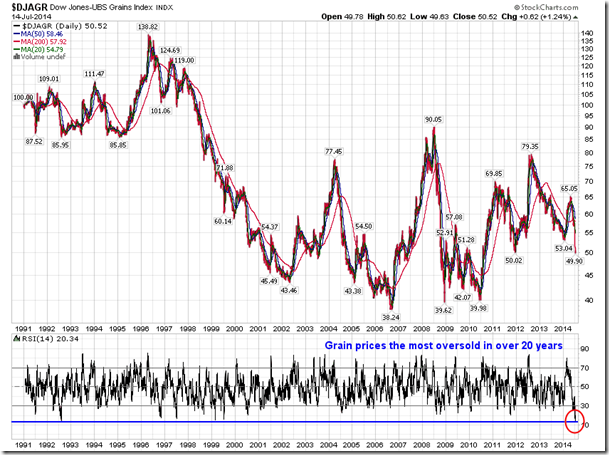
Fertilizer stocks begin their period of seasonal strength at the end of June/beginning of July, however, since the end of June, the stocks in this industry have traded lower, lagging the broad market move as agricultural commodities record significant declines. Fertilizer stocks, including Agrium Inc (NYSE:AGU), Potash Corporation of Saskatchewan (NYSE:POT), and Mosaic Company (NYSE:MOS), are now testing important levels of support, potentially giving investors levels to shoot off of in order to establish long positions for the trade that runs through to mid-September. Each fertilizer stock is testing rising trendline support that has remained intact for almost the past year. Agrium is also testing a level of resistance turned support just below $90. Grain prices have been beaten down over recent weeks, becoming the most oversold, according to the Relative Strength Index, in well over 20 years. Typically, oversold readings such as this leads to selling exhaustion, a precursor to an oversold bounce. Stabilization in grain prices would allow fertilizer stock prices to stabilize as well, conducive to the seasonal gains that are typical over the next two months.
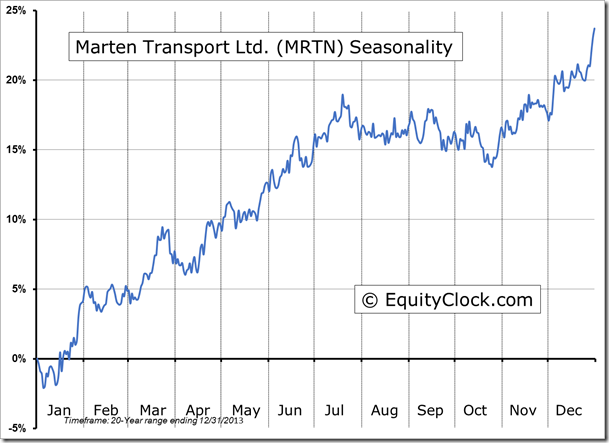
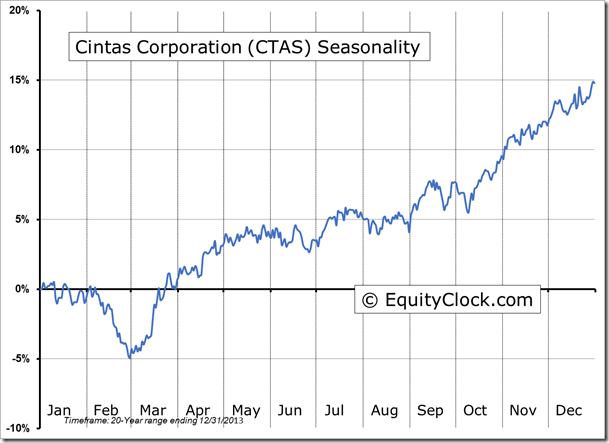
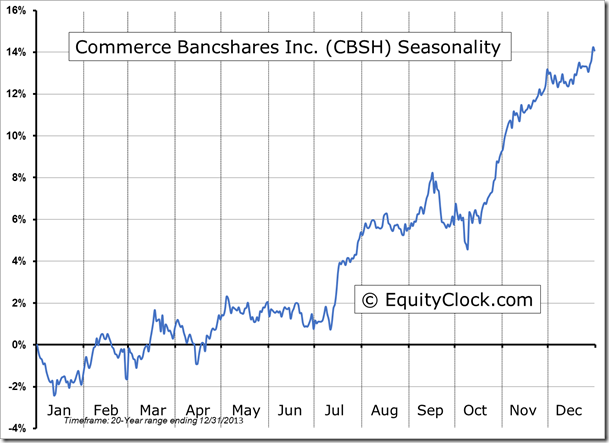
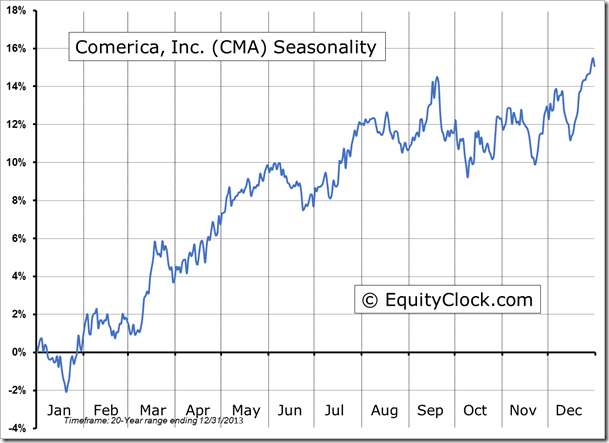
Seasonal charts of companies reporting earnings today:
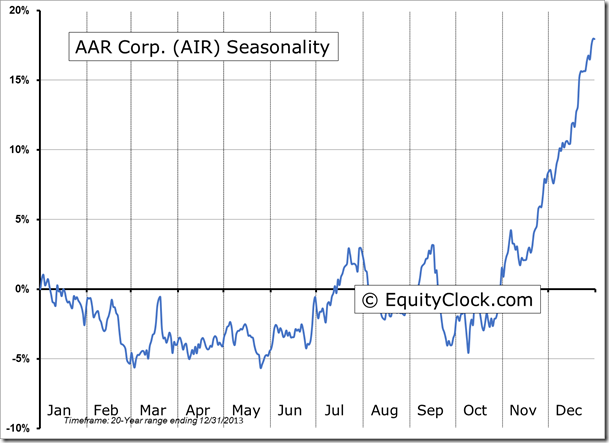
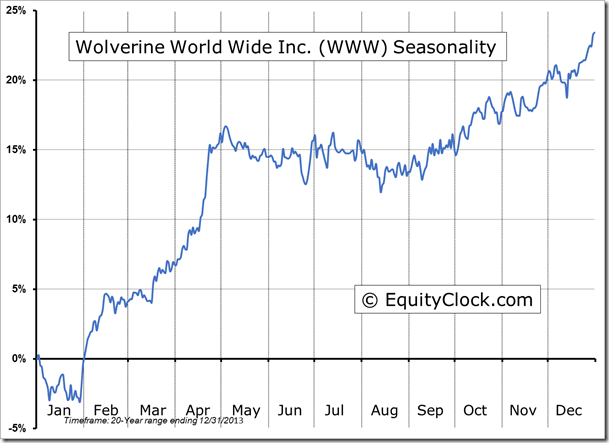
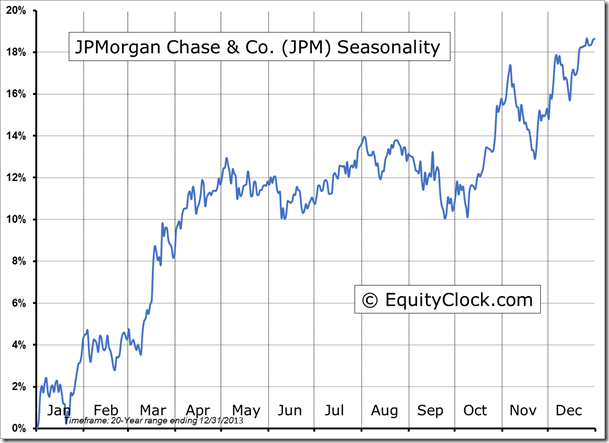
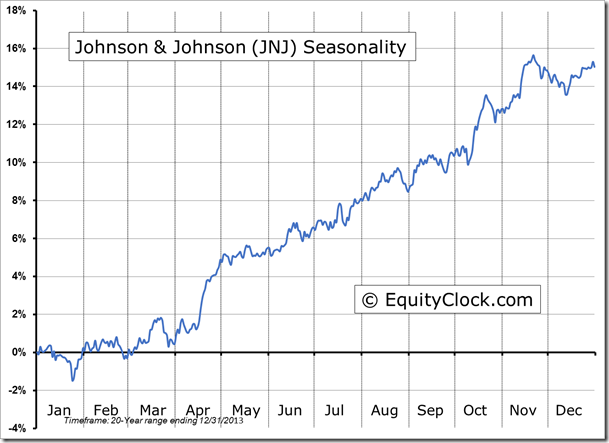
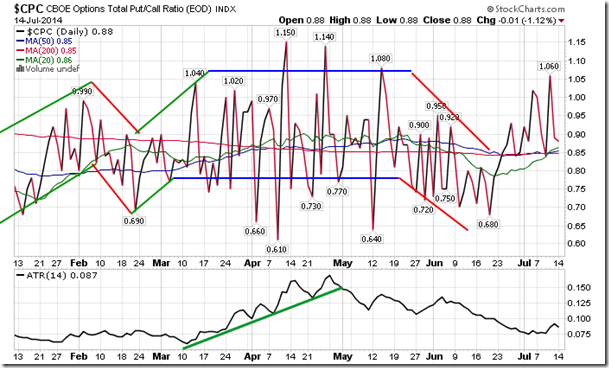
Sentiment on Monday, as gauged by the put-call ratio, ended bullish at 0.88.
S&P 500 Index
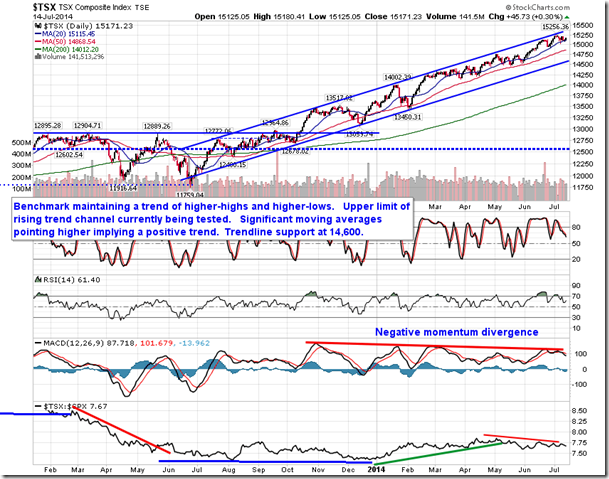
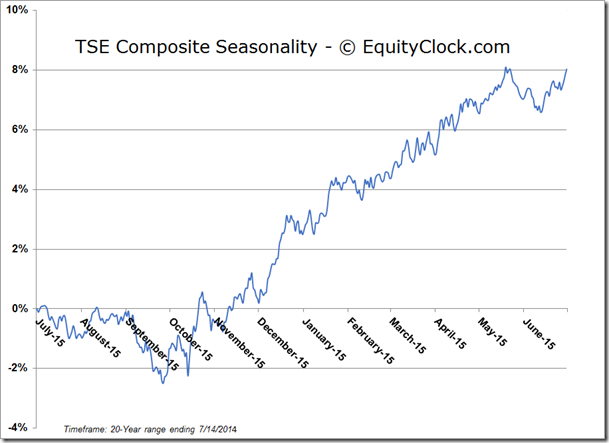
TSE Composite
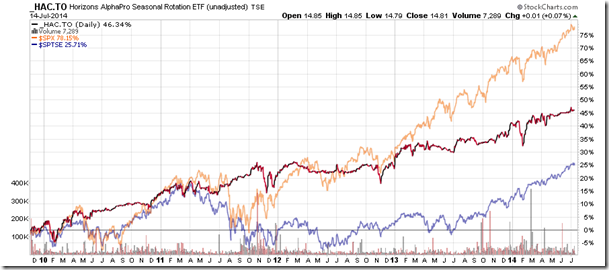
Horizons Seasonal Rotation ETF (TSX:HAC)
- Closing Market Value: $14.81 (up 0.07%)
- Closing NAV/Unit: $14.79 (down 0.02%)
Performance*
| 2014 Year-to-Date | Since Inception (Nov 19, 2009) | |
| HAC.TO | 3.43% | 47.9% |
* performance calculated on Closing NAV/Unit as provided by custodian
