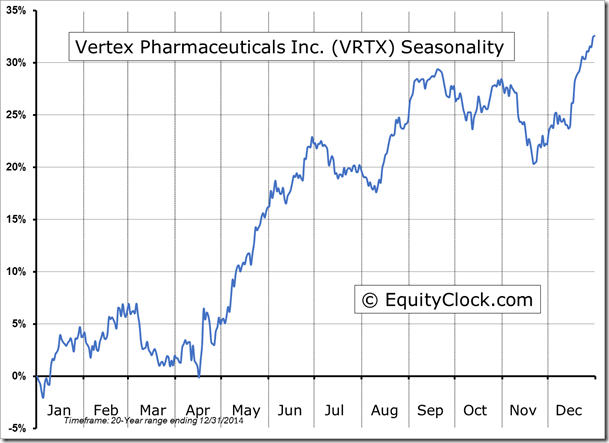
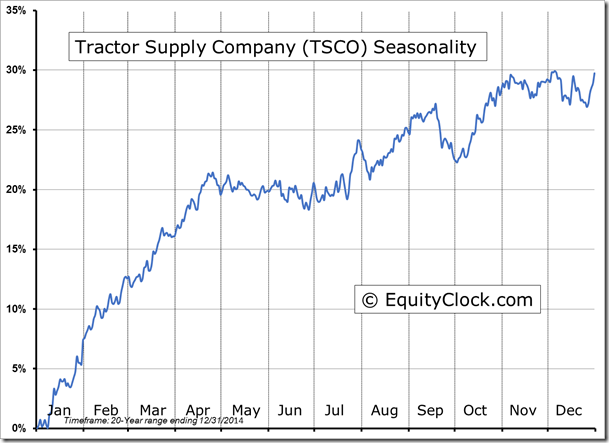
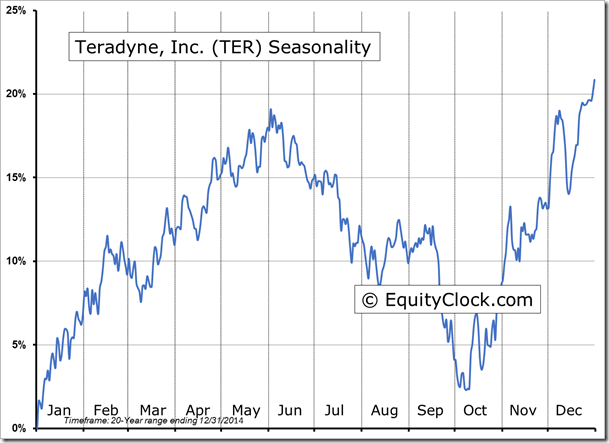
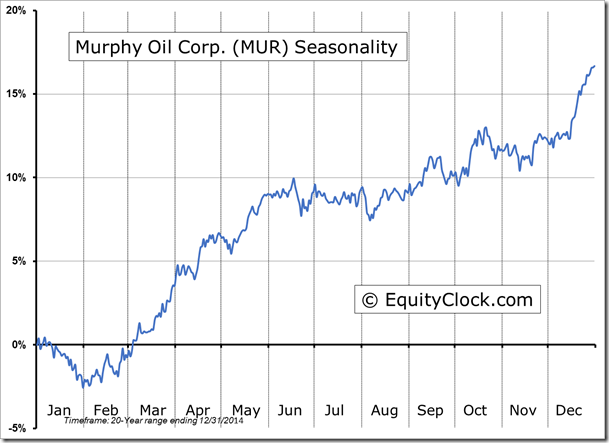
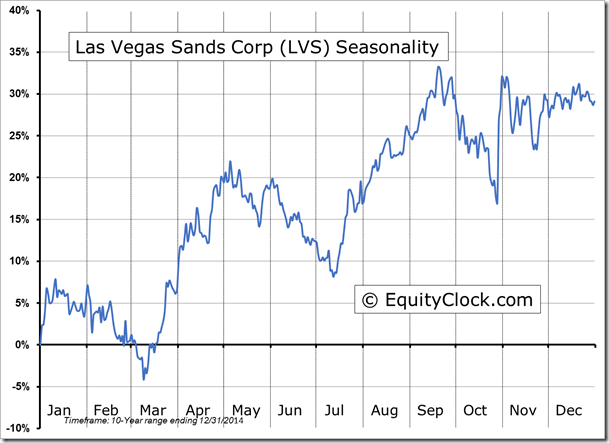
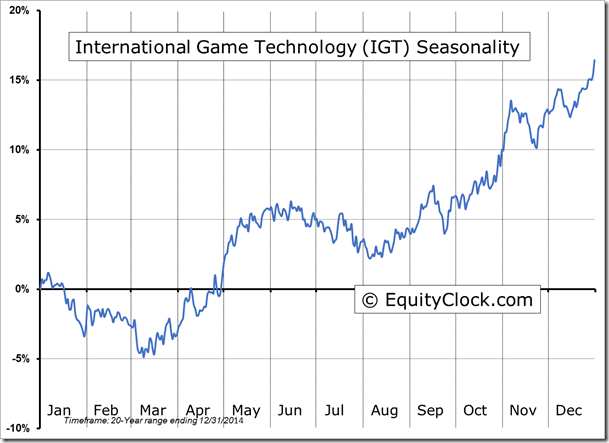
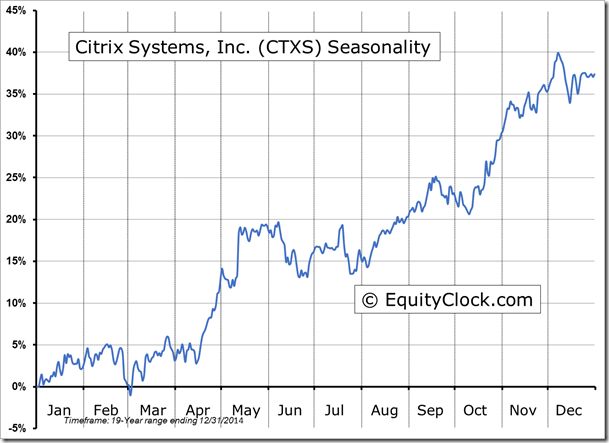
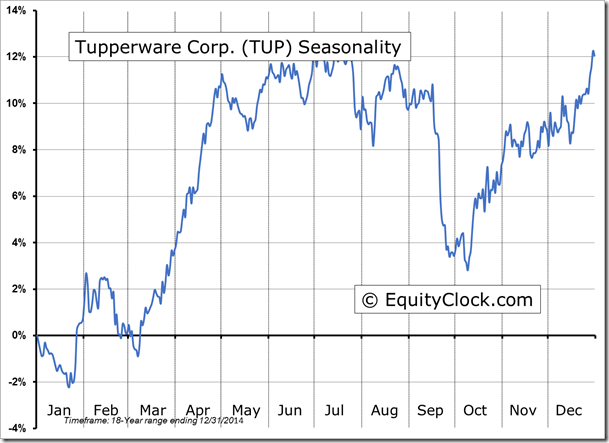
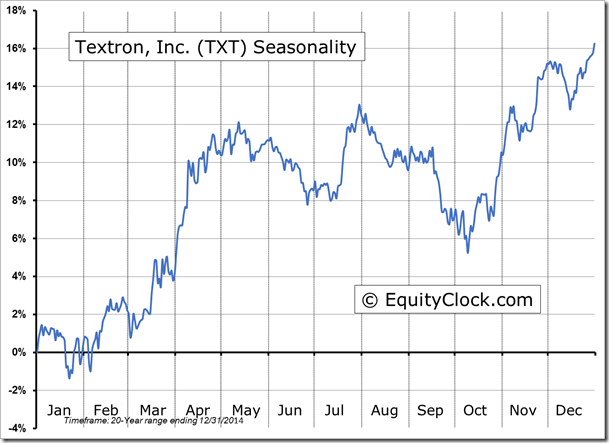
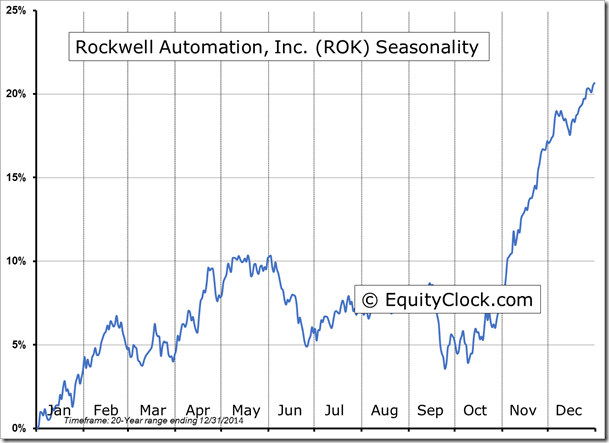
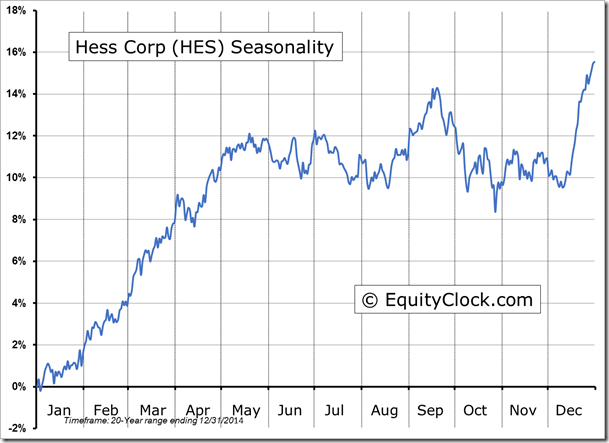
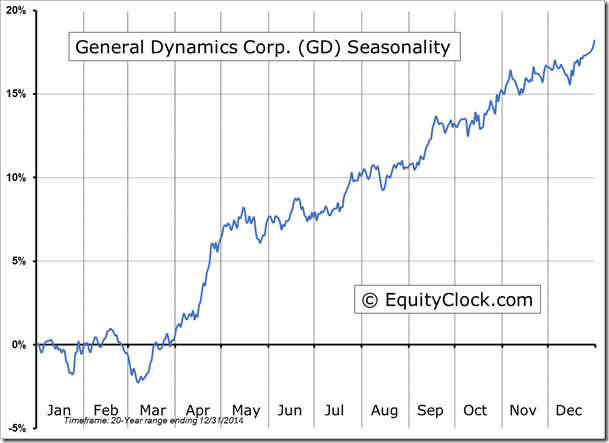
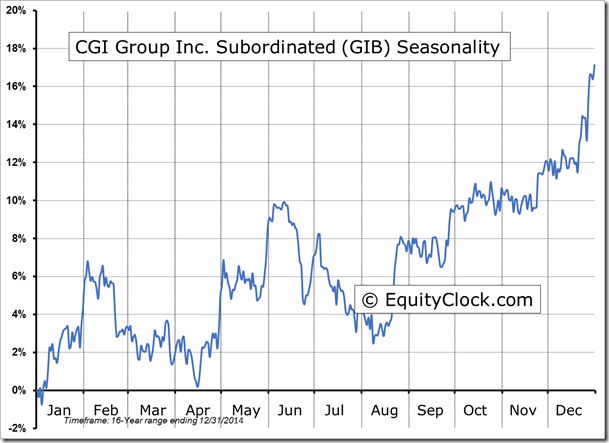
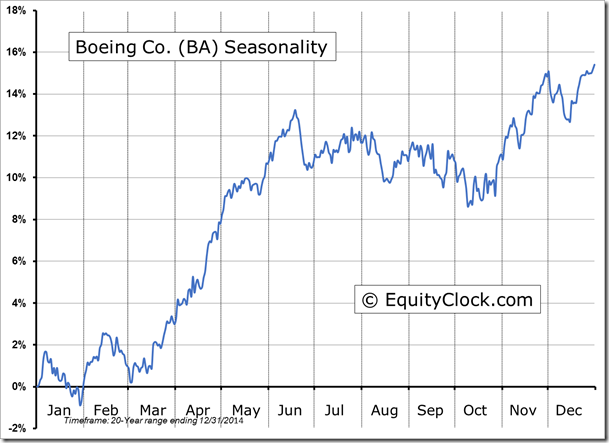
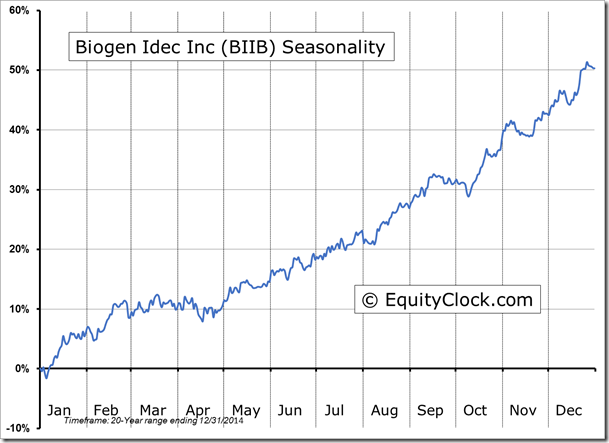
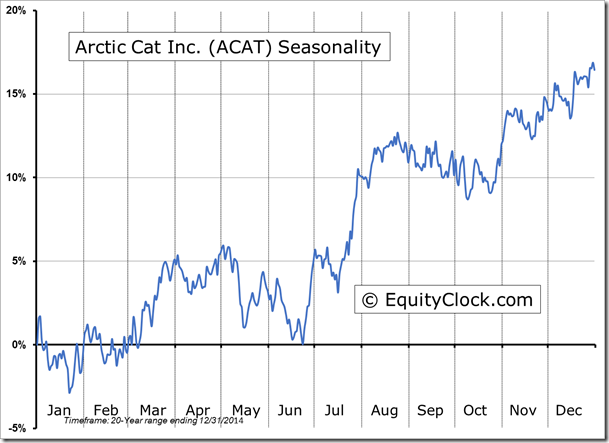
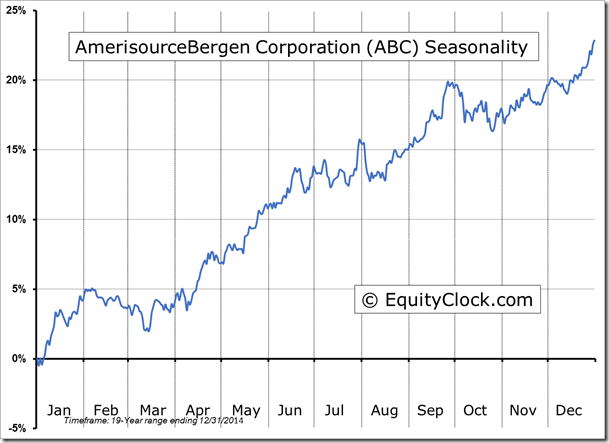
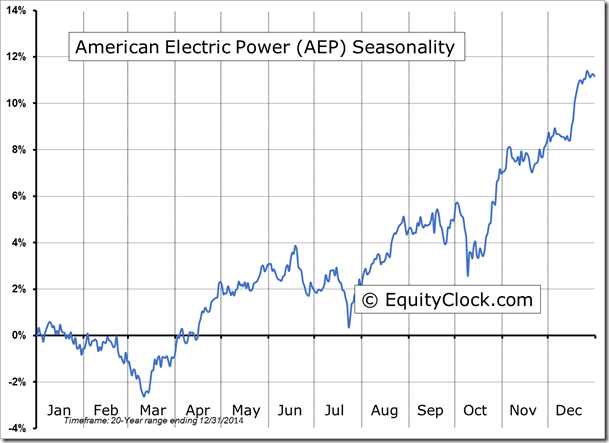
Stocks Entering Period of Seasonal Strength Today:
PACCAR (NASDAQ:PCAR) Seasonal Chart
The Markets
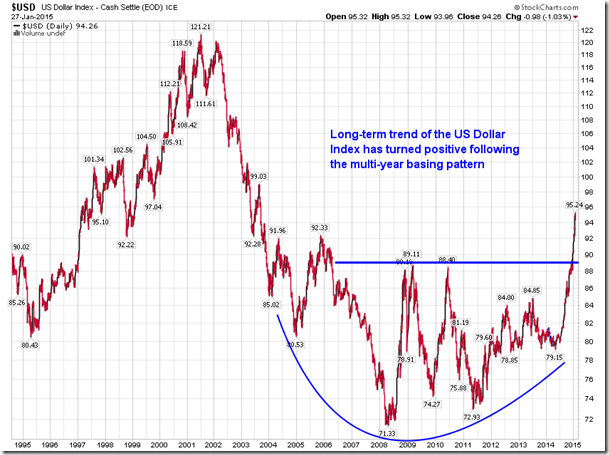
Stocks declined on Tuesday following disappointing earnings from a number of bellwether companies. Procter & Gamble (NYSE:PG)), DuPont (DD), Pfizer (NYSE:PFE), and Microsoft (NASDAQ:MSFT) all traded lower following the release of results; the negative impact of a stronger US Dollar was cited as a detriment to the fourth quarter reports. The currency impact may not be set to end any time soon. Despite the pronounced decline in the US Dollar Index on Tuesday, the trend of the currency benchmark remains firmly positive after charting a significant long-term basing pattern over the past few years.
A strengthening US dollar is now the new norm after over a decade of negative to flat trading. Corporations will be forced to account for this change of trend.The parabolic move in the US Dollar Index suggests that the benchmark is vulnerable to a near-term decline down to levels of support at the 20 and 50-day moving averages. Horizontal support is provided by the broken long-term level of resistance at 89. Seasonally, the US Dollar Index remains in a period of strength through to the end of the first quarter.
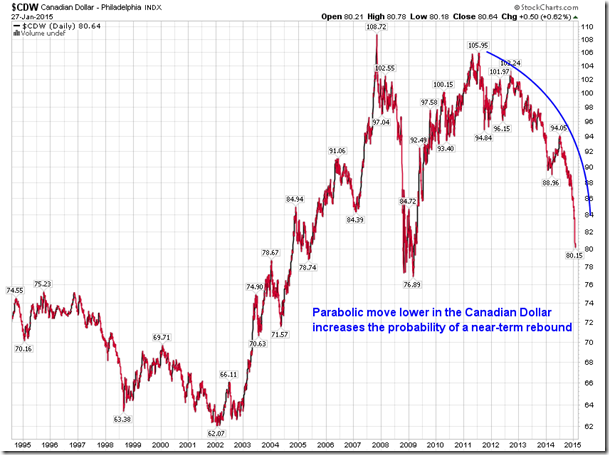
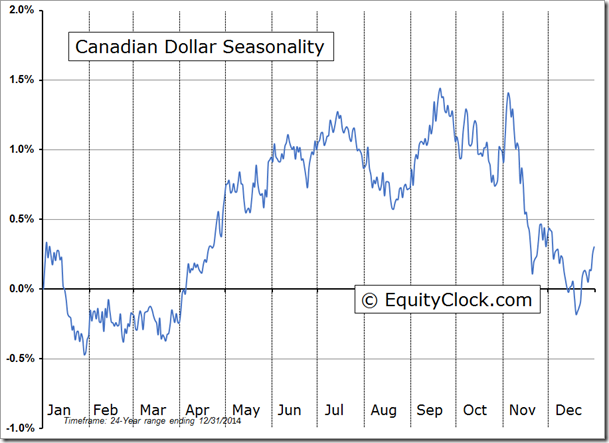
And while the US dollar remains seasonally strong through to the end of March, the period of seasonal weakness for the Canadian dollar has come to an end; the Canadian currency seasonally trades flat, on average, between now and the end of March. Trading inversely to the US Dollar, the currency has charted a parabolic move lower, increasing the probability of a rebound towards levels of resistance at the 20 and 50-day moving averages. Major moving averages (20, 50, and 200-day) continue to point lower, implying negative trends over multiple timescales. The Canadian Dollar tends to follow the same seasonal tendencies as the price of oil, which gains through the spring. With no signs of a bottoming pattern apparent on the chart, as of yet, continued weakness, beyond any short-term rebound, is to be expected.
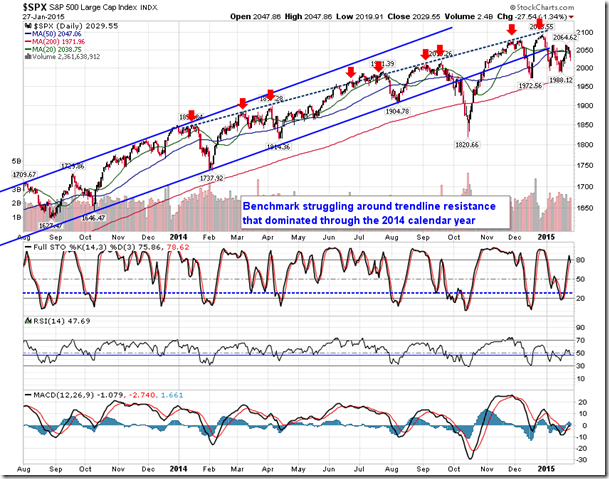
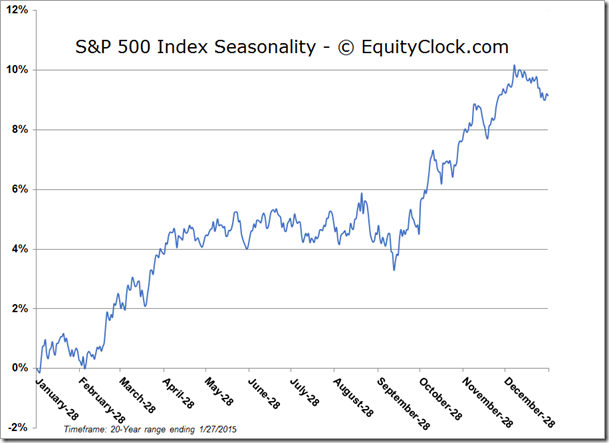
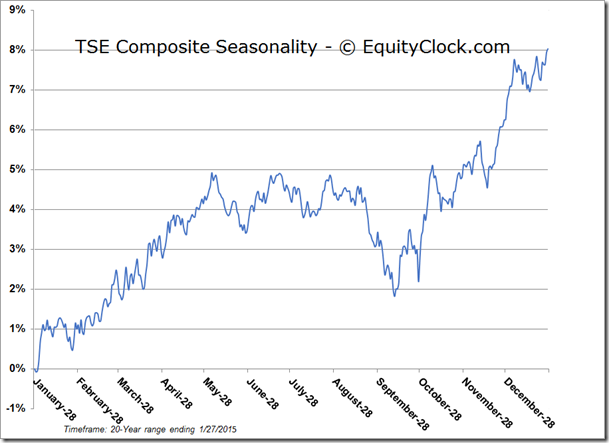
The end of the month is upon us and tendencies for the equity market in the days ahead are strongly positive. Over the past 20 years, the S&P 500 Index has gained an average of 1.10% between January 30th and February 3rd.Positive results were recorded in 16 of the past 20 periods. In Canada, the TSE Composite performed even better over the month-end period, gaining 1.12%, on average, between January 28th and February 3rd. The benchmark recorded positive results in 17 of the past 20 periods. Part of the reason for the bump in Canadian equity prices into the month of February can be attributed to RRSP contributions, the deadline for which falls on March 2nd this year. As investors fund their retirement accounts for tax purposes, equity markets tend to benefit.
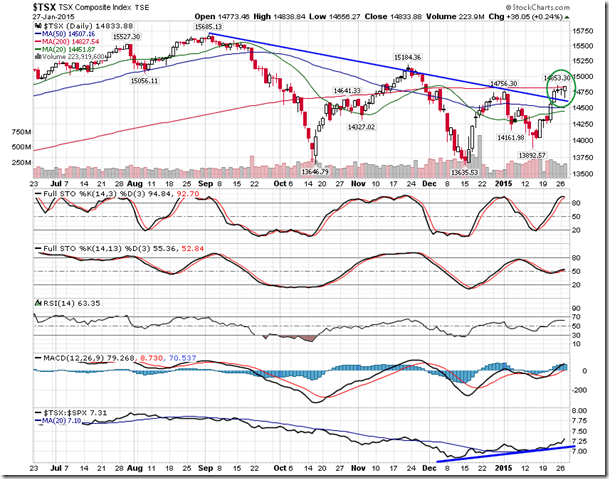
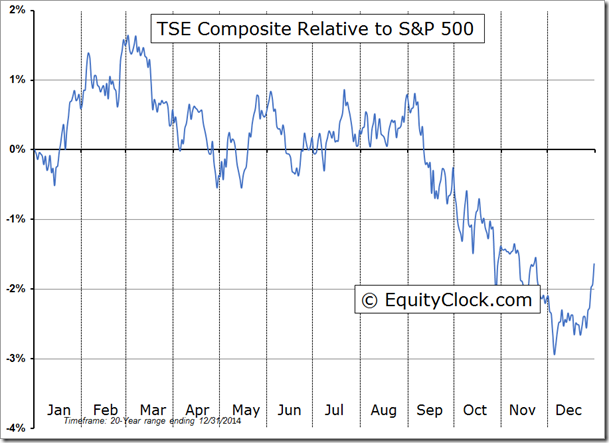
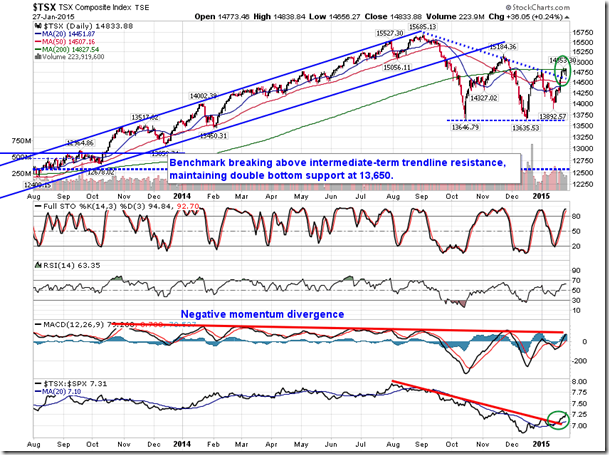
Looking at the TSX, the benchmark continues to strengthen versus its American counterparts. Outperformance versus the S&P 500 Index has been apparent since mid-December, a trend that is seasonally typical; seasonal outperformance runs through to the start of March, around the time of the RRSP contribution deadline. The Canadian benchmark recently broke above an intermediate-term declining trendline, rebounding back to resistance at the 200-day moving average around 14,800. A short-term bull-flag has become apparent on the chart, a positive setup that would be confirmed by breakout above the recent high of 14,853. Momentum indicators have been trending positive for the past few months, placing the bias on an upside breakout.
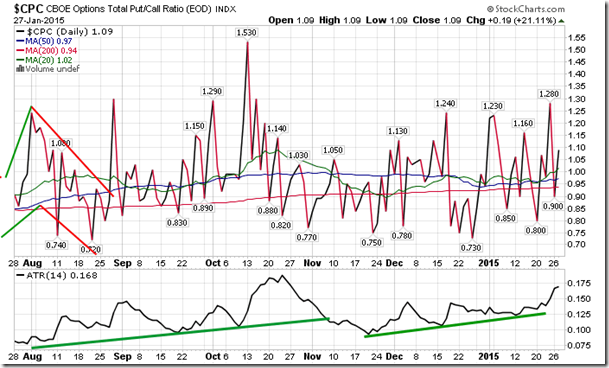
Sentiment on Tuesday, as gauged by the put-call ratio, ended bearish at 1.09.
Seasonal charts of companies reporting earnings today:
S&P 500 Index
TSE Composite
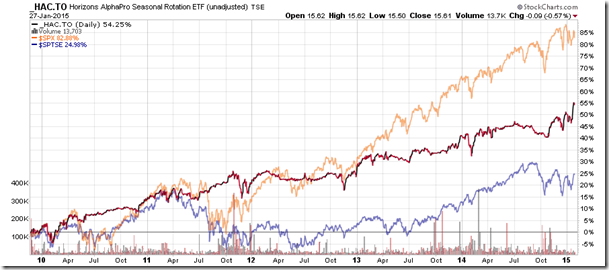
Horizons Seasonal Rotation ETF (TO:HAC)
- Closing Market Value: $15.61 (down 0.57%)
- Closing NAV/Unit: $15.61 (down 0.61%)
Performance*
| 2015 Year-to-Date | Since Inception (Nov 19, 2009) | |
| HAC.TO | 3.17% | 56.1% |
* performance calculated on Closing NAV/Unit as provided by custodian
Disclaimer: Stocks highlighted are for information purposes only and should not be considered as advice to purchase or to sell mentioned securities.As always, the use of technical and fundamental analysis is encouraged in order to fine tune entry and exit points to average seasonal trends.

