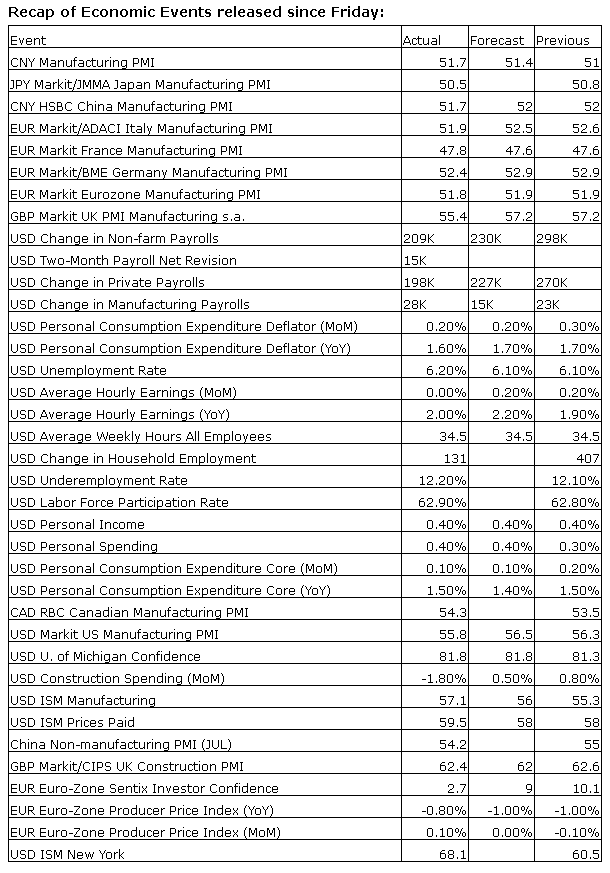
Upcoming US Events for Today:- PMI Services for July will be released at 9:45am.The market expects 61.0, consistent with the previous report.
- Factory Orders for June will be released at 10:00am. The market expects a month-over-month increase of 0.6% versus a decline of 0.5% previous.
- ISM Non-Manufacturing Index for July will be released at 10:00am.The market expects 56.5 versus 56.0 previous.
Upcoming International Events for Today:
- Reserve Bank of India Rate Announcement will be released at 1:30am EST. The market expects no change at 8.0%.
- German PMI Services for July will be released at 3:55am EST. The market expects 56.6 versus 54.6 previous.
- Euro-Zone PMI Services for July will be released at 4:00am EST. The market expects 54.4 versus 52.8 previous.
- Great Britain PMI Services for July will be released at 4:30am EST. The market expects 57.9 versus 57.7 previous.
- Euro-Zone Retail Sales for July will be released at 5:00am EST. The market expects a month-over-month increase of 0.7% versus no change (0.0%) previous.
The Markets
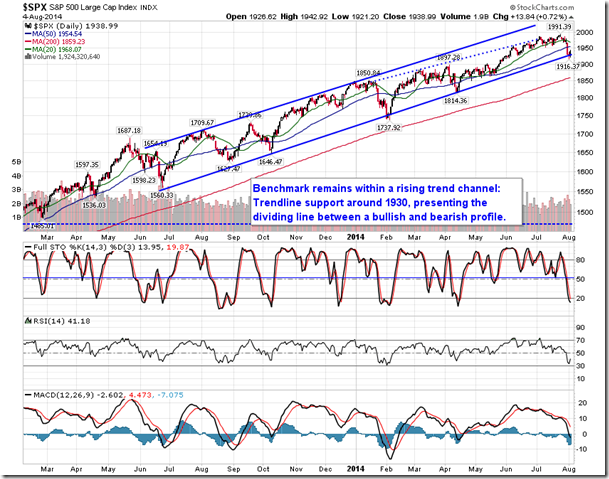
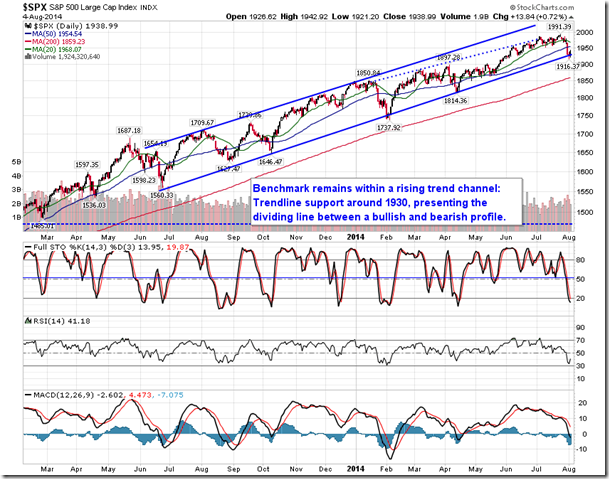
Stocks closed higher on Monday as investors bought oversold equities following last week’s selloff. The S&P 500 Index and Nasdaq Composite closed higher by seven-tenths of a percent, while the Dow Jones Industrial Average ended with a gain of around half of one percent. Monday’s rebound occurred around trendline support that has defined the lower limit of a rising trend-channel stretching back to this time last year; a definitive break of this range has yet to be realized. Focussing briefly on the direction of the major moving averages in order to clarify the direction of the broad market trend across multiple timescales, the 20-day moving average is starting to curl lower, suggesting a negative short-term trend; the 50-day moving average in turning neutral, while the 200-day remains firmly positive, suggesting a neutral intermediate trend and a positive long-term trend, respectively. Typically, the 50-day average will “take a dip” about once or twice a year as regular corrections of around 10% or more play out; the 50-day moving average has not pointed lower since the fourth quarter of 2012, suggesting that a pullback sufficient enough to sway this intermediate moving average is long overdue. A break of the rising trend channel, as depicted below, would change the profile of the market from bullish to bearish, an event that would likely influence the direction of both the 20 and 50-day averages.
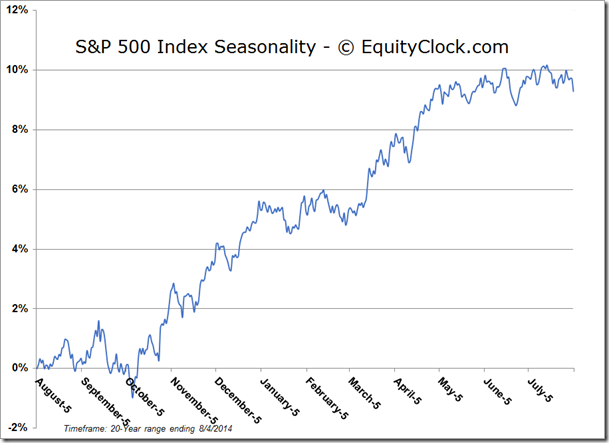
Looking at the seasonal tendencies for the month ahead, the month of August has been the weakest month, on average, for the S&P 500 Index over the past 20 years. The large-cap index has averaged a decline of 0.8%, however, positive results were realized in 11 of the past 20 periods. The Consumer Discretionary and Financial sectors recorded the largest August declines since 1994, losing an average of 1.2% during the month. The Energy sector also recorded a pronounced decline, losing an average of 1.1%, although the next period of seasonal strength for the sector begins half way through the period, bouncing from the mid-August lows. Technology and Utility stocks have been the only two sectors to average a gain for the month, rising 0.2% and 0.7%, respectively.
Monthly averages for the S&P 500 Index:

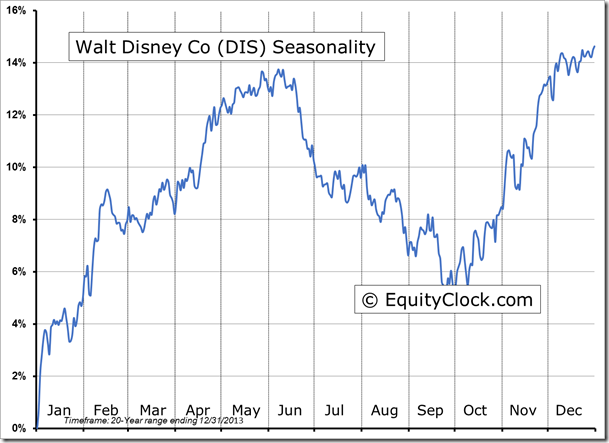
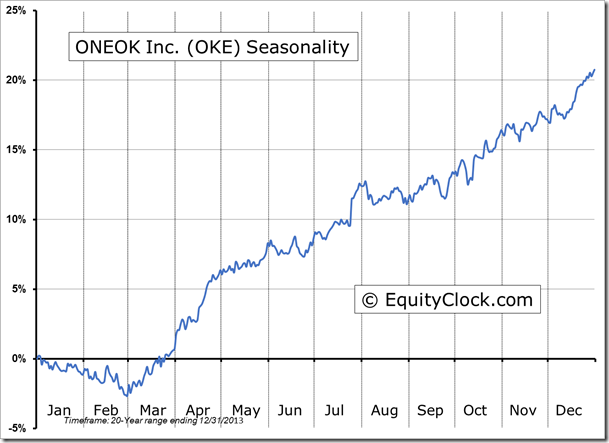
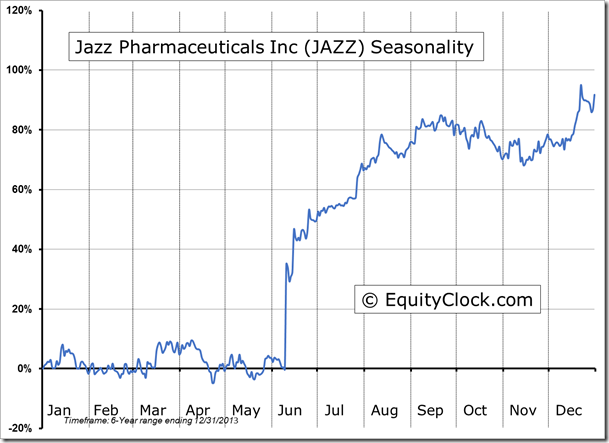
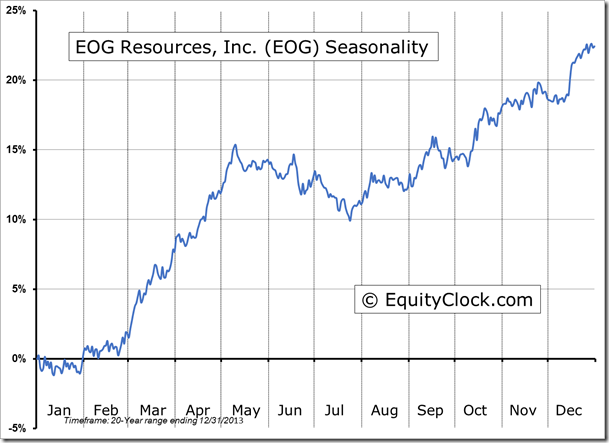
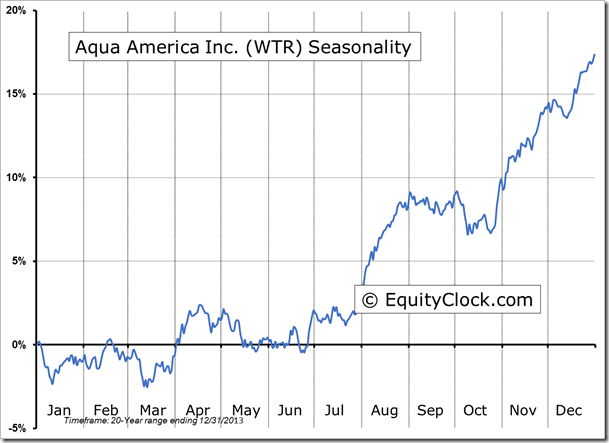
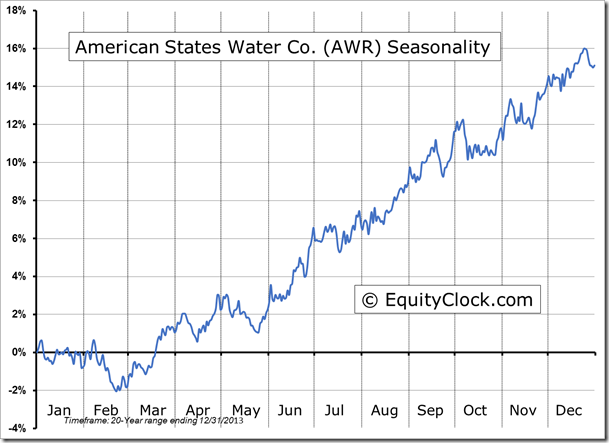
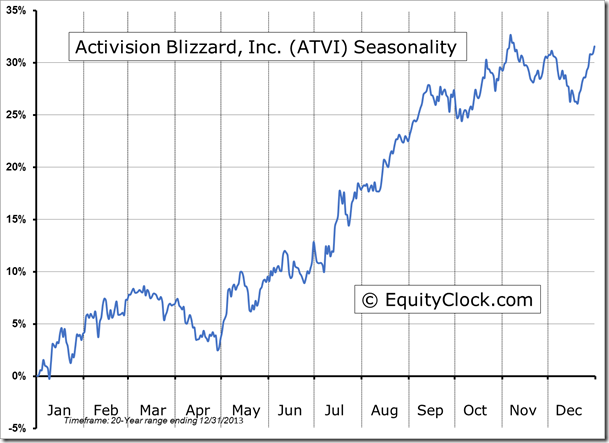
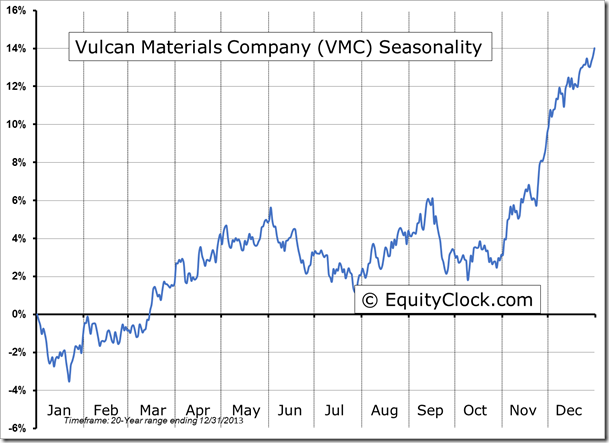
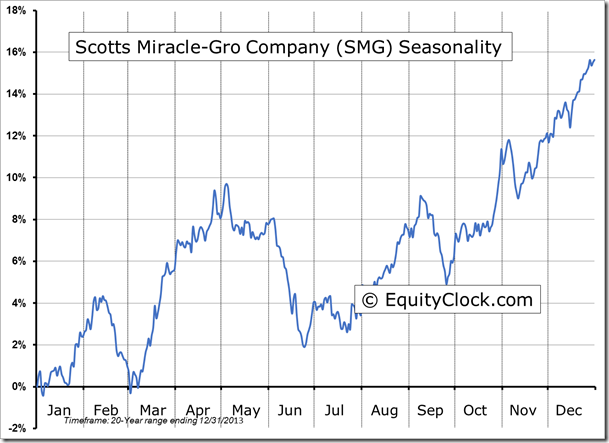
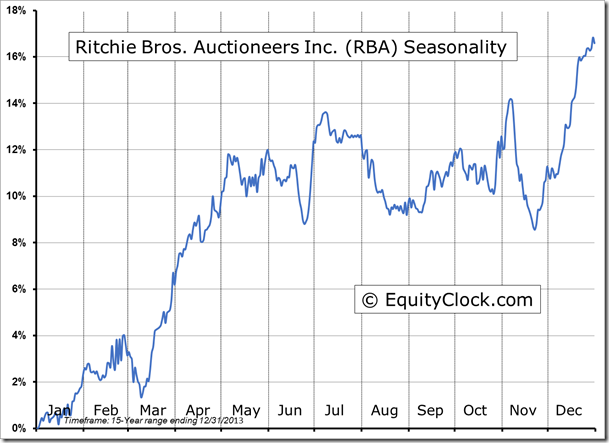
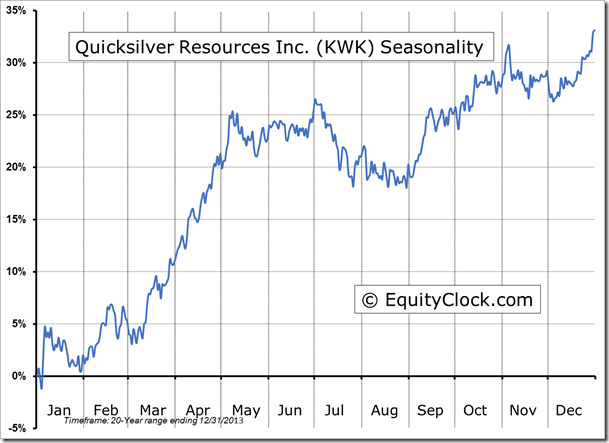
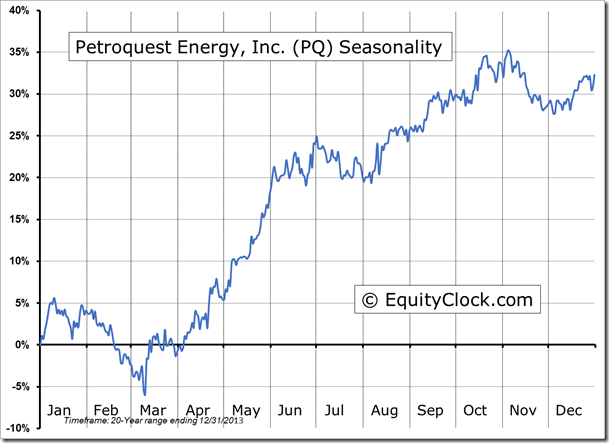
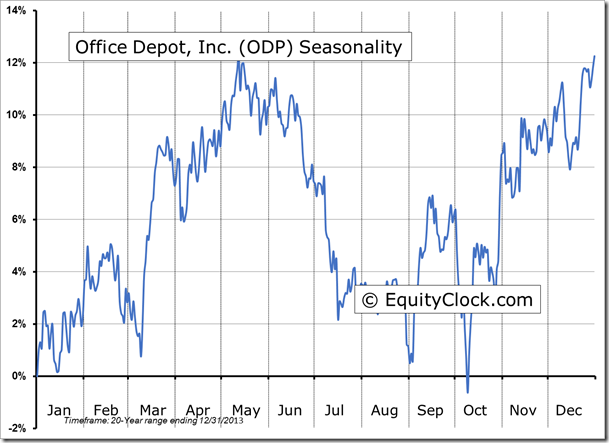
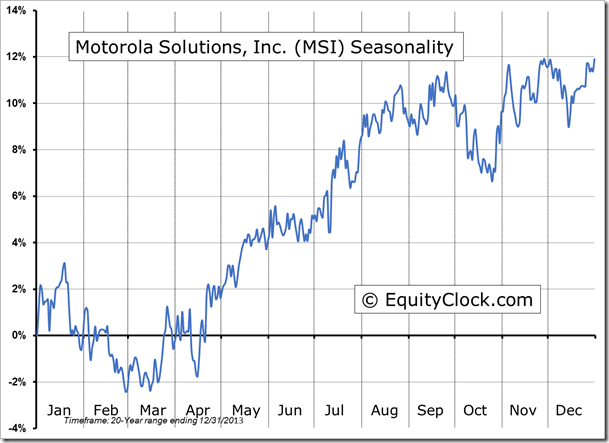
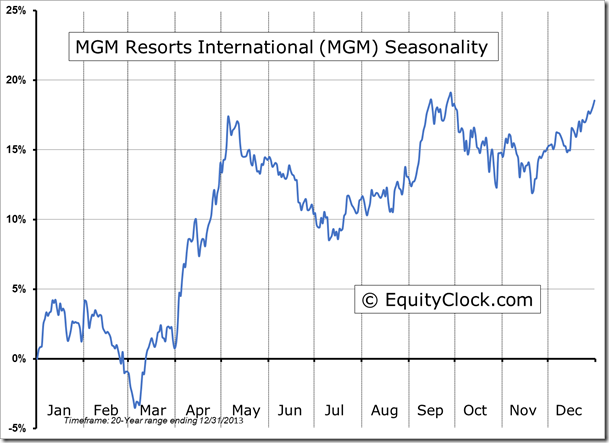
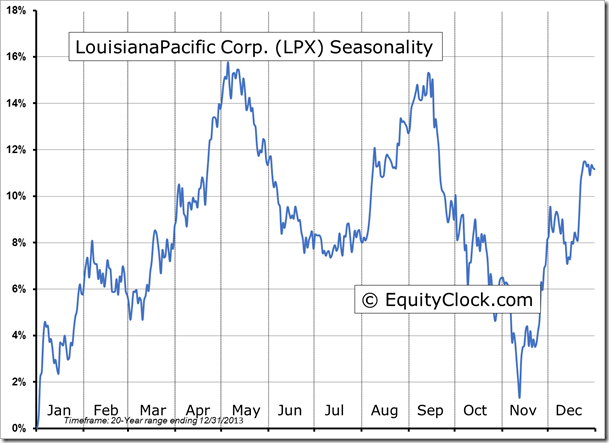
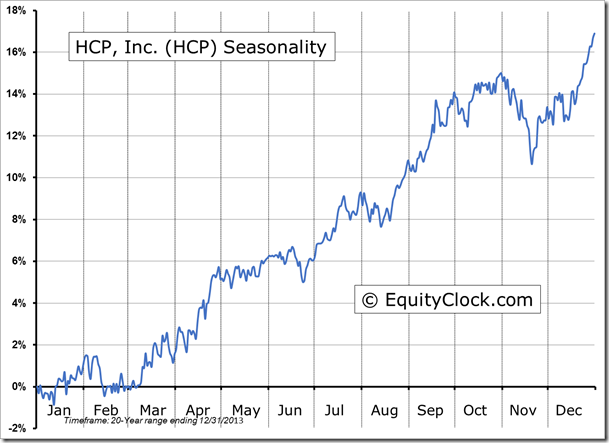
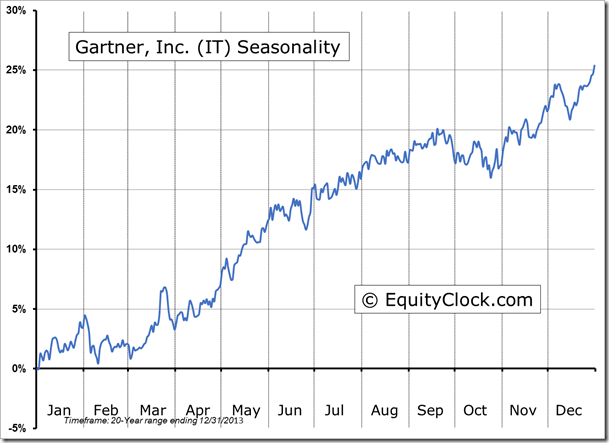
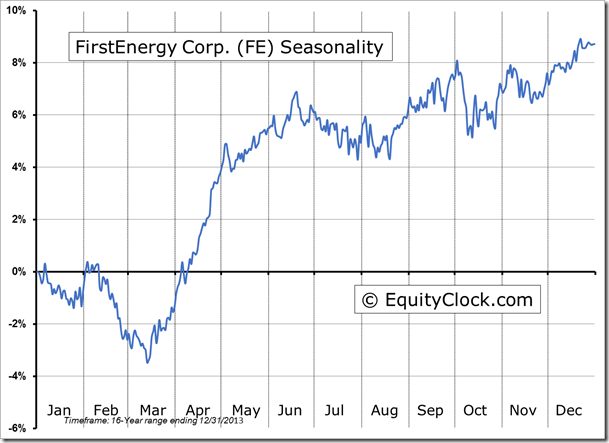
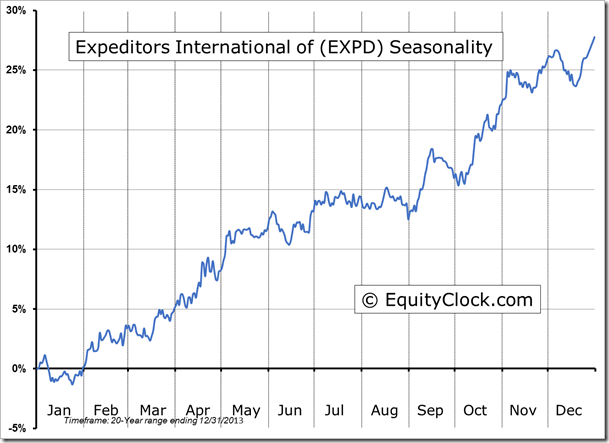
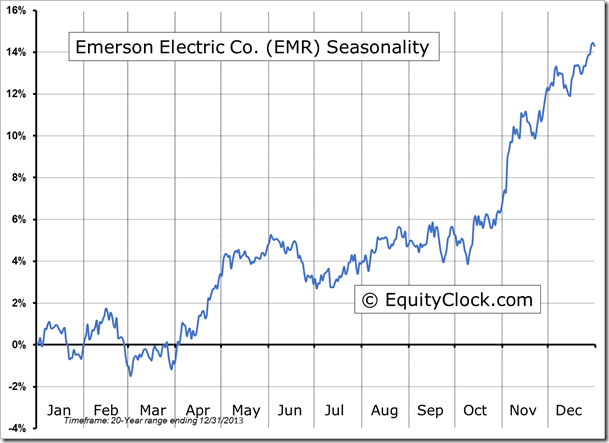
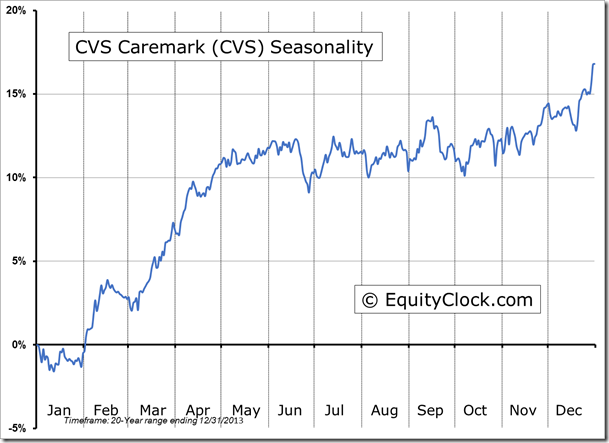
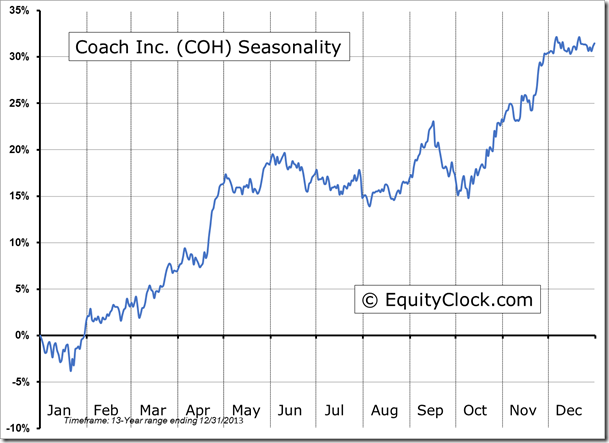
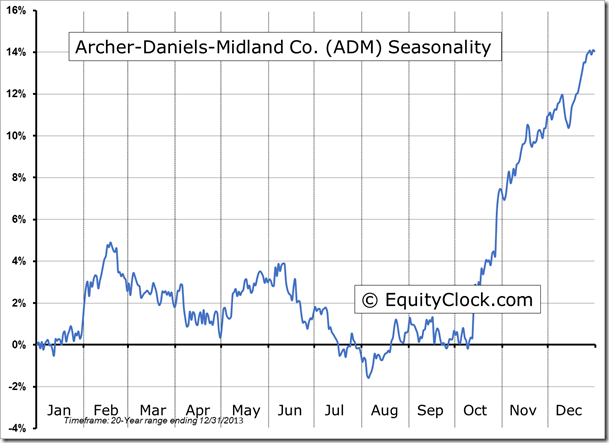
Seasonal charts of companies reporting earnings today:
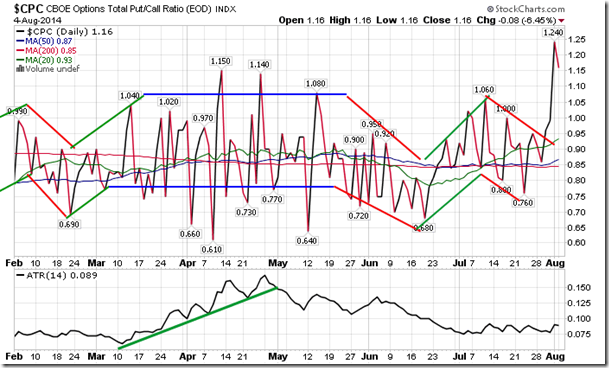
Sentiment on Monday, as gauged by the put-call ratio, ended bearish at 1.16. The ratio spiked to a 2014 high of 1.24 on Friday as investors aggressively hedged portfolios given the recent spike in volatility. With sentiment leaning so far to the bearish side of the spectrum, the incentive for portfolio managers to sell positions is lessened, typically acting as short-term support to the equity market.
S&P 500 Index
TSE Composite
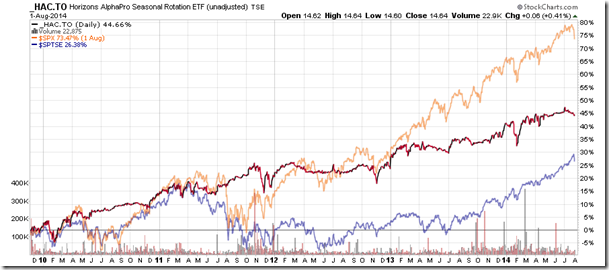
Horizons Seasonal Rotation ETF (TO:HAC)
- Closing Market Value: $14.64 (up 0.41%)
- Closing NAV/Unit: $14.61 (up 0.35%)
Performance*
| 2014 Year-to-Date | Since Inception (Nov 19, 2009) | |
| HAC.TO | 2.17% | 46.1% |
* performance calculated on Closing NAV/Unit as provided by custodian
