Upcoming US Events for Today:
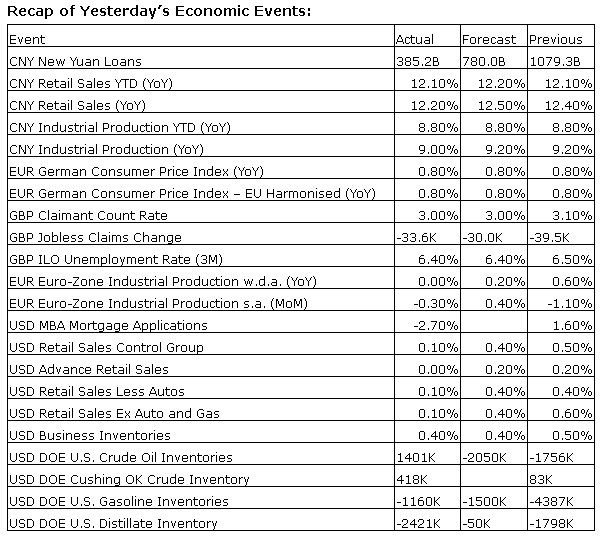
- Weekly Jobless Claims will be released at 8:30am. The market expects Initial Claims to show 295K versus 289K previous.
- Import/Export Prices for July will be released at 8:30am.
Upcoming International Events for Today:
- Flash German GDP for the Second Quarter will be released at 2:00am EST. The market expects a year-over-year increase of 1.5% versus an increase of 2.3% previous.
- Euro-Zone Flash GDP for the Second Quarter will be released at 5:00am EST. The market expects a year-over-year increase of 0.8% versus an increase of 0.9% previous
- Euro-Zone CPI for July will be released at 5:00am EST.
The Markets
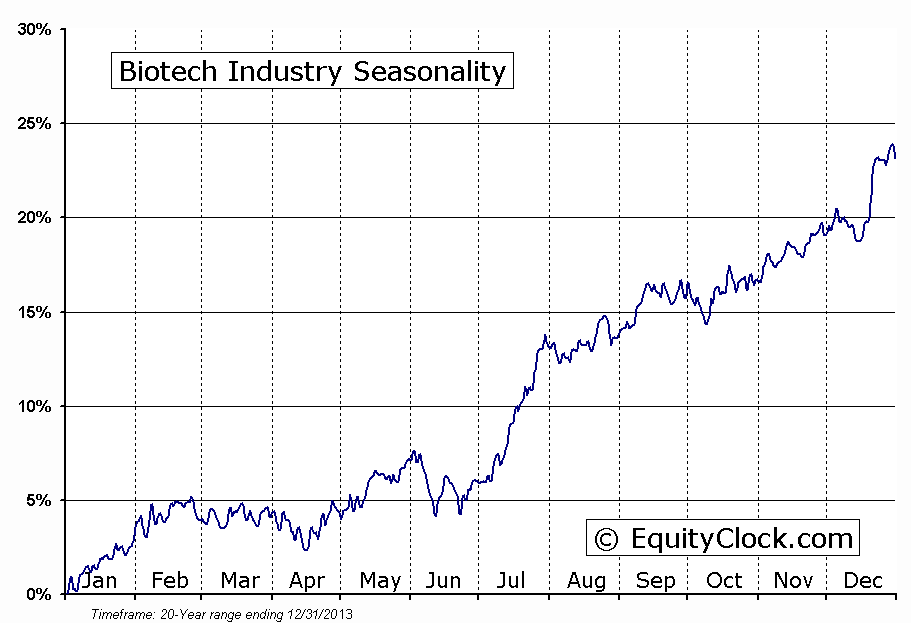
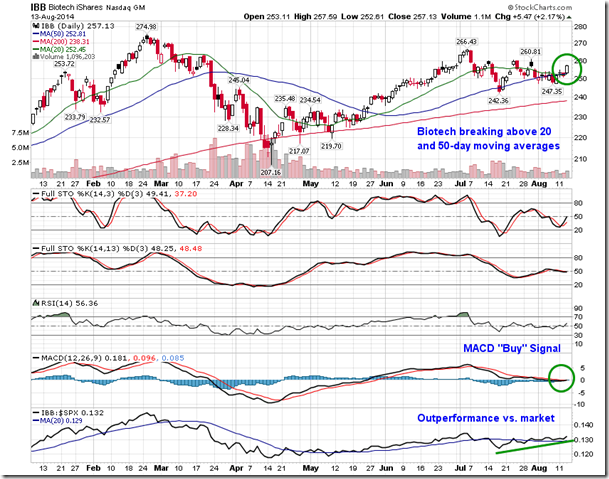
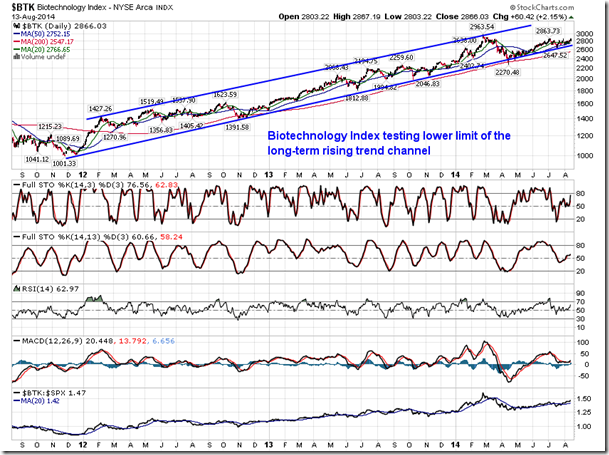
Stocks ended firmly higher on Wednesday, led by shares of health care companies as biotechnology rallied. The iShares Biotechnology ETF (iShares Nasdaq Biotech (NASDAQ:IBB)) gained over two percent, breaking firmly above both its 20 and 50-day averages, levels that had acted as resistance over the last couple of weeks. The Biotech ETF also triggered a MACD “Buy” signal and outperformance versus the market remains evident. A longer-term view shows that the NYSE Biotechnology Index has been testing support at the lower limit of a long-term rising trend channel for the past few months; trendline support is presently hovering around 2700, presenting the dividing line between a bullish and bearish profile. The Biotechnology industry remains in a period of seasonal strength through to September.
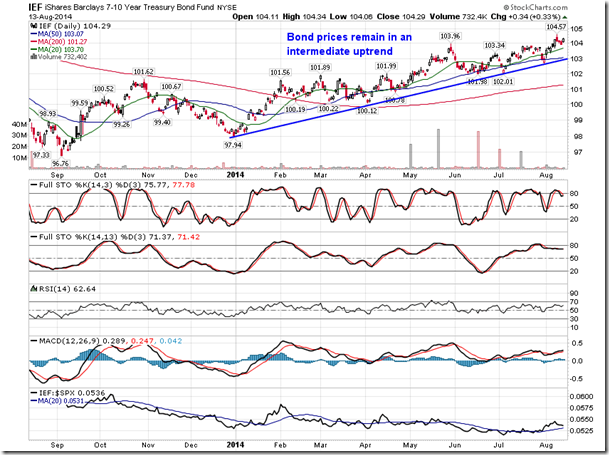
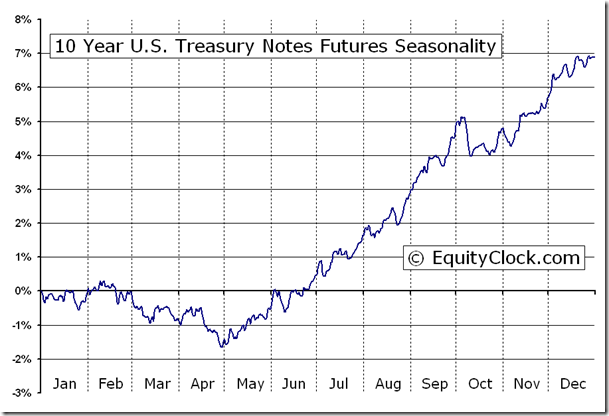
Despite the rally in stocks, bond prices also pushed firmly higher with the iShares 7-10 Year Treasury Bond Fund closing at a 52-week high. The intermediate bond fund has been supported by a rising trendline since the year began, despite calls for rising rates (lower prices) for many months. Given the recent volatility in stocks, bonds have started to show signs of outperformance versus the S&P 500 as investors seek the safe-haven alternative. Bond prices remain seasonally strong through to October.
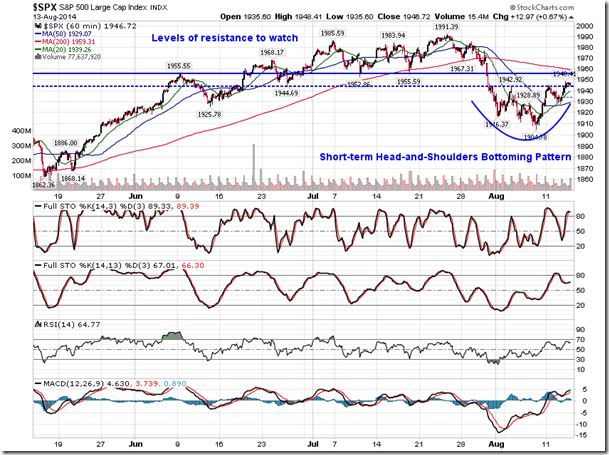
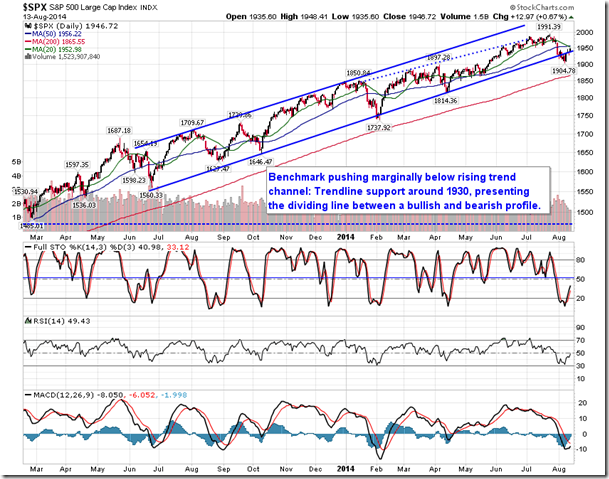
Meanwhile, back to the equity market, earlier this week we presented a chart of the S&P 500 Index containing the levels of resistance to watch. The first, minor level of resistance was exceeded during Wednesday’s session at 1944; the next and more significant level of resistance remains at 1955. Looking at this short-term view of the S&P 500, a reverse head-and-shoulders pattern has become apparent with the neckline around the previously mentioned resistance of 1944. Upside potential of the bullish setup points to around 1970. Momentum indicators continue to show signs of rebounding from oversold levels following the recent selloff.
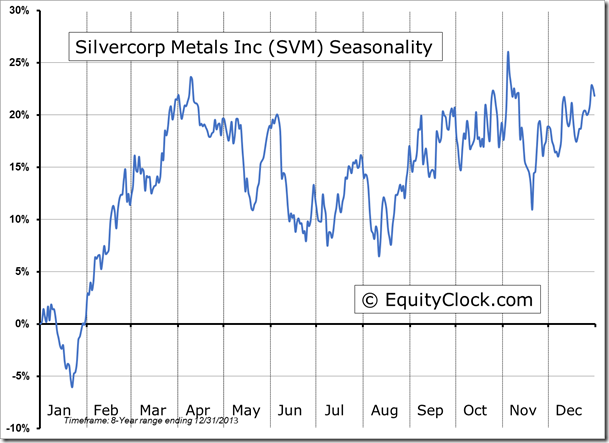
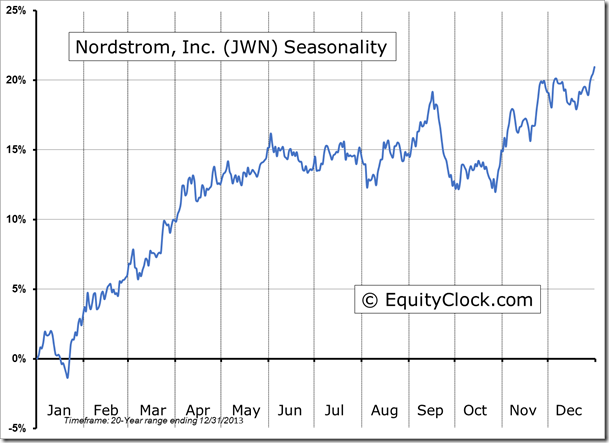
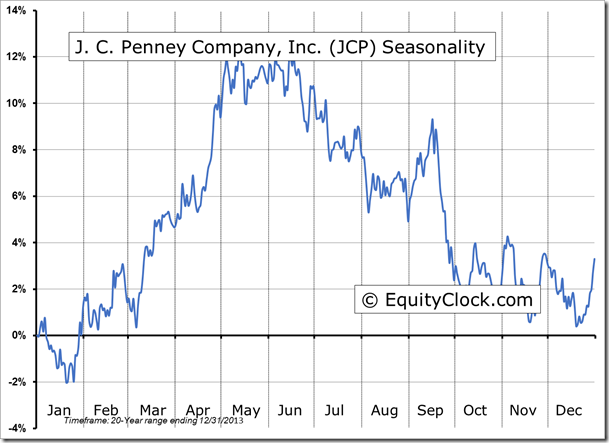
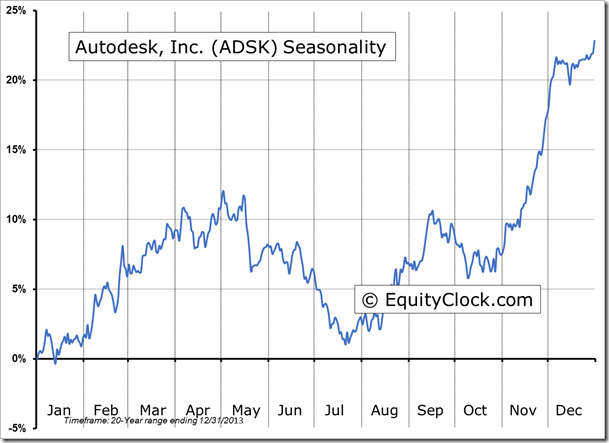
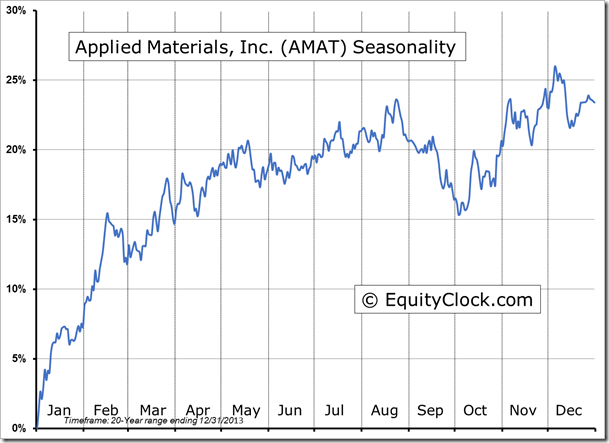
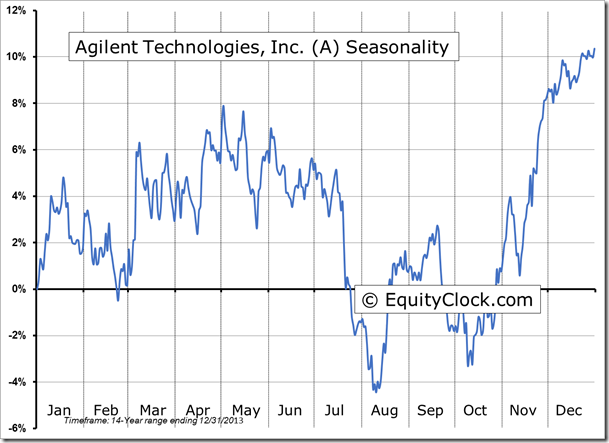
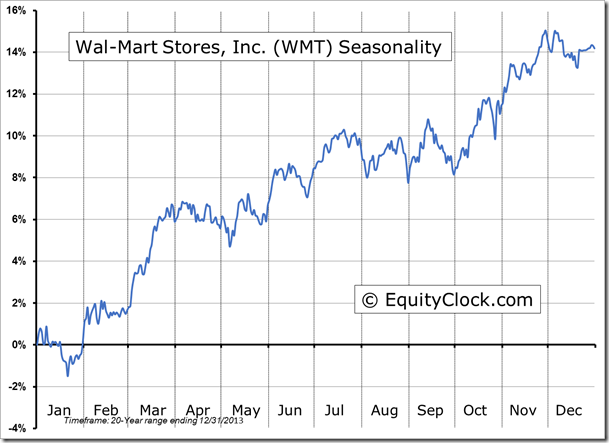
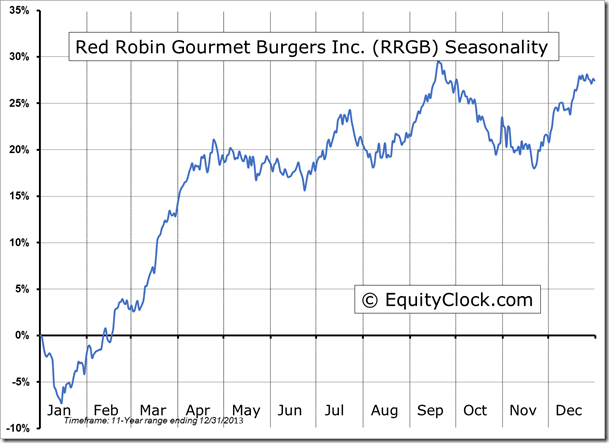
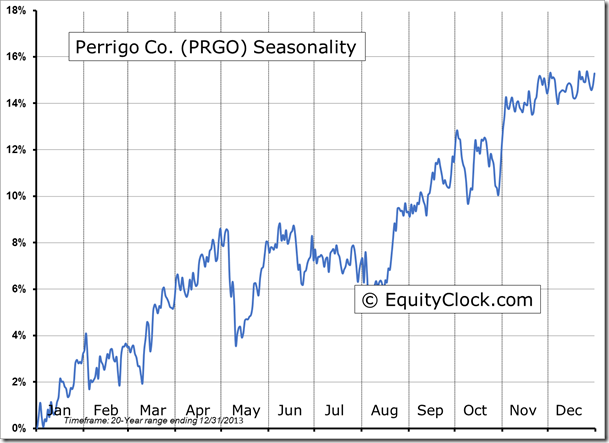
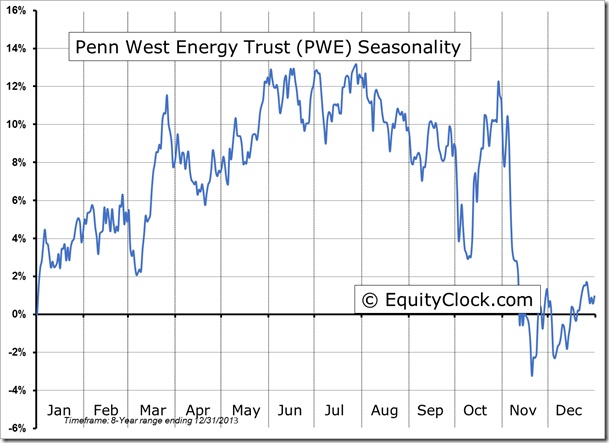
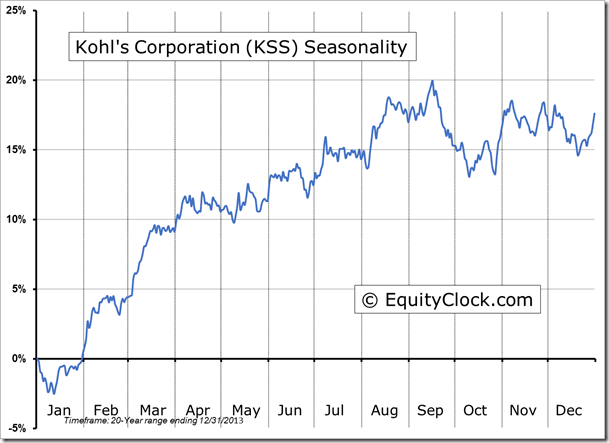
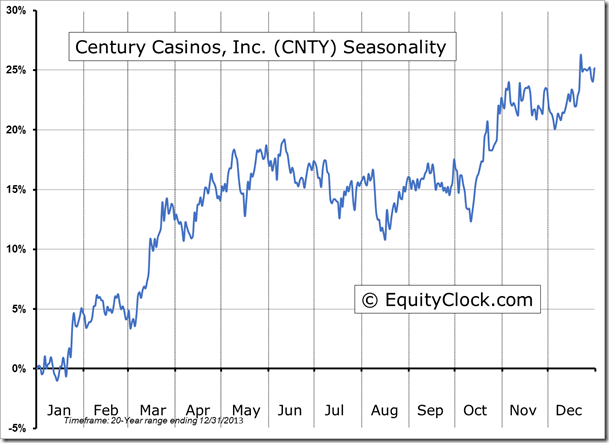
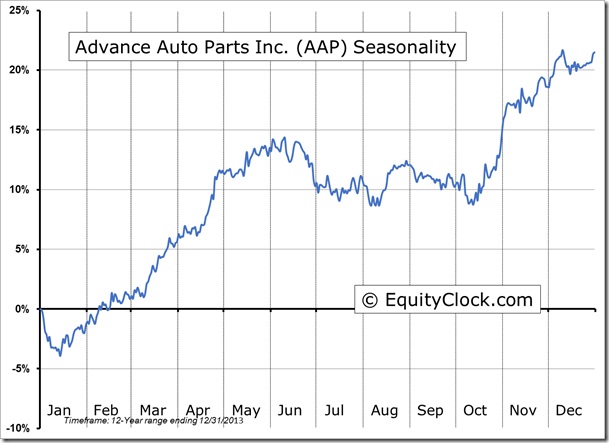
Seasonal charts of companies reporting earnings today:
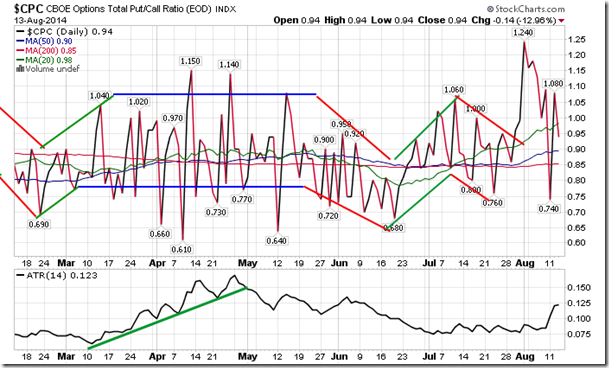
Sentiment on Wednesday, as gauged by the put-call ratio, ended bullish at 0.94.
S&P 500 Index
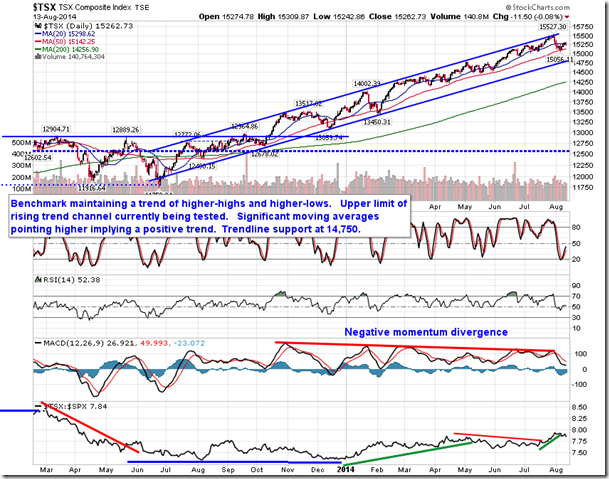
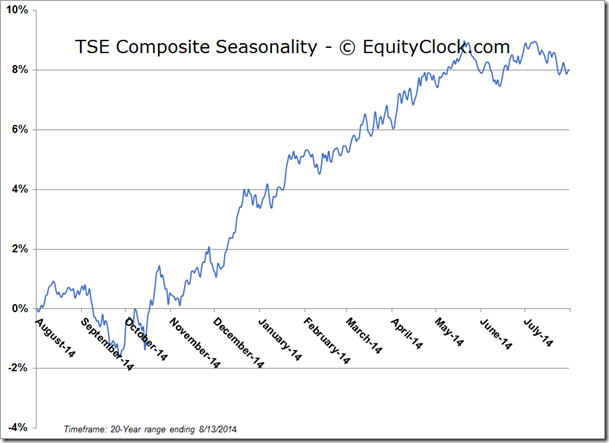
TSE Composite
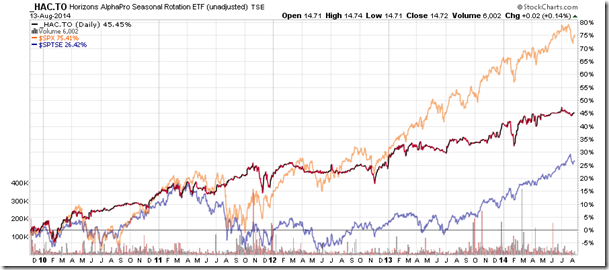
Horizons Seasonal Rotation ETF (TO:HAC)
- Closing Market Value: $14.72 (up 0.14%)
- Closing NAV/Unit: $14.30 (up 0.05%)
Performance*
| 2014 Year-to-Date | Since Inception (Nov 19, 2009) | |
| HAC.TO | 6.48% | 35.4% |
* performance calculated on Closing NAV/Unit as provided by custodian
