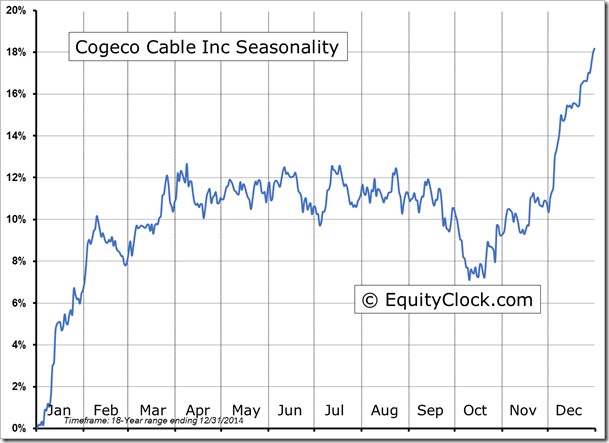
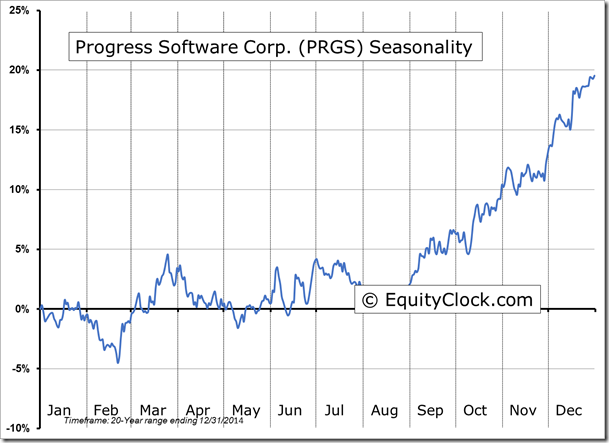
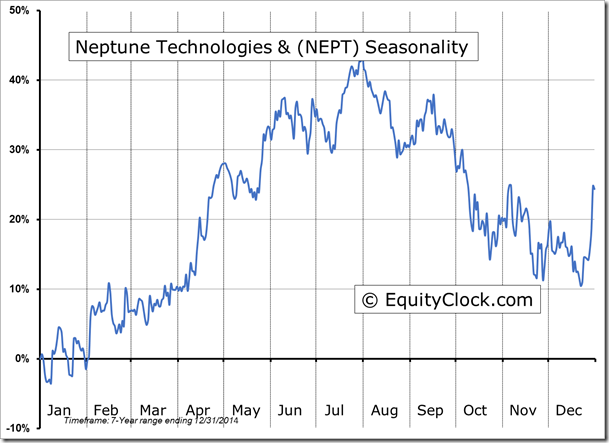
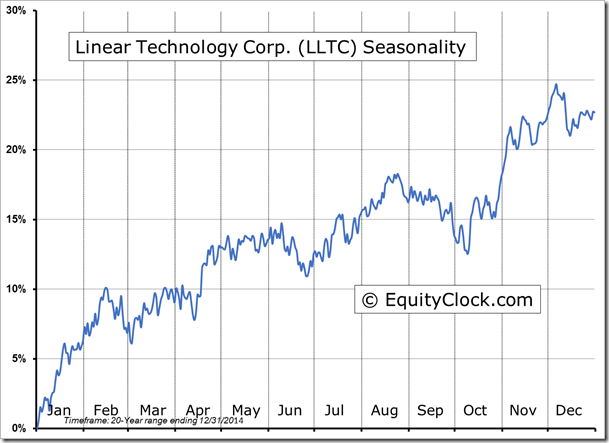
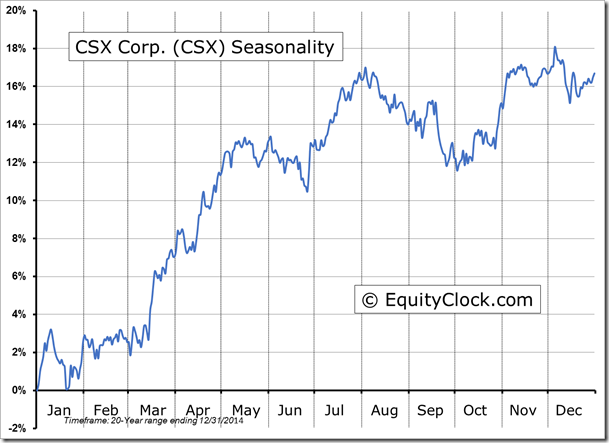
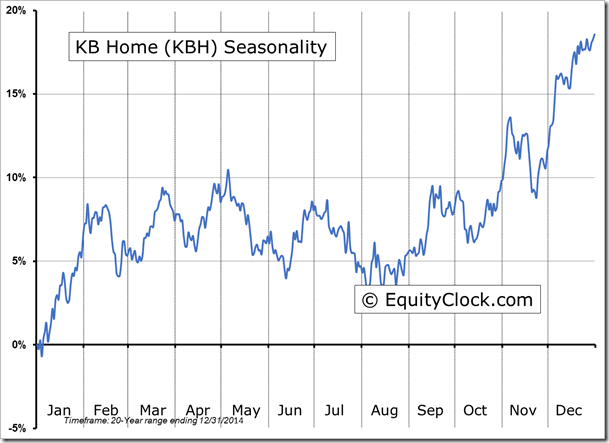
Stocks Entering Period of Seasonal Strength Today:
-
No stocks identified for today
The Markets
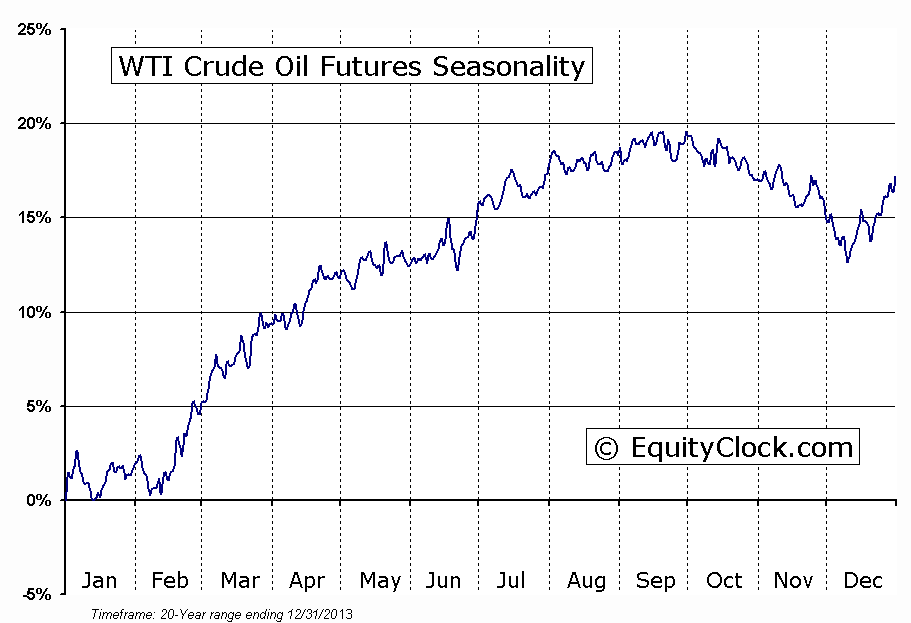
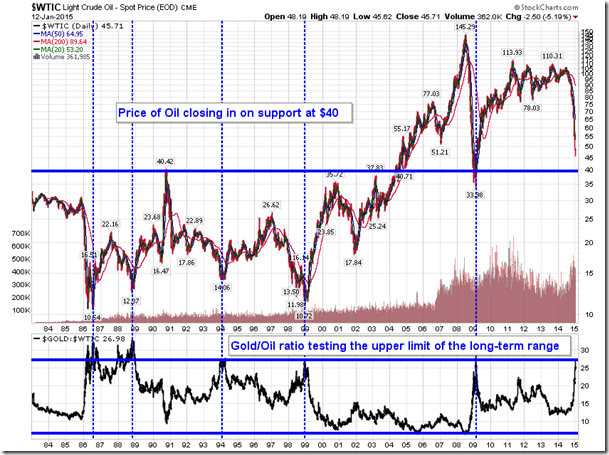
Stocks drifted lower to open the week as the price of oil continued to slide. West Texas Crude dropped another 5% on Monday, falling below $46, the lowest level since March 2009. The price of the energy commodity is quickly closing in on significant support around $40, a level that at the very least should coincide with a short-term bounce. Since charting a post-recovery peak of $114.83, the commodity is lower by over 60%, leading many to speculate as to when the bottom will be reached. Looking at the seasonal chart, February 12 marks the average start to the positive seasonal trend that runs through to the spring months; the stocks will typically lead this trend.
Perhaps a rather unconventional way to look at the price of oil is its ratio to the price of gold. Since 1983, the value of gold versus oil has traded within a range of 6 to 27, where the upper limit (27) has typically coincided with a low in the energy commodity. The gold/oil ratio is presently testing the upper limit of this range now, perhaps signalling that a low is near. The price action for the price of oil over the next five or six dollars down to significant support at $40 should be interesting.
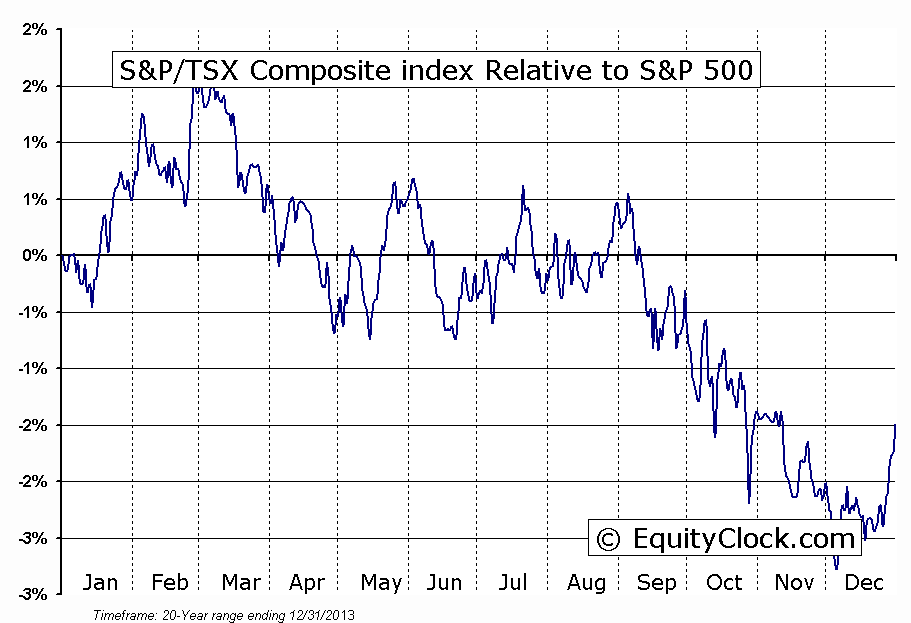
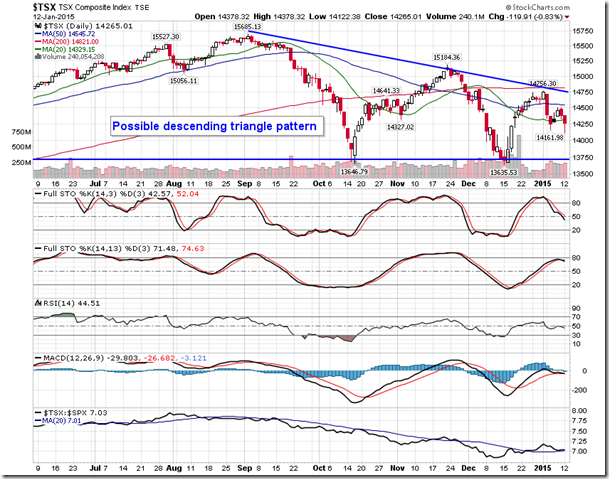
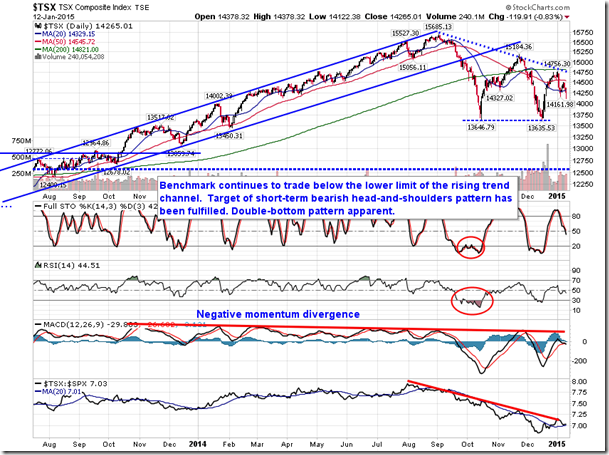
Of course, the decline in the price of Oil has had a substantial impact on energy stocks, as well as benchmarks heavily weighted in the energy sector. This includes the TSX Composite, which has a 20% weight in energy stocks. Since breaking trend in September, the Canadian benchmark has charted lower intermediate highs, resisting at a declining trendline that currently hovers around 14,750.
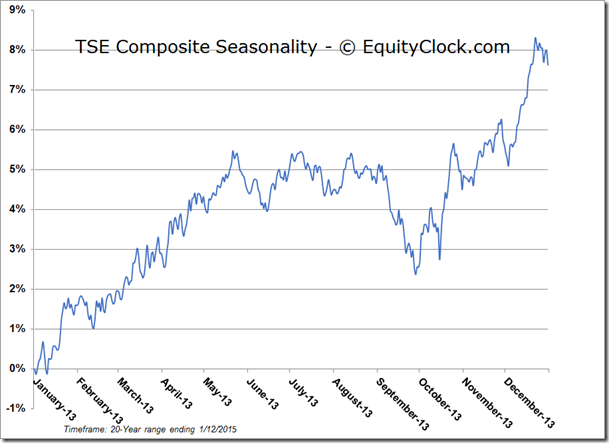
While support remains apparent around 13,650, the threat of a descending triangle pattern cannot be ignored. The bearish setup would target down to around 11,650 , or 18% below present levels, should price break below support at 13,650. Watch the level of support below, particularly given the positive seasonal tendencies that typically support the benchmark through the first quarter.
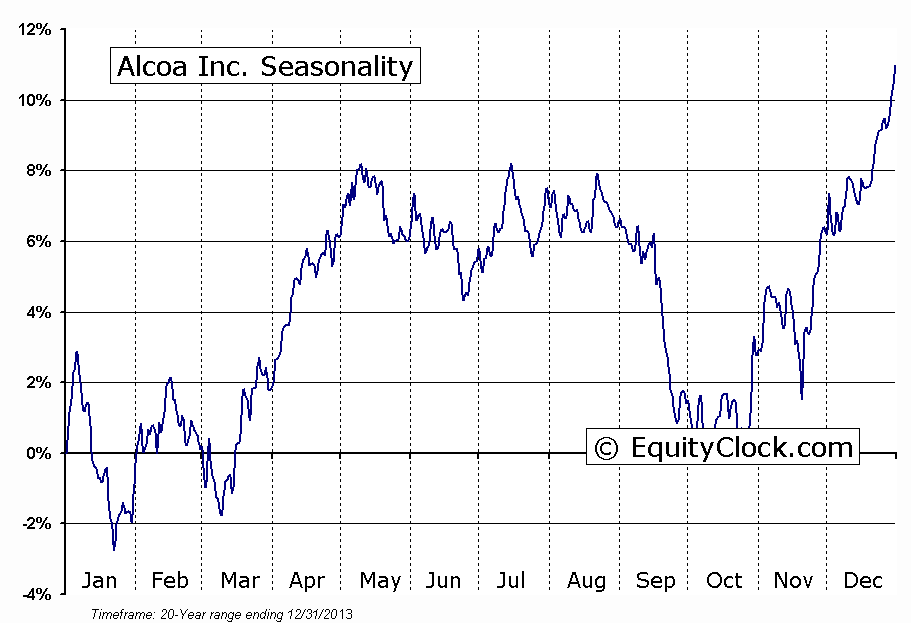
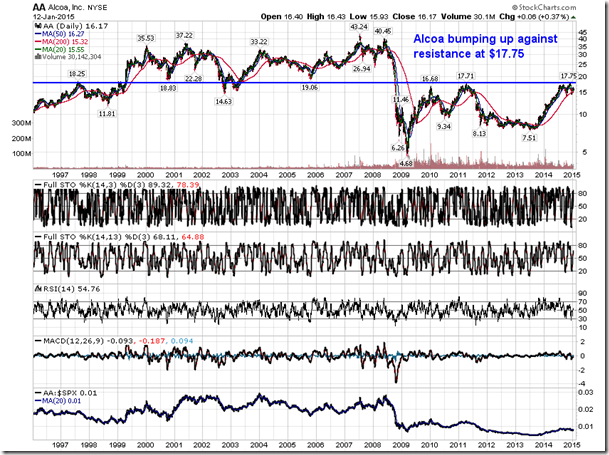
On Monday, earnings season unofficially got underway with the report from Alcoa (NYSE:AA) after the closing bell. The company reported earnings and revenue above expectations, sending the stock higher by 1.5% in after-hours trading. Over the past 10 years, the stock has traded lower 70% of the time during the session following this January report, averaging a decline of 2.19%. But the downfall in the first company to kick off earnings season has little impact on the broad market, which, according to the S&P 500 Index, has traded higher 70% of the time in the session following Alcoa’s January report.
Although the stock has been volatile, on average, through the first two months of the year, particularly if earnings disappoint, the stock tends to find a low from which it enters its period of seasonal strength that runs through to May. A higher short-term low above both the October and December bottoms suggests a similar seasonal low may be developing. The stock is at a critical juncture when taking a longer-term view; the stock has been bumping up against resistance at $17.75, a level that was last tested in 2011. A break above resistance would open a path towards the next level of long-tern resistance around $24.
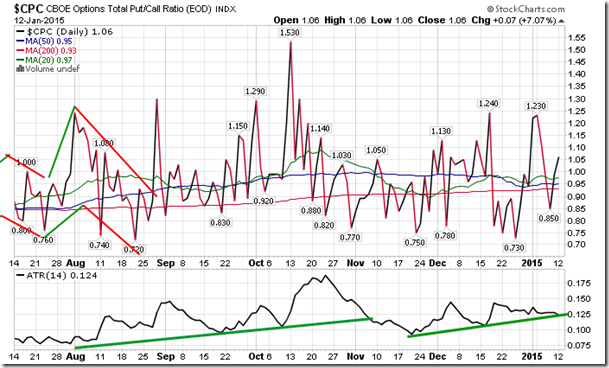
Sentiment on Monday, as gauged by the put-call ratio, ended bearish at 1.06.
Seasonal charts of companies reporting earnings today:
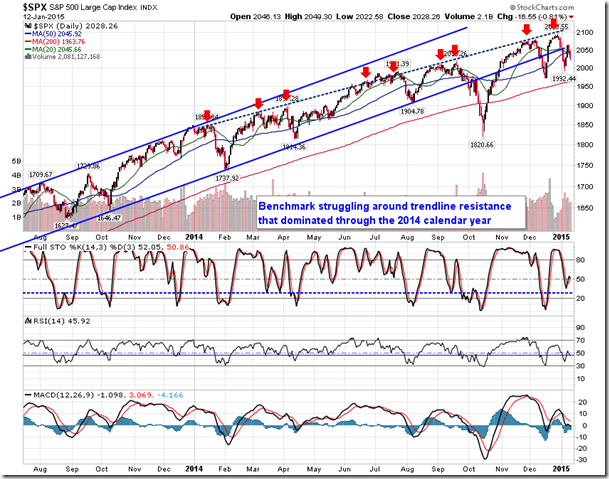
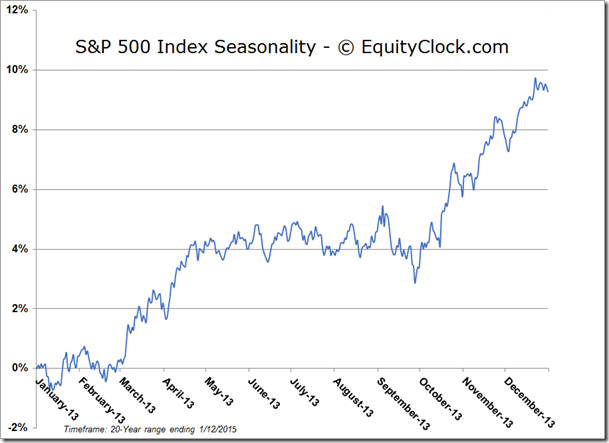
S&P 500 Index
TSE Composite
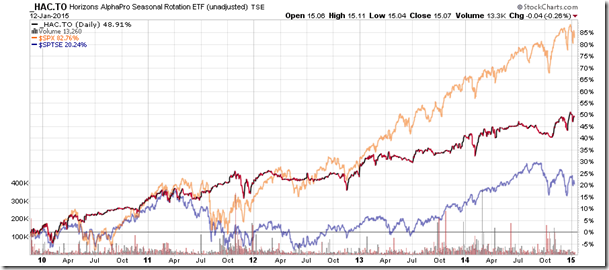
Horizons Seasonal Rotation ETF (TO:HAC)
- Closing Market Value: $15.07 (down 0.26%)
- Closing NAV/Unit: $15.09 (down 0.02%)
Performance*
| 2015 Year-to-Date | Since Inception (Nov 19, 2009) | |
| HAC | -0.26% | 50.9% |
* performance calculated on Closing NAV/Unit as provided by custodian
Disclaimer: Stocks highlighted are for information purposes only and should not be considered as advice to purchase or to sell mentioned securities. As always, the use of technical and fundamental analysis is encouraged in order to fine tune entry and exit points to average seasonal trends.

