Stocks Entering Period of Seasonal Strength Today:
-
No stocks identified for today
The Markets
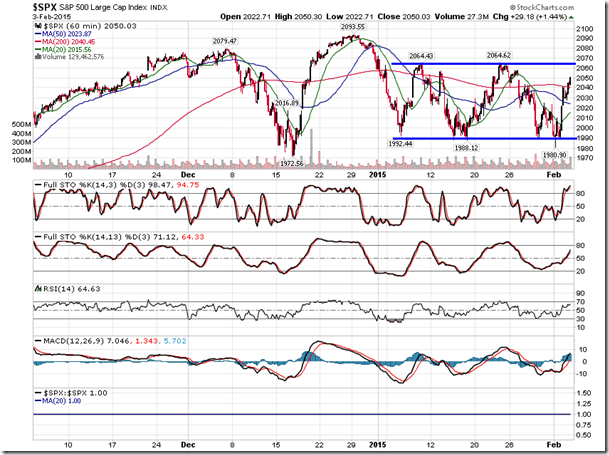
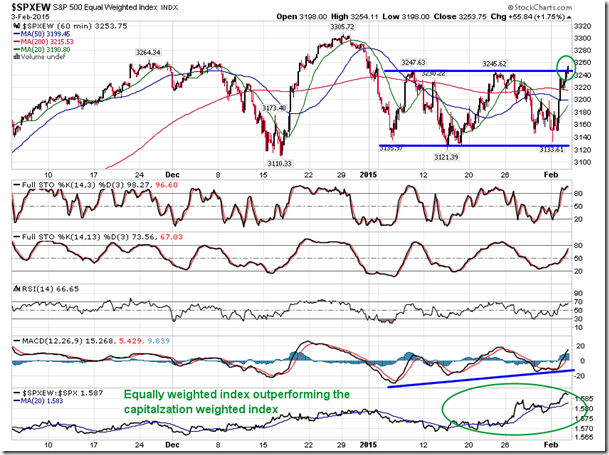
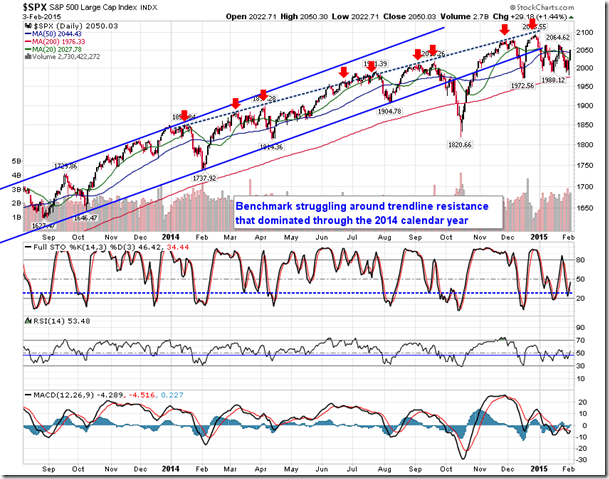
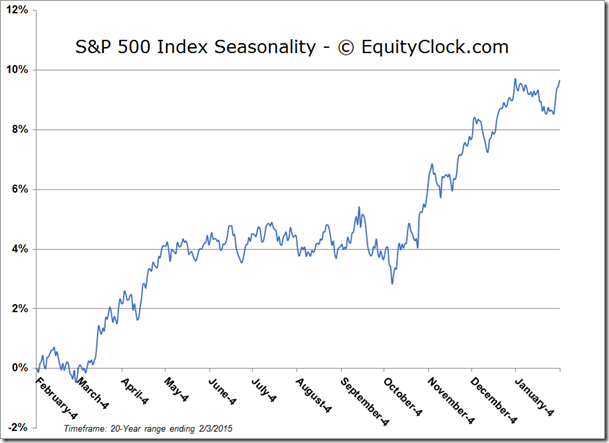
Stocks closed firmly higher on Tuesday, led by strength in the energy sector as the price of oil continues to rebound from the lowest levels since 2009. Major benchmarks posted gains topping 1%, pushing back towards the upper limit of the short-term range that has dominated trading activity since the year began. Short-term resistance on the S&P 500 Index remains present at 2064, a level that has been tested twice over the past month. Investors continue to speculate on the direction of the break, refraining from placing any significant bets until the breakout occurs. Perhaps hinting of things to come for the rest of the market, the S&P 500 Equally Weighted Index did record a breakout above its short-term range, opening a path towards the all-time high at 3305.72. A short-term positive momentum divergence with respect to MACD is providing reason to maintain an upside bias. The S&P 500 Equally Weighted Index has been outperforming the Capitalization Weighted benchmark over the last few weeks, suggesting positive breadth, typically an indication of further gains in equity prices ahead. Seasonal tendencies for the broad market can remain volatile, in both directions, through the remainder of earnings season.
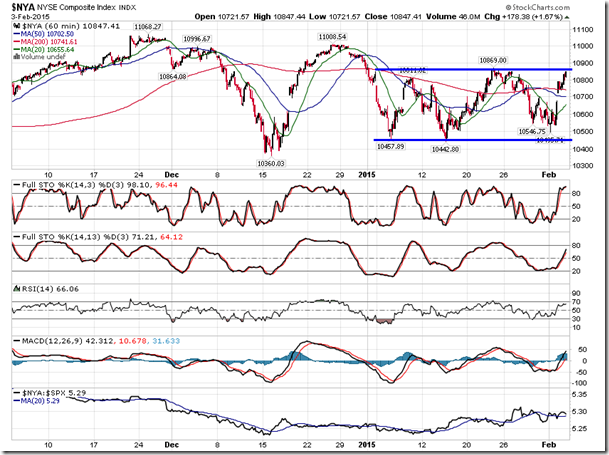
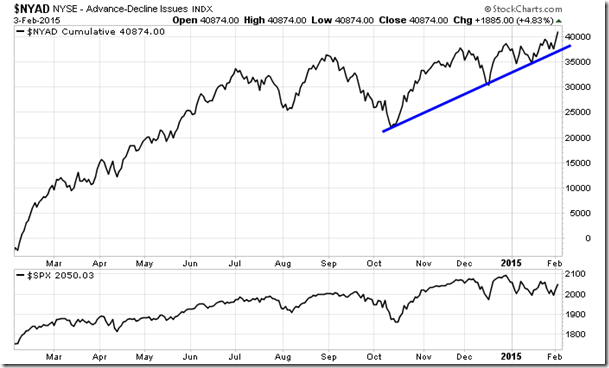
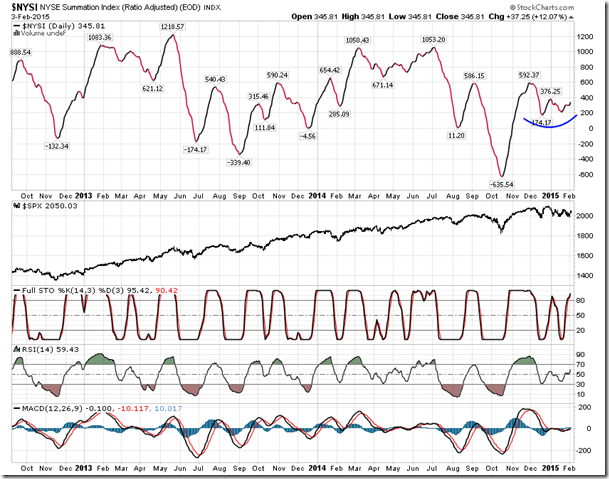
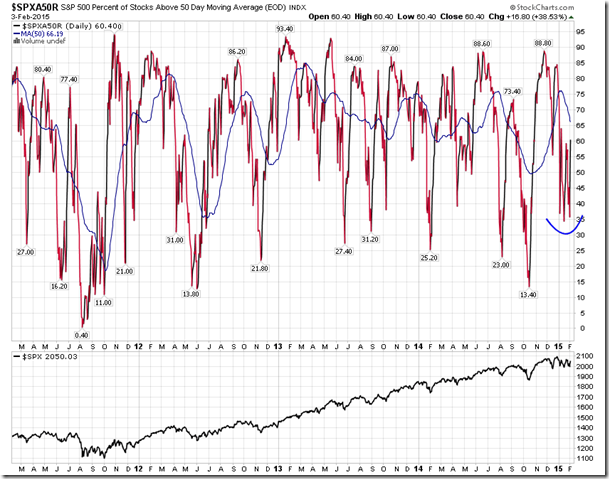
Meanwhile, as the NYSE Composite struggles with the same level of short-term resistance as other broad market indices, the NYSE Cumulative Advance-Decline line charted a new all-time high during Tuesday’s session. This breadth indicator continues to trend positive, suggesting ongoing equity market strength. Typically, divergences in this indicator compared with the price trend of the market can suggest a change in direction of equity prices. Other indications of breadth, including the NYSE Summation Index and the Percent of Stocks Trading above 50-Day Moving Averages, are also showing signs of curling higher. These hints of strength, assuming they continue to appear, should translate into higher equity prices in the near future.
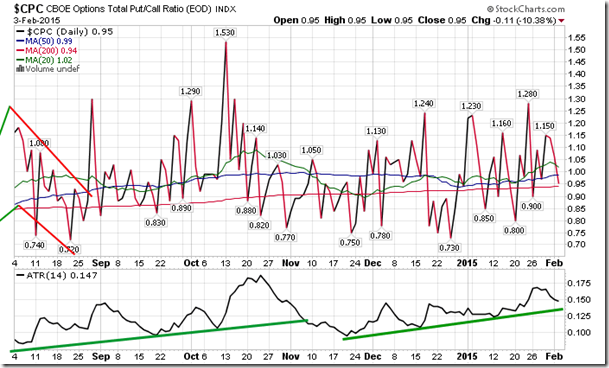
Sentiment on Tuesday, as gauged by the put-call ratio, ended bullish at 0.95.
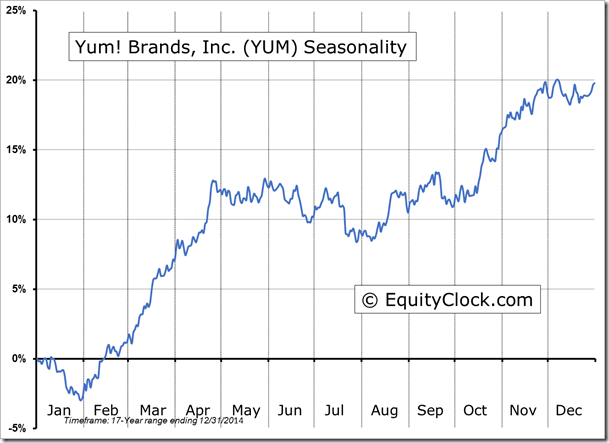
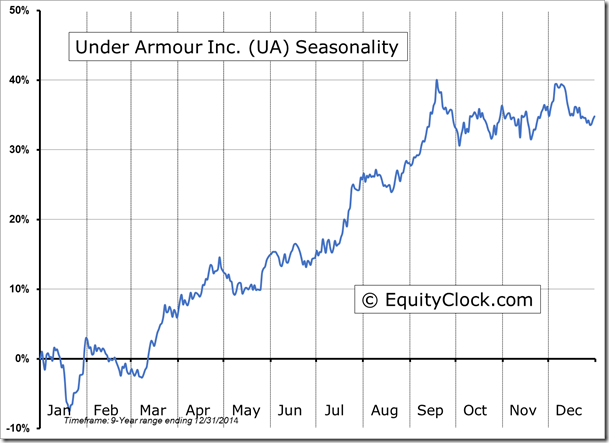
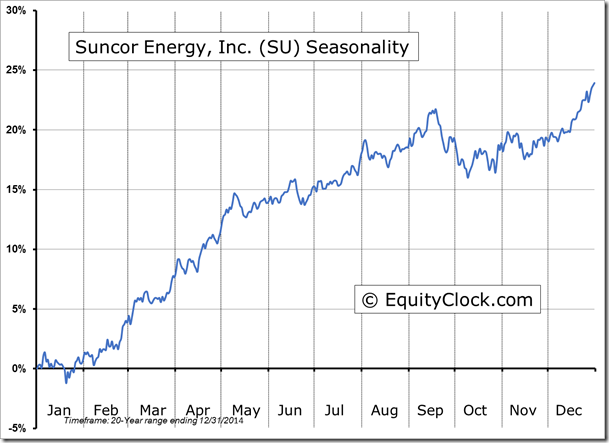
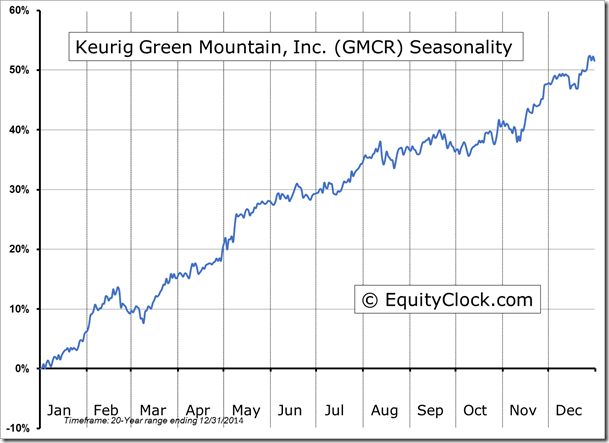
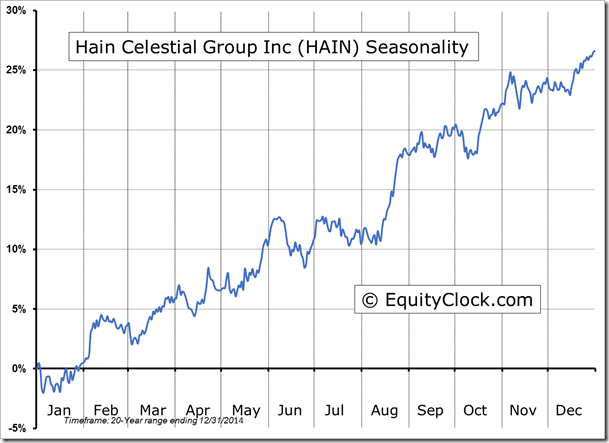
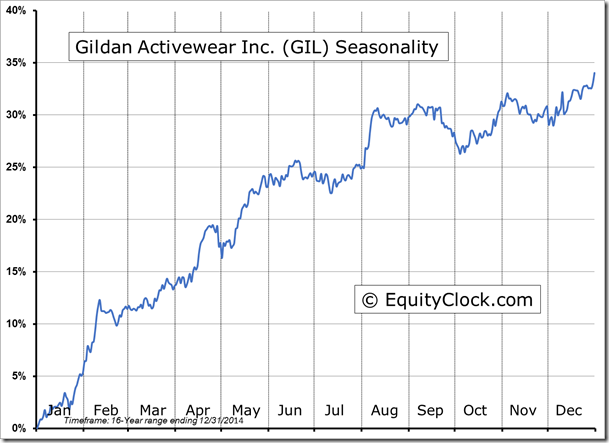
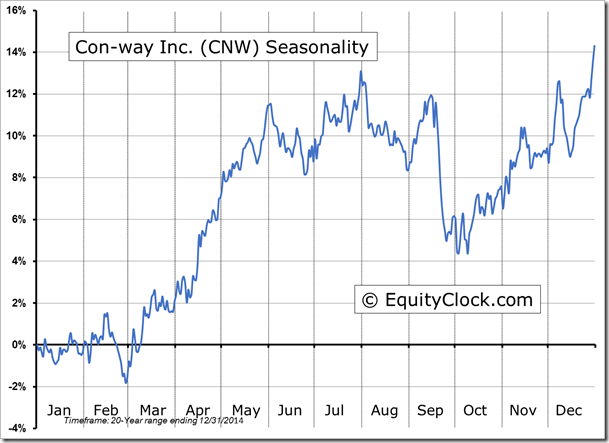
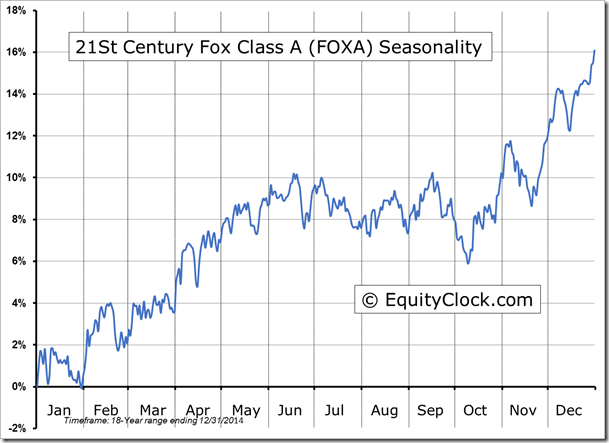
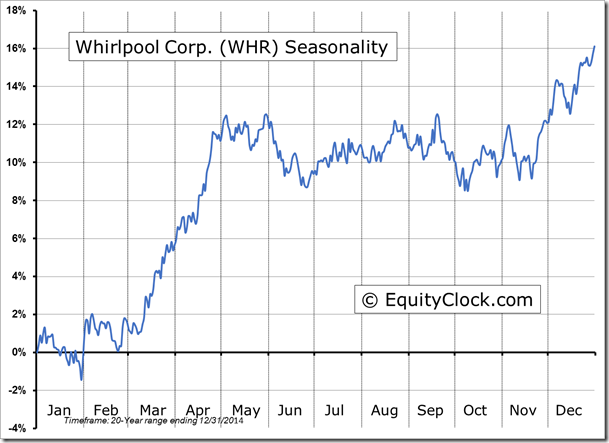
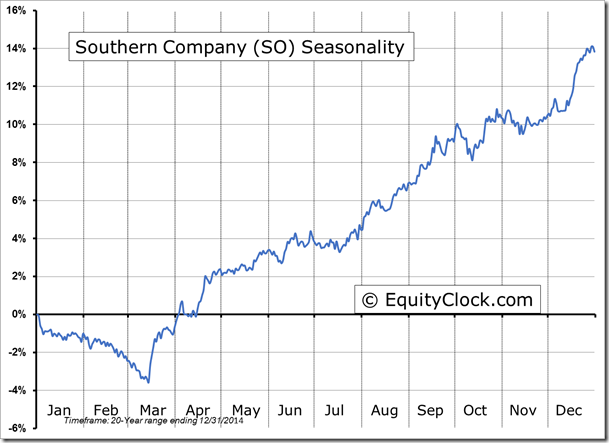
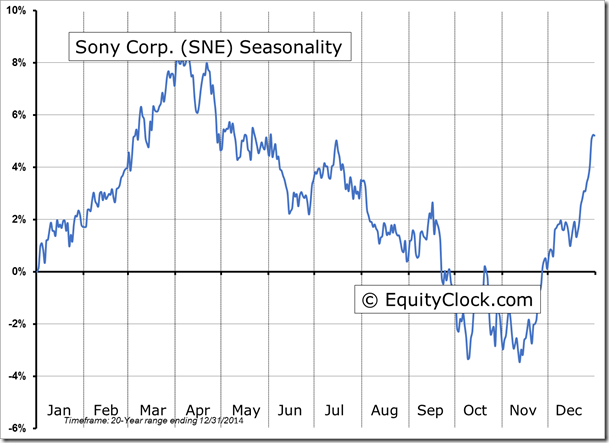
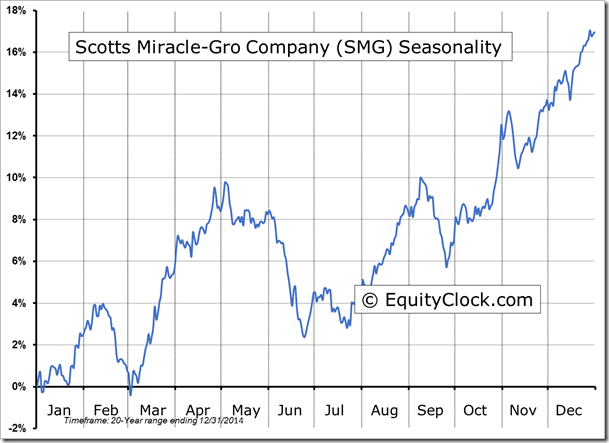
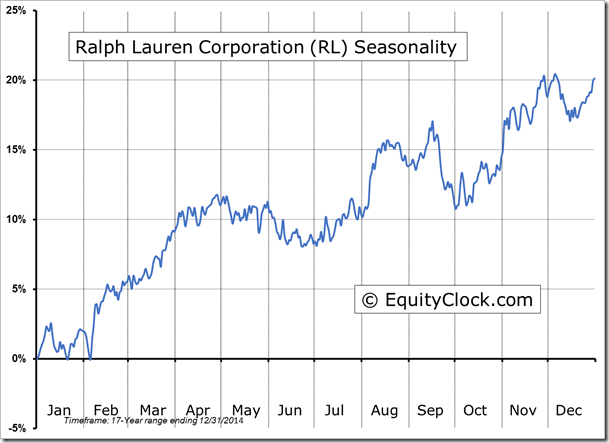
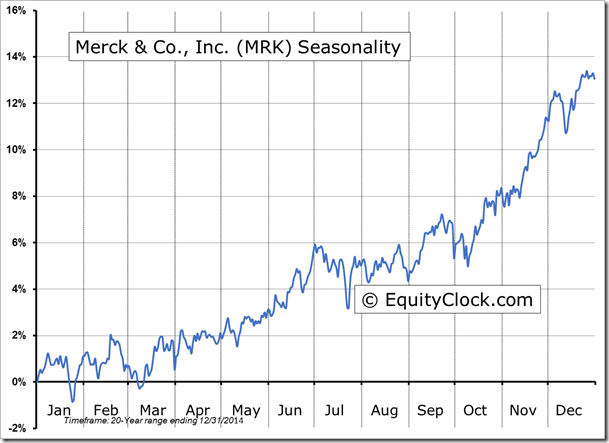
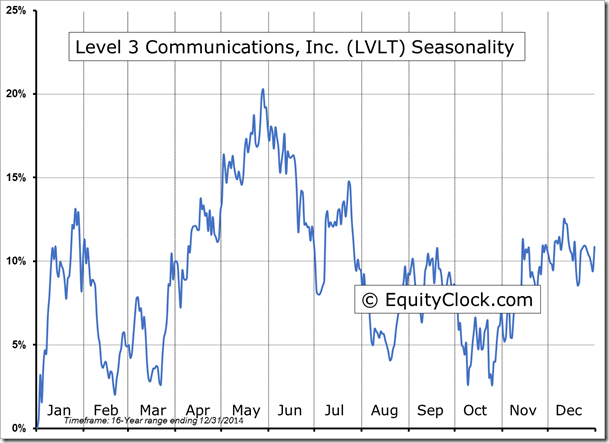
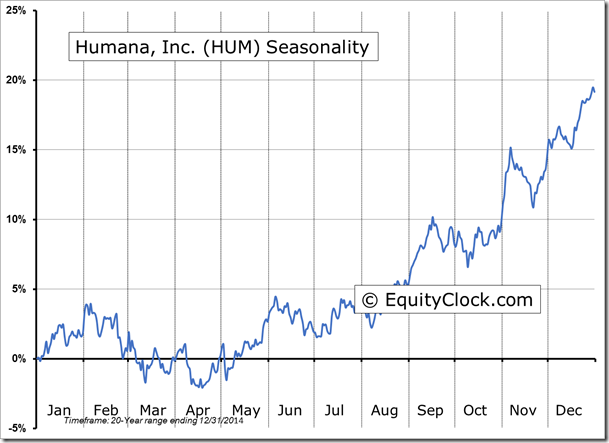
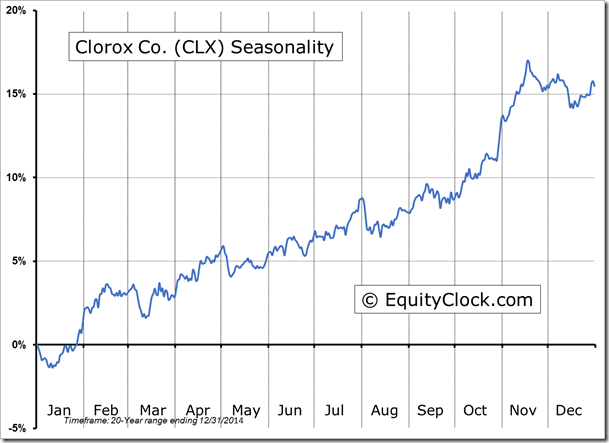
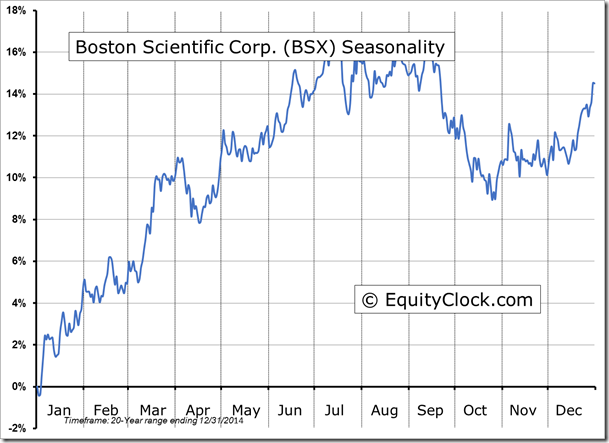
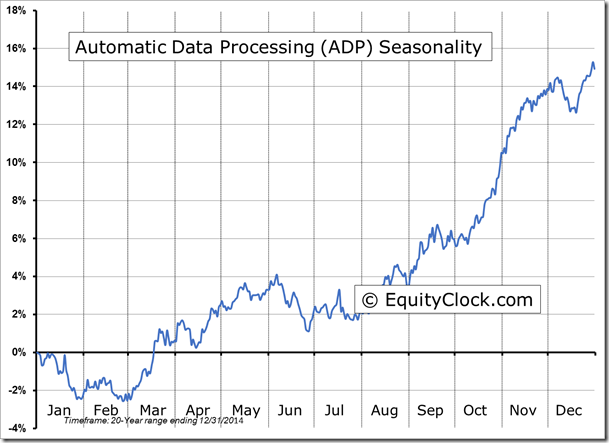
Seasonal charts of companies reporting earnings today:
S&P 500 Index
TSE Composite
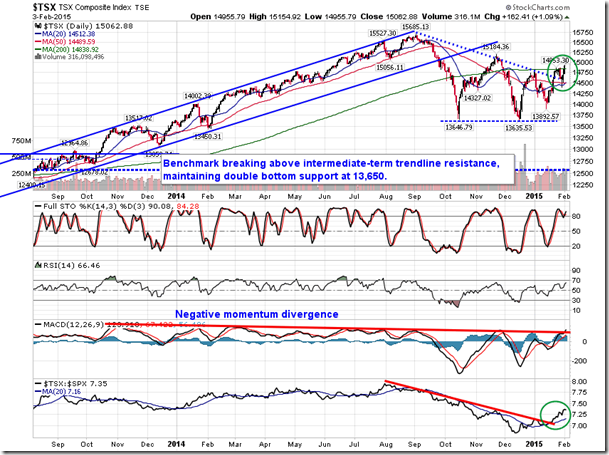
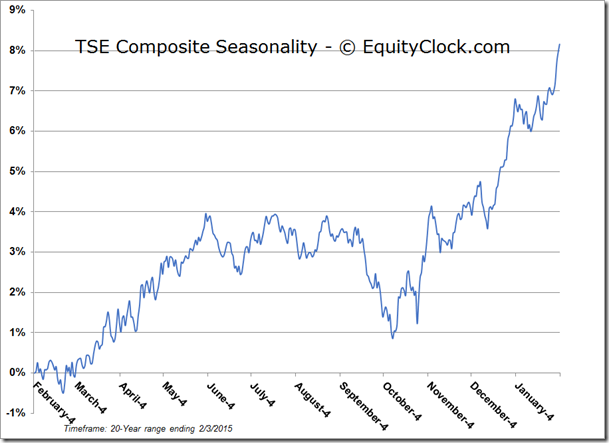
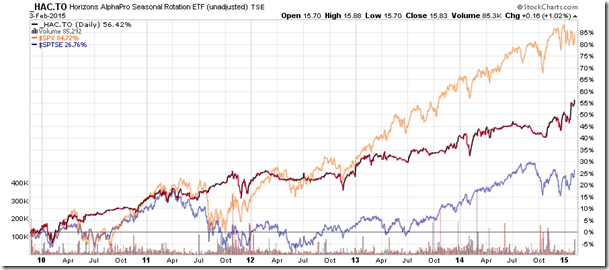
Horizons Seasonal Rotation ETF (TO:HAC)
- Closing Market Value: $15.83 (up 1.02%)
- Closing NAV/Unit: $15.81 (up 0.82%)
Performance
| 2015 Year-to-Date | Since Inception (Nov 19, 2009) | |
| HAC.TO | 4.49% | 58.1% |
* performance calculated on Closing NAV/Unit as provided by custodian
Disclaimer: Stocks highlighted are for information purposes only and should not be considered as advice to purchase or to sell mentioned securities. As always, the use of technical and fundamental analysis is encouraged in order to fine tune entry and exit points to average seasonal trends.
