Stocks Entering Period of Seasonal Strength Today:
-
No stocks identified for today
The Markets
Stocks finished mixed on Wednesday following the release of the latest meeting minutes from the FOMC. The release showed that policy makers intend to remain patient in raising rates, respecting concerns that a premature increase may dampen recent economic strength.
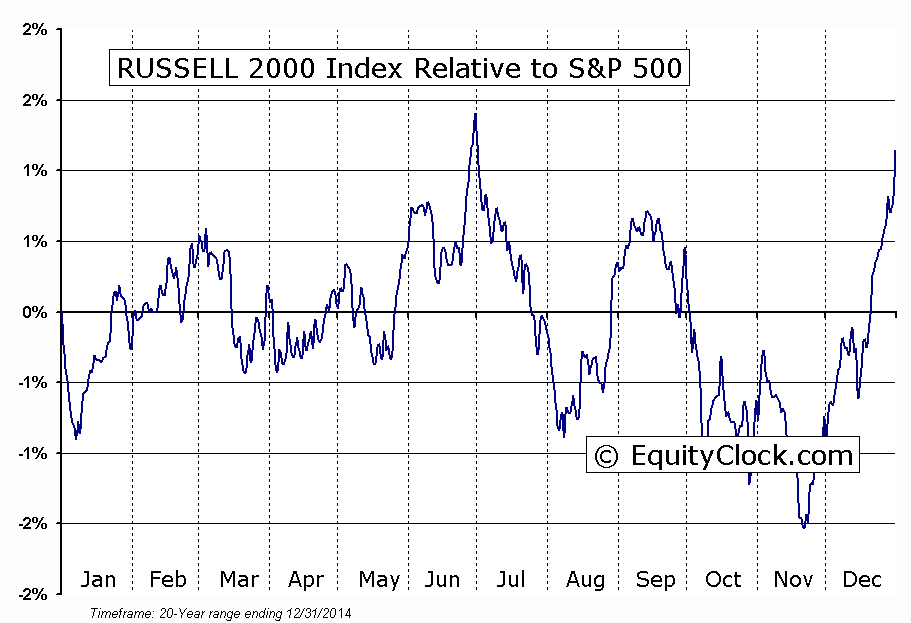
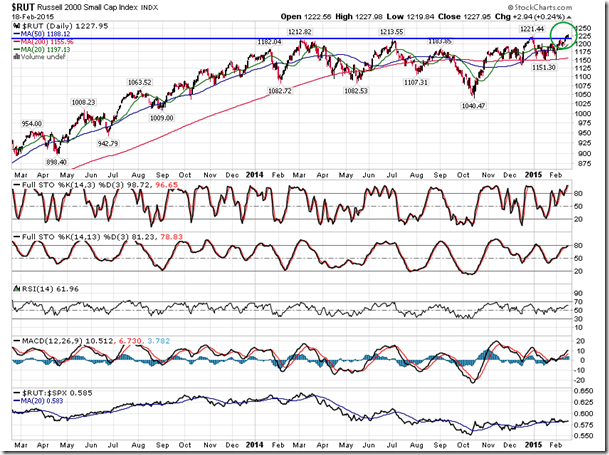
The Russell 2000 Small Cap index charted another record closing high, continuing to break above resistance that bound trading activity for the past 12 months. Strength in the small cap index is typically an excellent gauge of the risk sentiment amongst investors, which suggests further upside potential ahead.
The relative performance of the benchmark has been on par with the large-cap S&P 500 Index for the past few weeks, however, this is a positive change from the declining relative performance that spanned most of 2014 when investors were reluctant to be exposed to too much risk amidst the Fed’s taper program. Seasonally, the small cap benchmark remains strong through to the start of March.
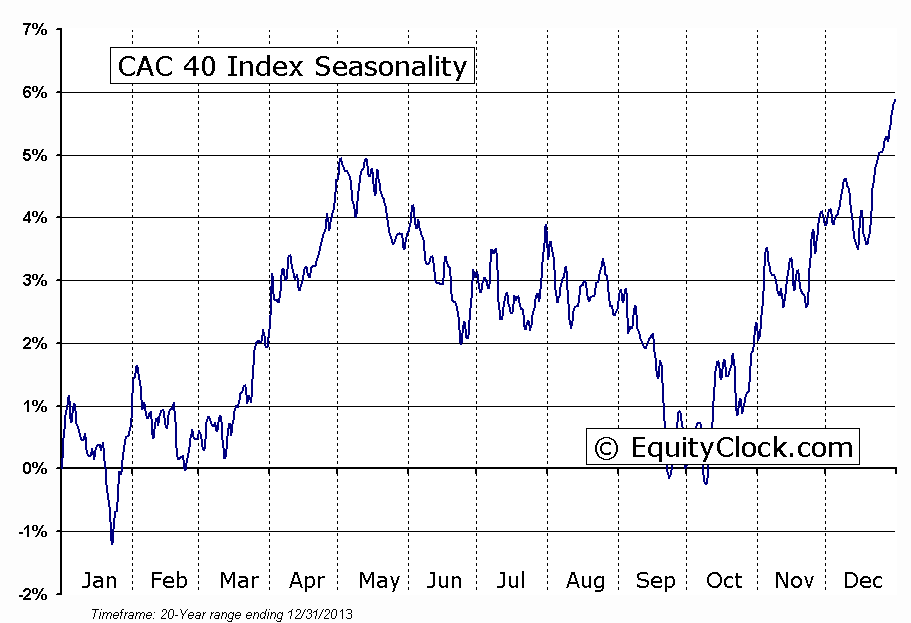
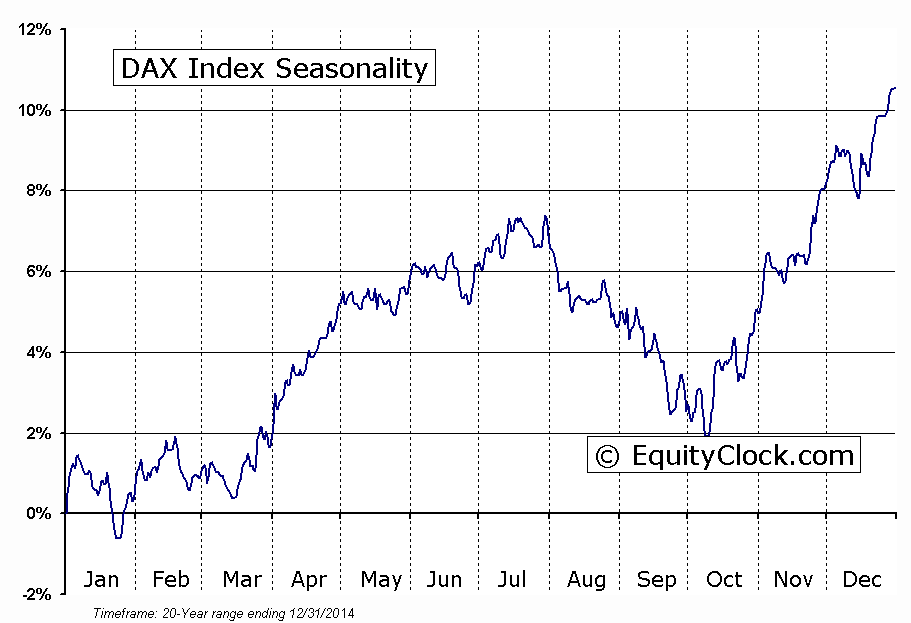
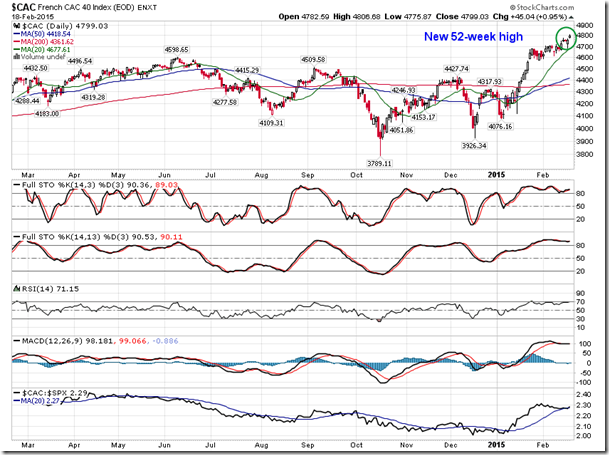
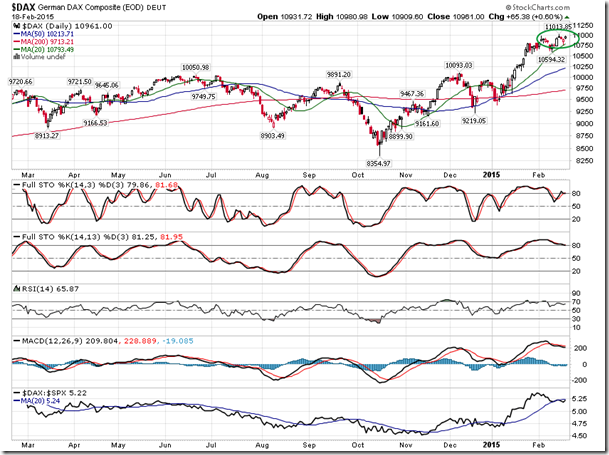
While investors continue to rotate towards the previously lagging Russell 2000 Index, they are also being drawn towards European equities. The French CAC 40 charted a new 52-week high during Wednesday’s session, while the German DAX continues to hold around all-time highs.
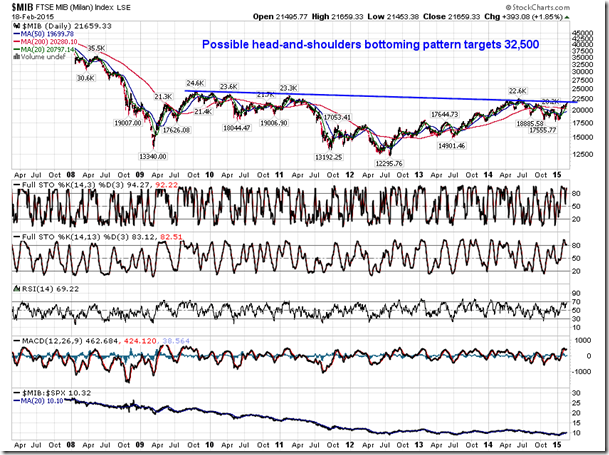
The chart of the FTSE MIB Index is showing what appears to be a long-term head-and-shoulders bottoming pattern, the upside target of which points to 32,500, or around 50% higher than present levels.Each benchmark has been outperforming US benchmarks since the year began, benefitting from the accommodative monetary policy enacted by the ECB. Assuming the situation in Greece does not derail the recovery, the strength in European equity markets looks set to continue, following seasonal norms that run through to the start of May.
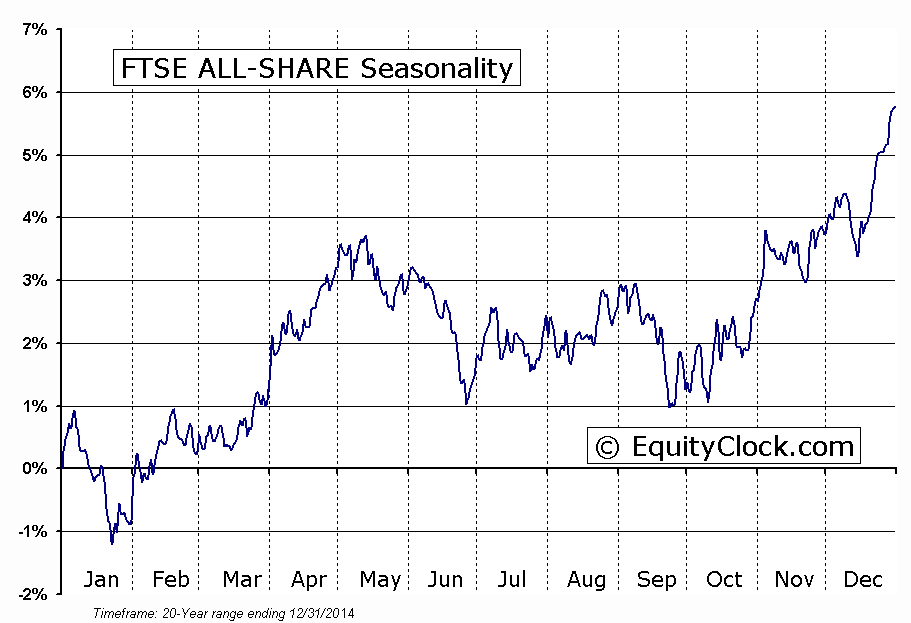
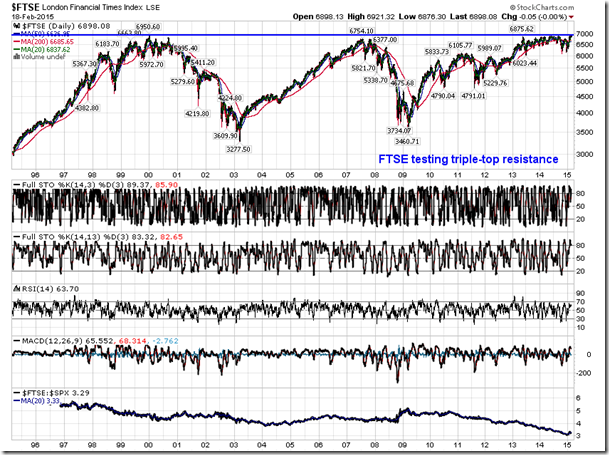
Also benefiting from the European stimulus are equities in the UK, which, thus far, is following its familiar seasonal pattern of gains from mid-October through to May. The London FTSE is presently pushing up against resistance around 6900, a level that has restrained the benchmark for over 15 years.
Investors love significant milestones in equity markets and a breakout in this benchmark has a high likelihood of fuelling further upside momentum. The FTSE has been underperforming the S&P 500 Index since 2009, but the strong performance in January suggests the trend may be changing. Seasonal gains continue through to the second week of May, on average.
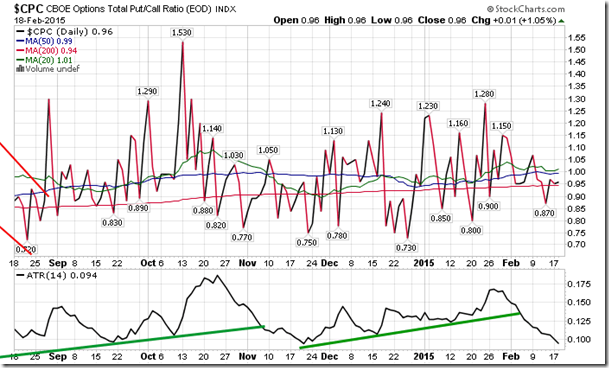
Sentiment on Wednesday, as gauged by the put-call ratio, ended bullish at 0.96.
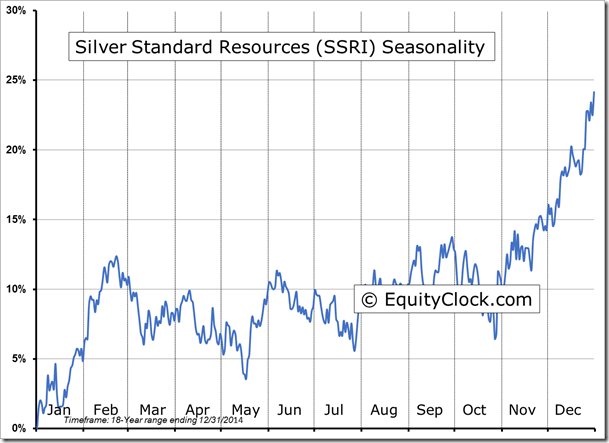
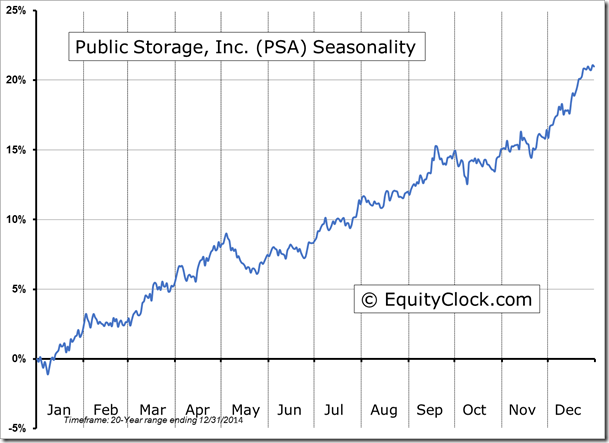
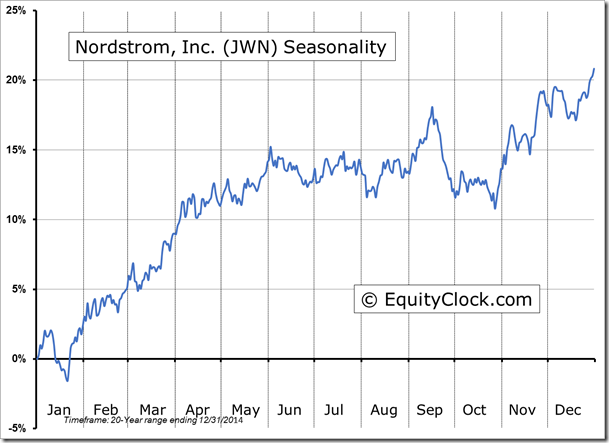
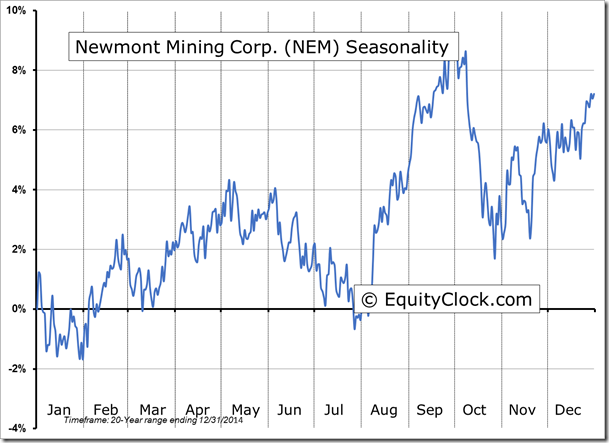
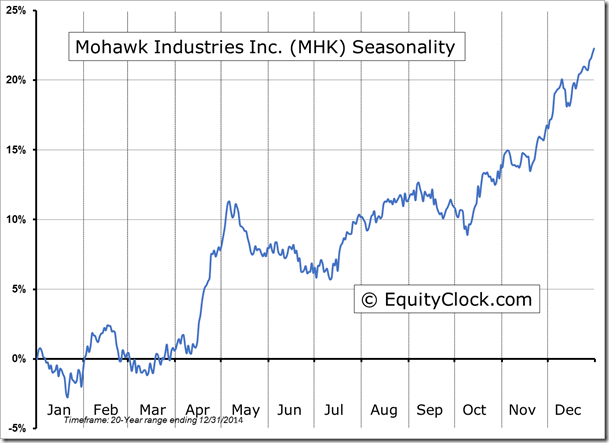
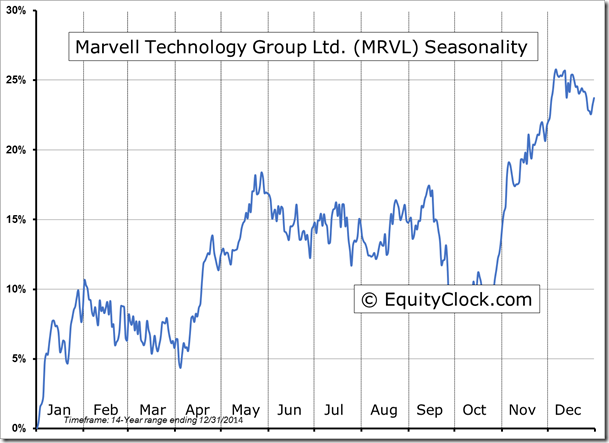
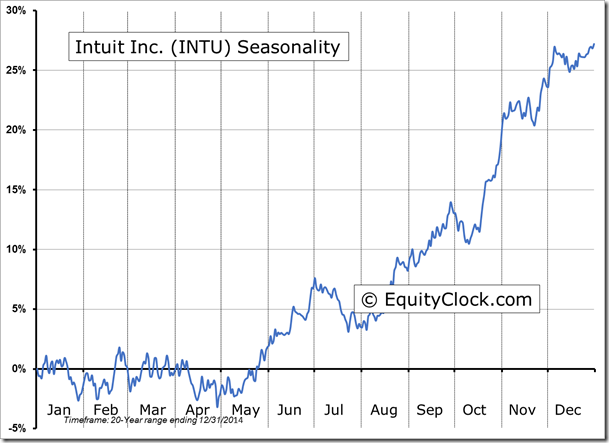
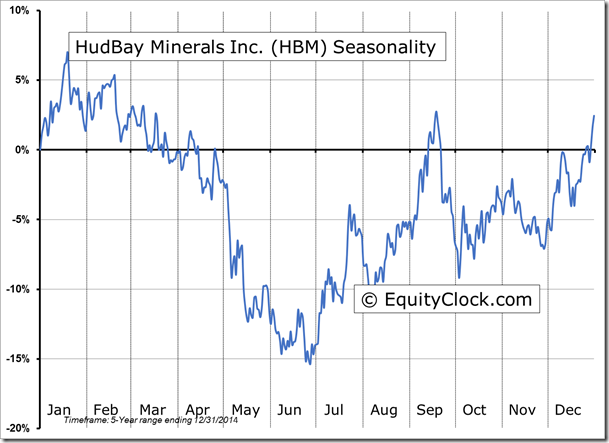
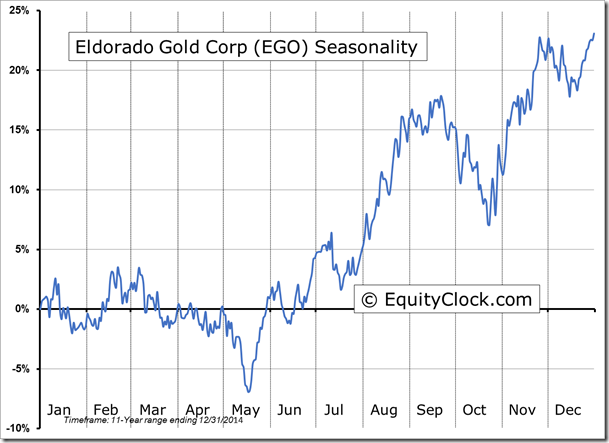
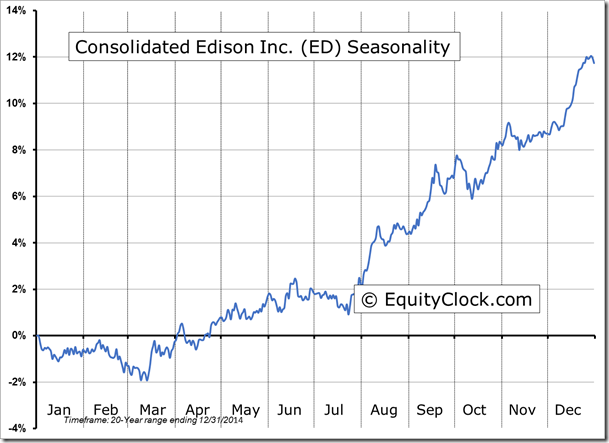
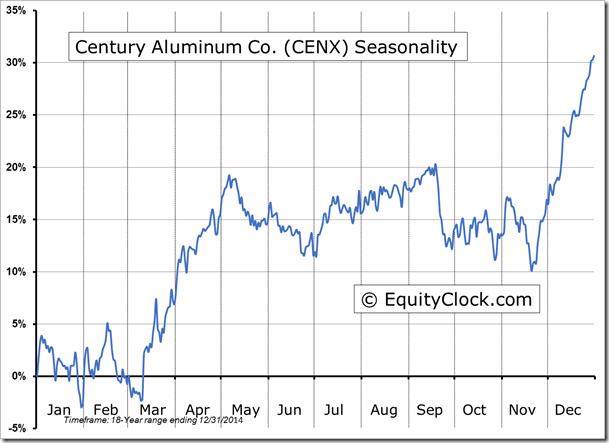
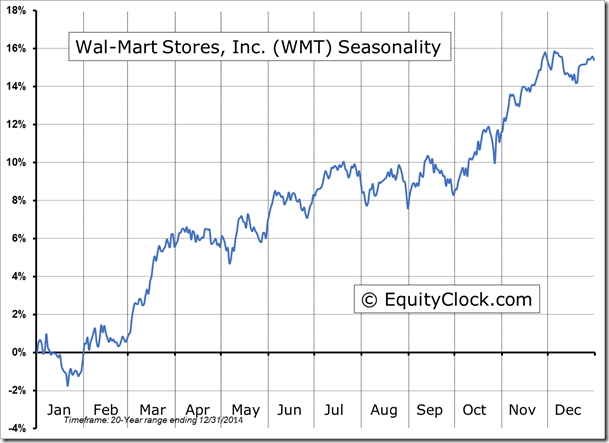
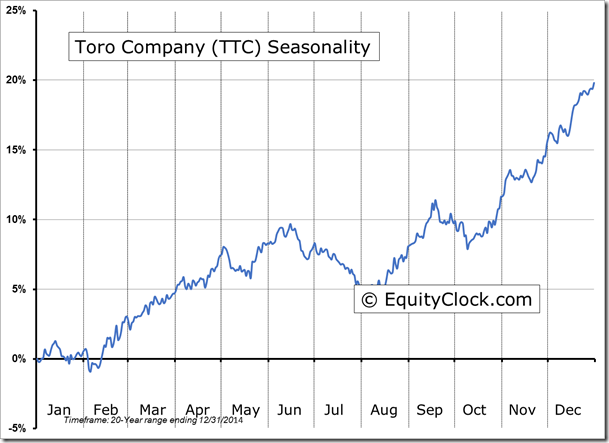
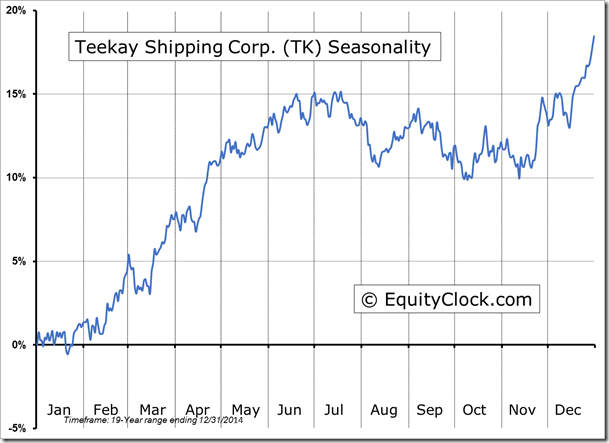
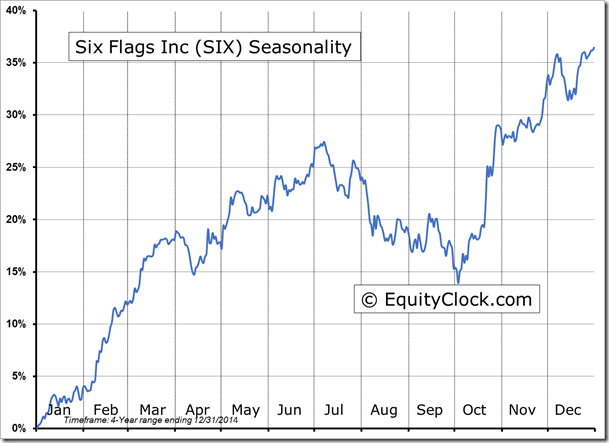
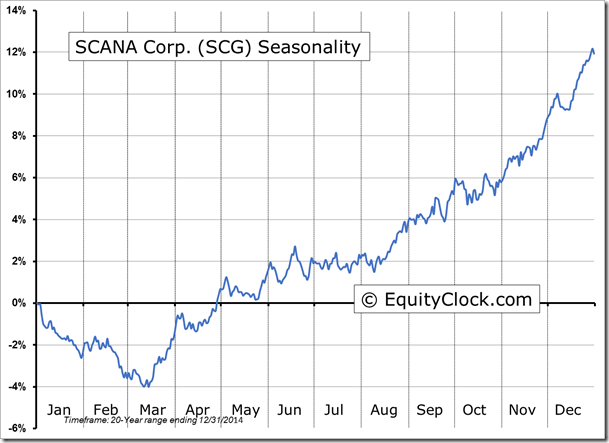
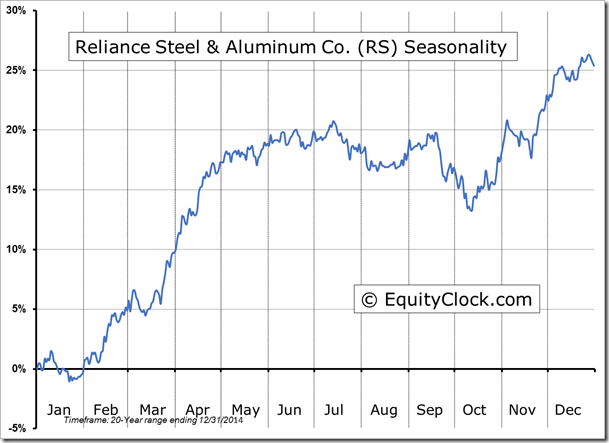
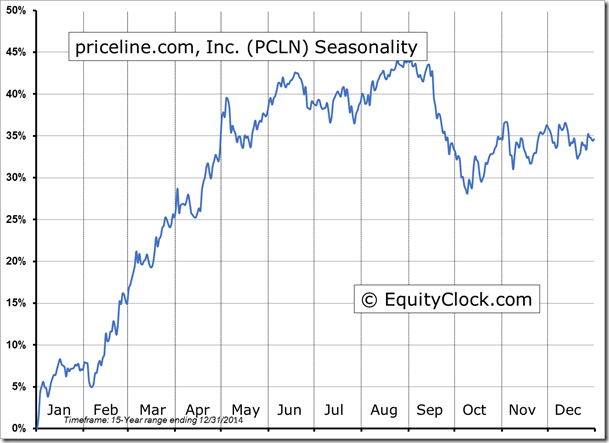
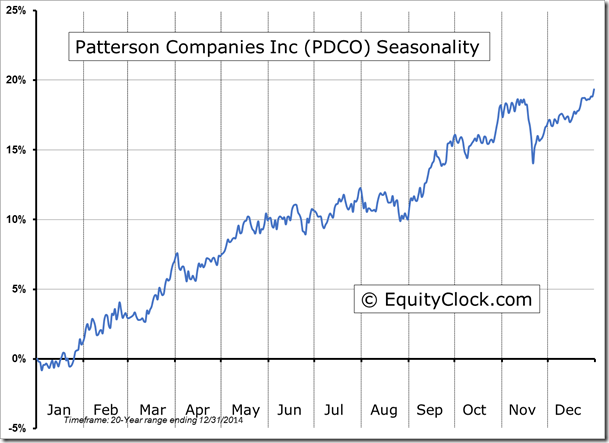
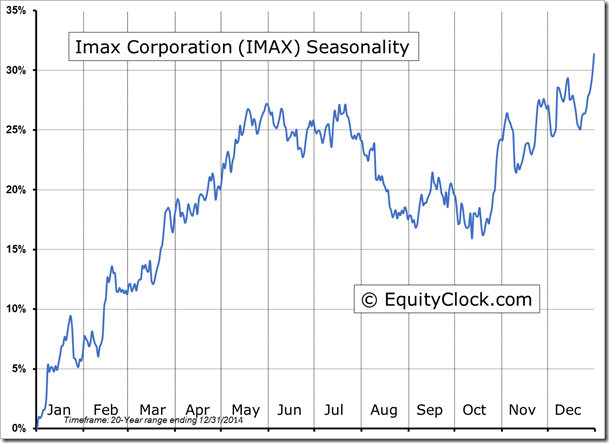
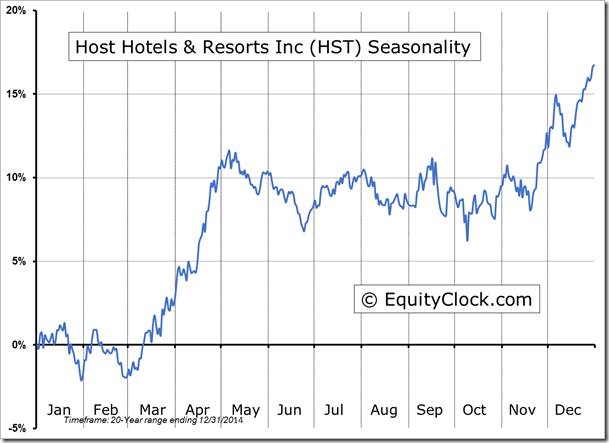
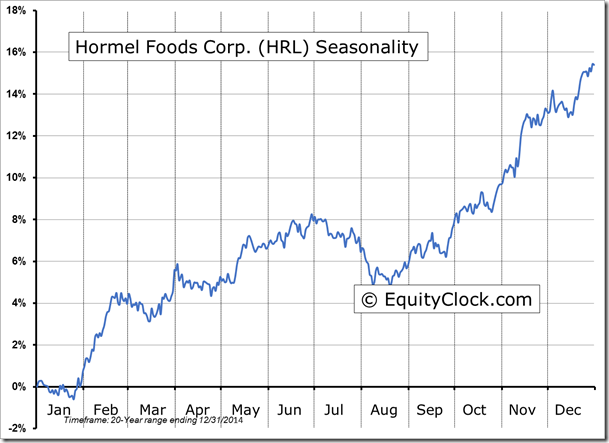
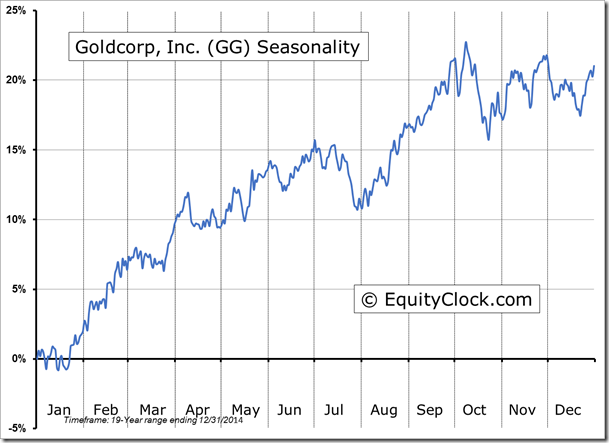
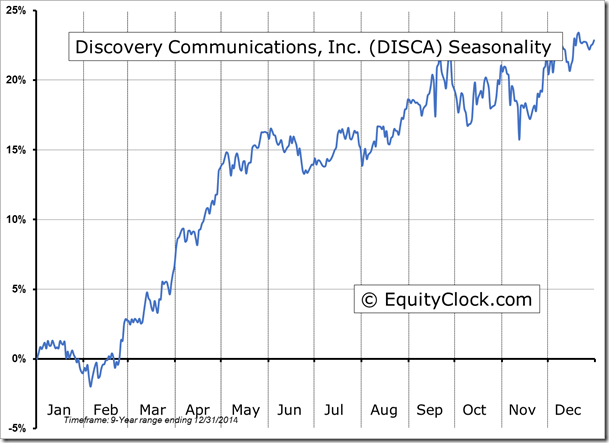
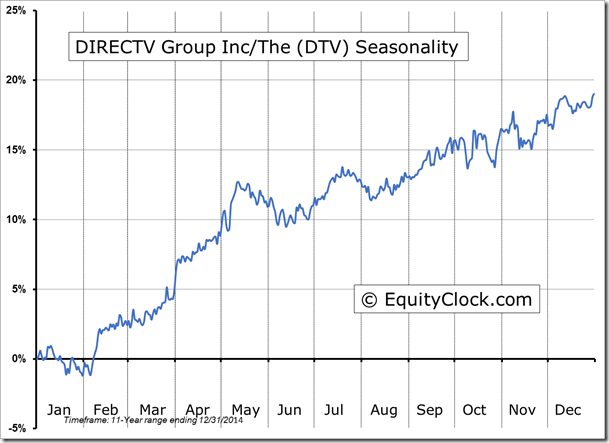
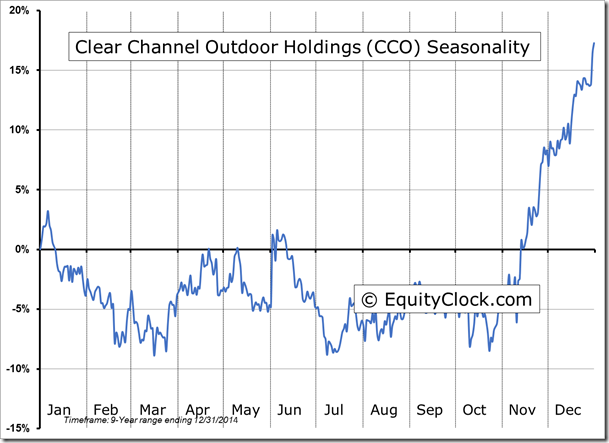
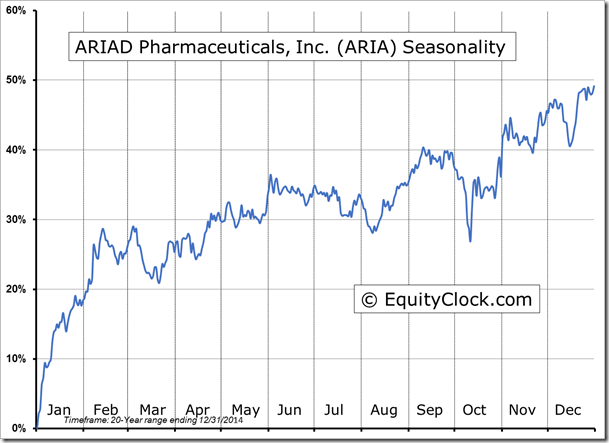
Seasonal charts of companies reporting earnings today:
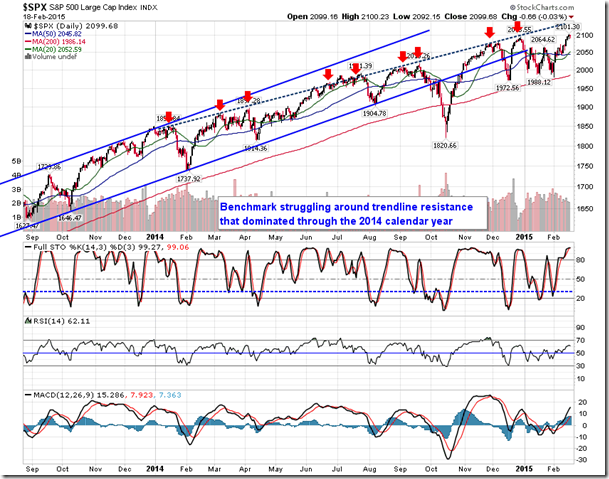
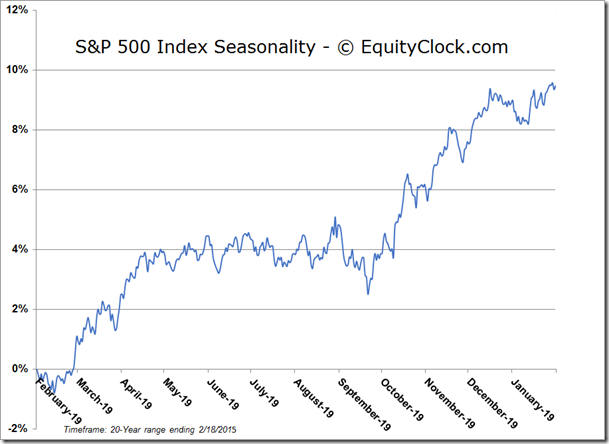
S&P 500 Index
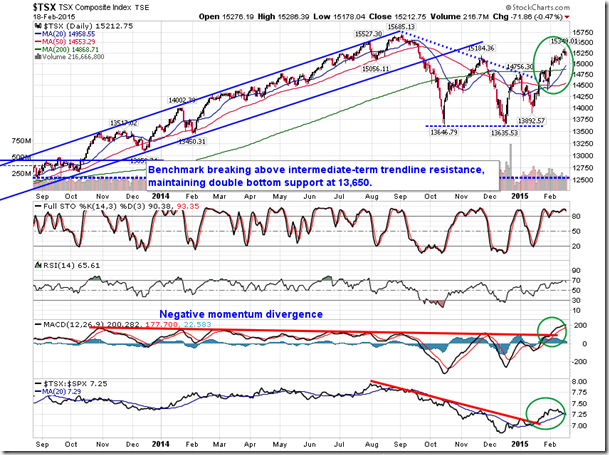
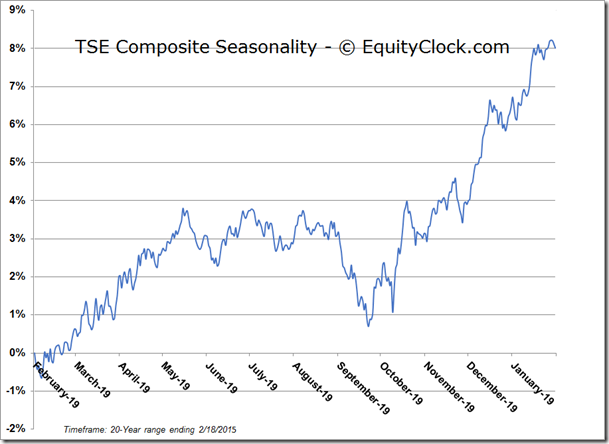
TSE Composite
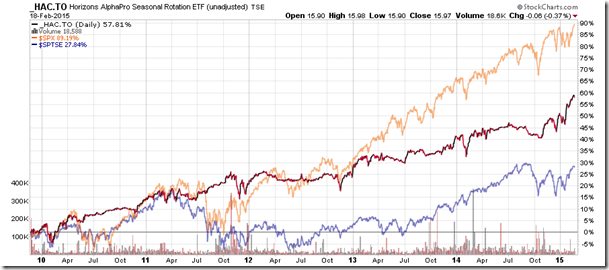
Horizons Seasonal Rotation ETF (TO:HAC)
- Closing Market Value: $15.97 (down 0.37%)
- Closing NAV/Unit: $15.98 (down 0.25%)
Performance*
| 2015 Year-to-Date | Since Inception (Nov 19, 2009) | |
| HAC.TO | 5.62% | 59.8% |
* performance calculated on Closing NAV/Unit as provided by custodian
Disclaimer: Stocks highlighted are for information purposes only and should not be considered as advice to purchase or to sell mentioned securities. As always, the use of technical and fundamental analysis is encouraged in order to fine tune entry and exit points to average seasonal trends.

