Stocks Entering Period of Seasonal Strength Today:
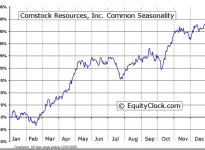
Comstock Resources, (NYSE:CRK) Seasonal Chart
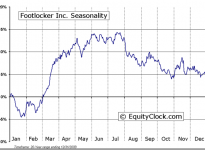
Foot Locker, (NYSE:FL) Seasonal Chart
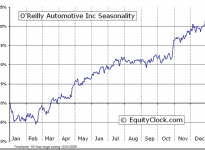
O’Reilly Automotive, (NASDAQ:ORLY) Seasonal Chart
The Markets
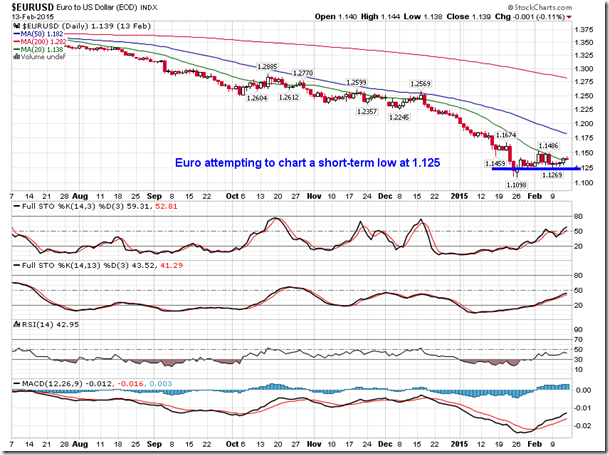
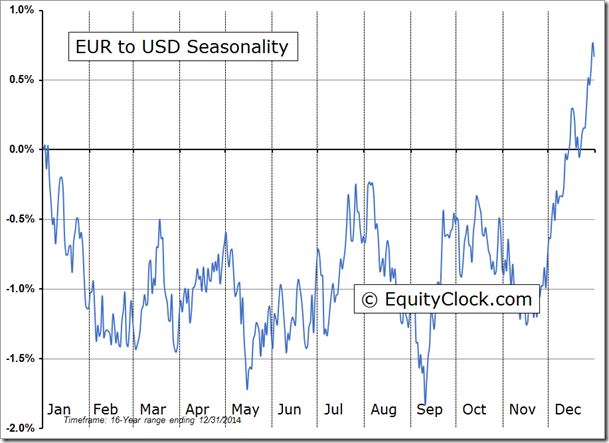
Stocks ended marginally higher on Tuesday, buoyed by optimism that Greece will reach a deal to satisfy creditors. The Euro continued to firm upon recent gains, attempting to chart a short-term double-bottom pattern around 1.125. The currency rebounding from some of the most oversold levels in its over 16 year history. Short-term resistance around the 20-day moving average is presently being tested; significant resistance around the 50-day moving average, currently at 1.182, continues to suggest an upper limit to any potential rebound rally. Seasonally, the Euro, in US Dollar terms, typically trades flat in February and March, charting a bottom, on average, following the weak month of January.
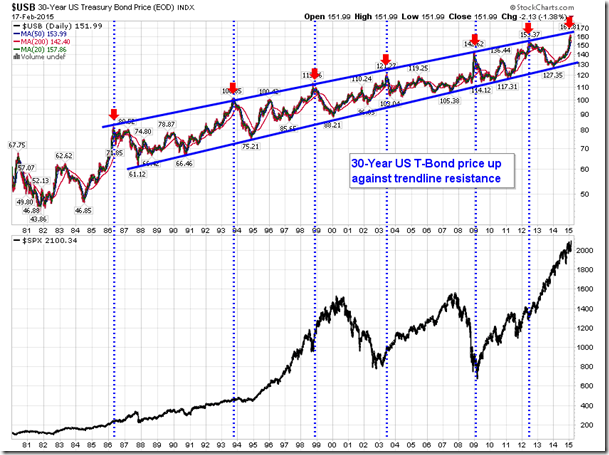
The big story of the day was the substantial rise in US Treasury yields following the collapse of prices as investors flee the apparent safe-haven trade that has dominated for the past 13 months. We had been writing rather exhaustively over recent weeks about 30-year bond prices hitting long-term trendline resistance, a level that has resulted in many intermediate peaks in bond prices; bond prices have typically declined in the 12-month period that followed.
The beneficiary from the bond market sell-off during those past instances was the equity market as investors rotated out of the fixed income asset class and into riskier investments. Should the 30-Year T-Bond trade back down to trendline support at 135 over the weeks and months ahead, the decline would shed around 16.5% in value, a significant move for a fixed income investment.
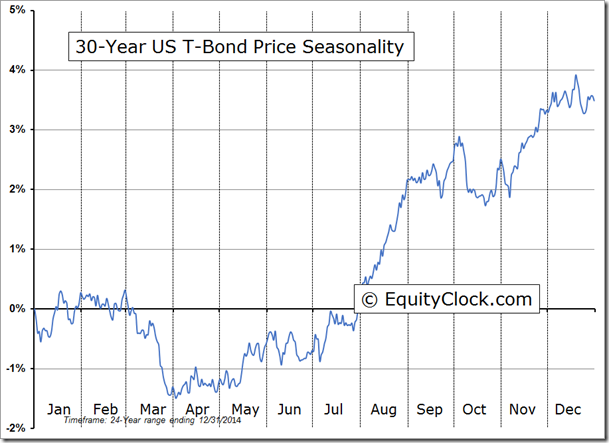
Seasonally, treasury prices trade lower between now and the end of April as investors take on more risk in the equity market; the month of March is by far the weakest period of the year for the treasury bond, declining by an average of 1.6%. The 30-Year Treasury Bond has declined in March 87% of the time over the past 24 years, a significant frequency for any asset class. Bonds seasonally come back into favor during the summer months when investors tend to be more risk averse.
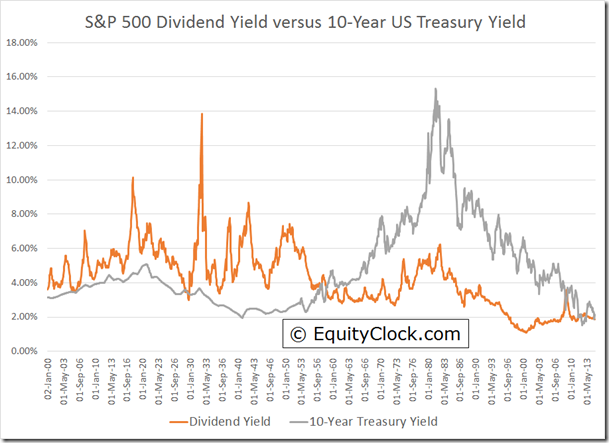
One of the reasons that investors may rotate away from bonds and into stocks is that the yield on the 10-Year treasury note is approximately equivalent to the S&P 500 dividend yield. Since the middle of the last century, treasury yields have exceeded the dividend yield, enticing investors towards the fixed income asset class.
With yields converging, the competitive advantage of treasury bonds has now been eliminated. Investors may now be willing to question which asset class will provide the best return over the long run. A rotation from bonds into stocks would increase the treasury yields and pressure dividend yields lower, once again opening the gap between the two asset classes that has persisted since the late 1950’s.
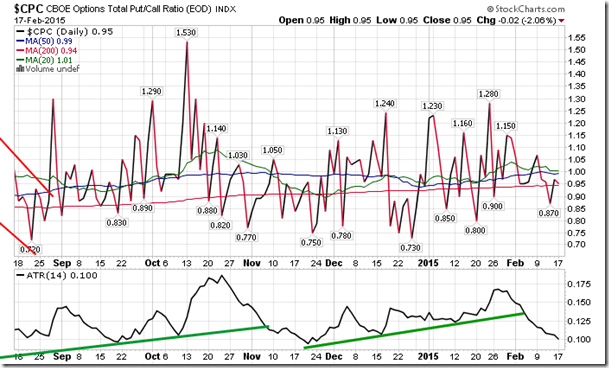
Sentiment on Tuesday, as gauged by the put-call ratio, ended bullish at 0.95.
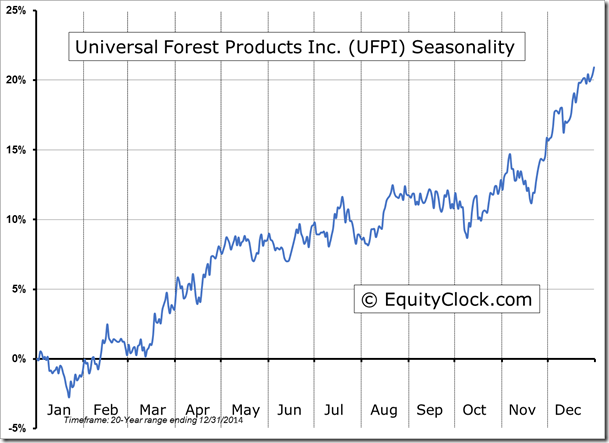
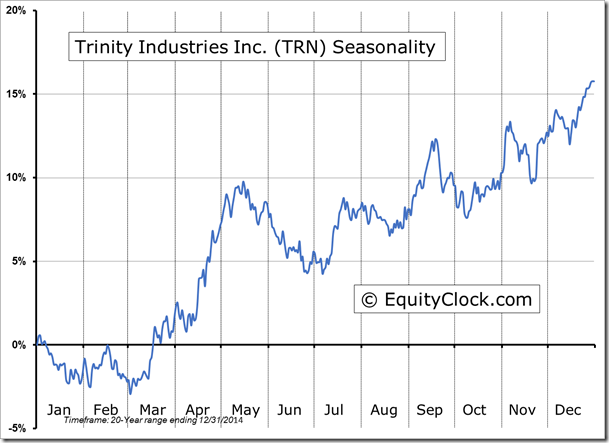
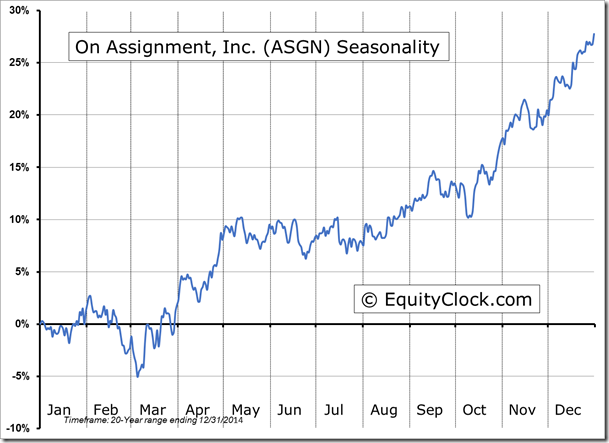
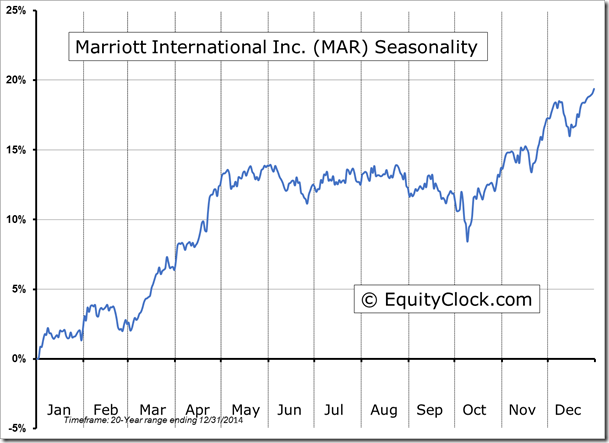
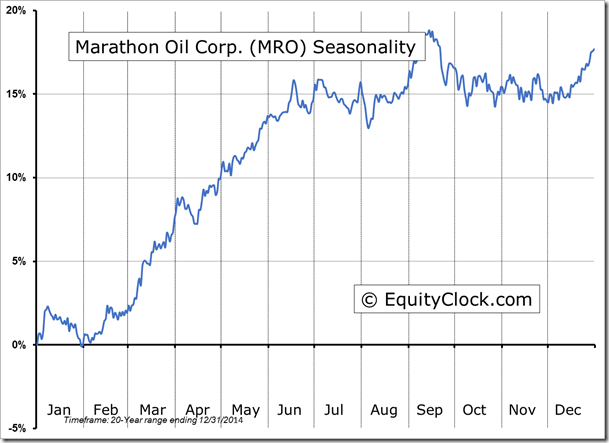
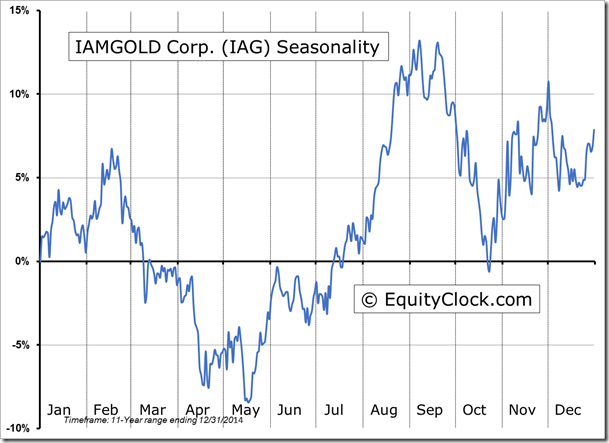
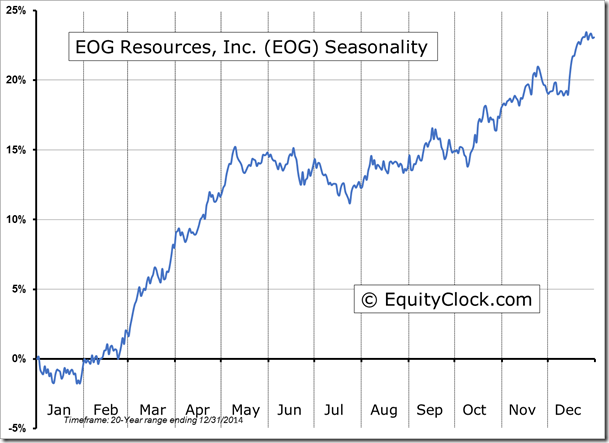
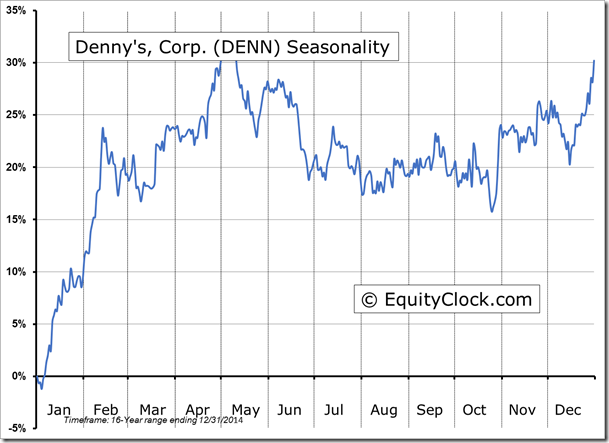
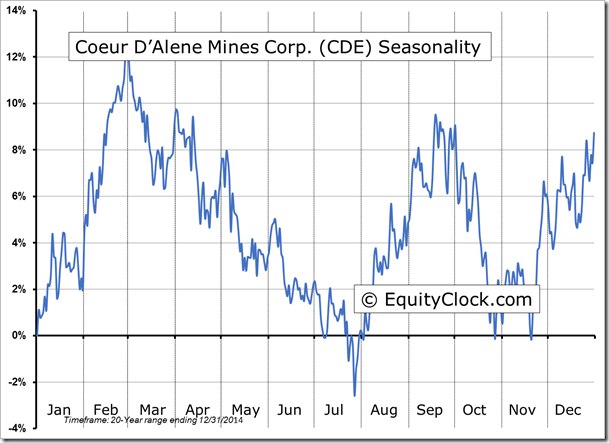
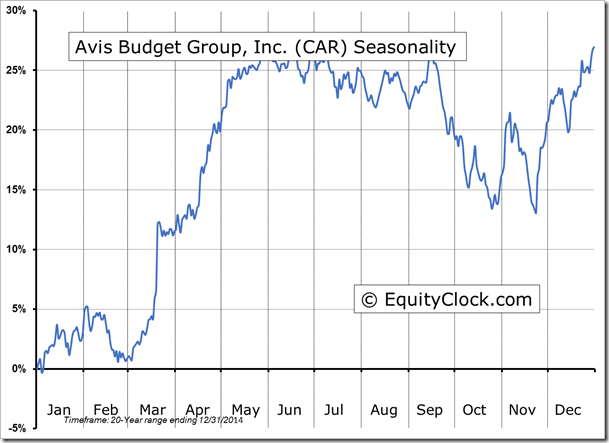
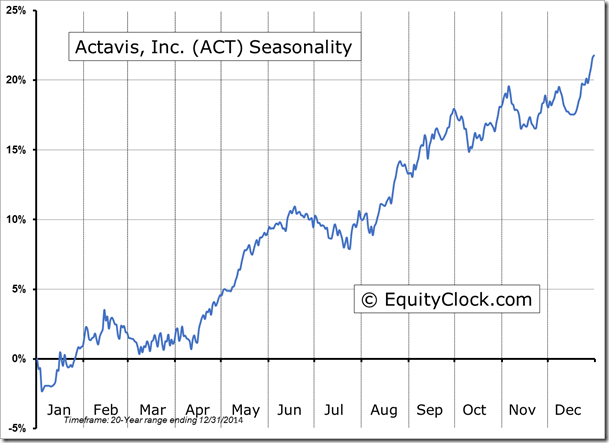
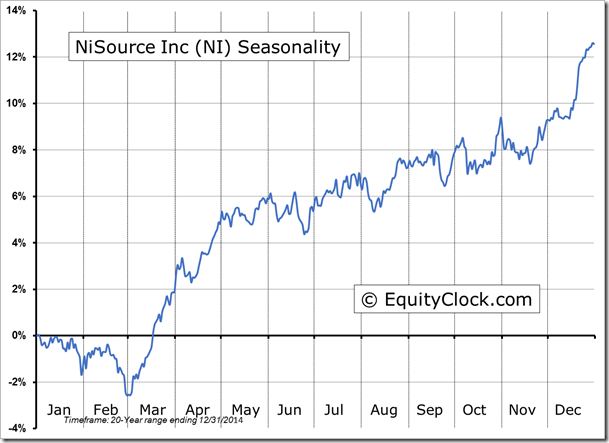
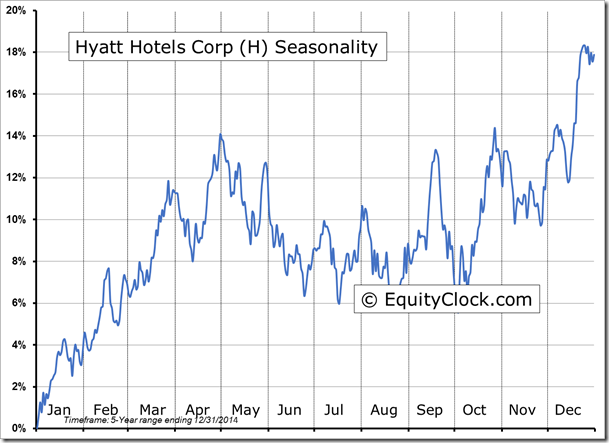
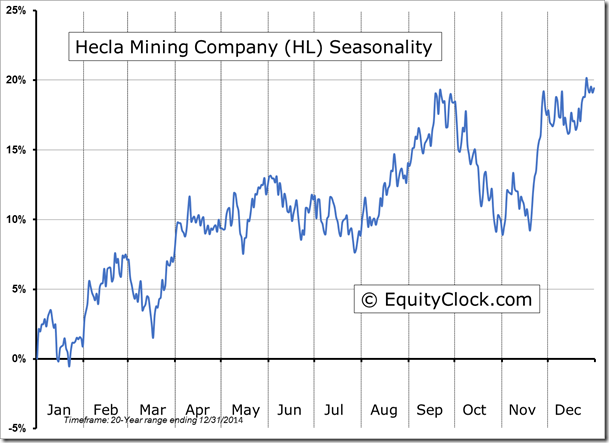
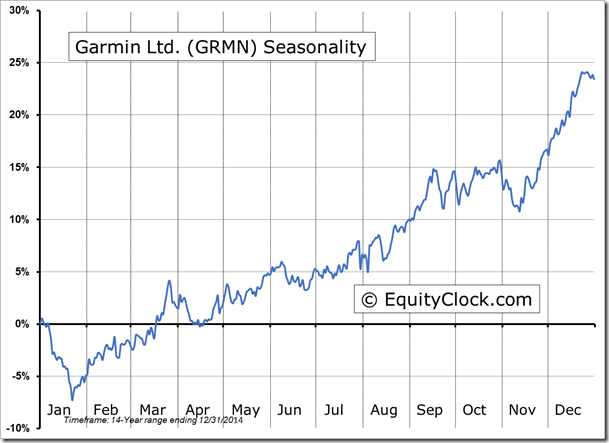
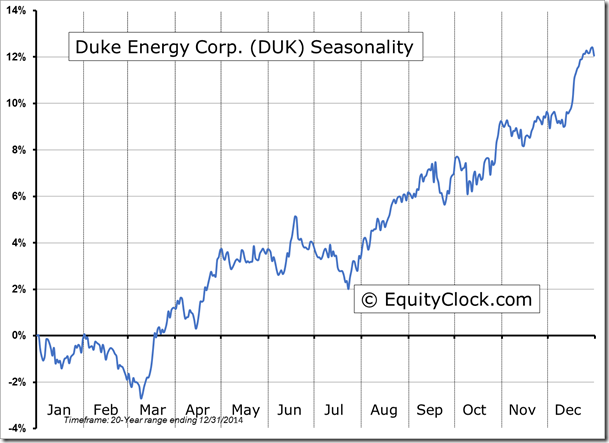
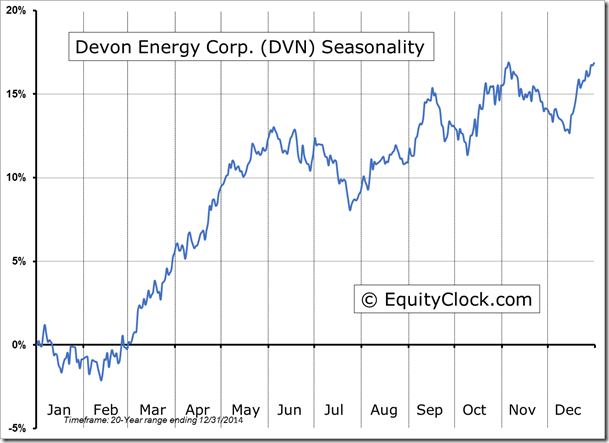
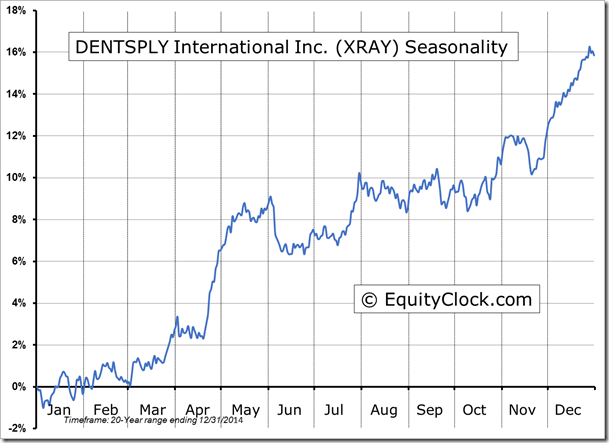
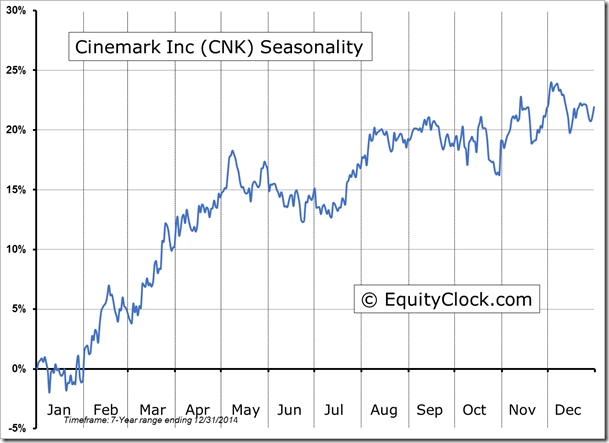
Seasonal charts of companies reporting earnings today:
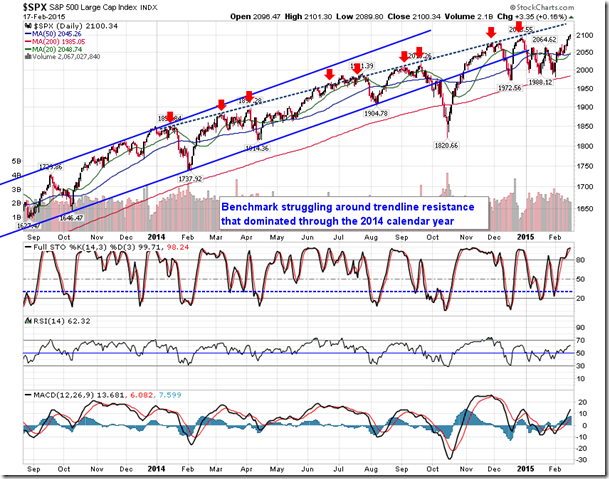
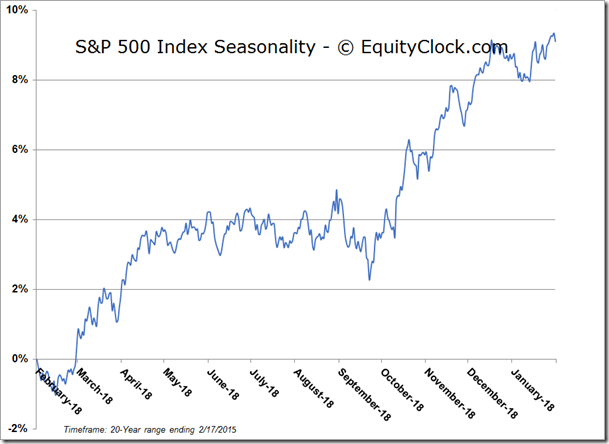
S&P 500 Index
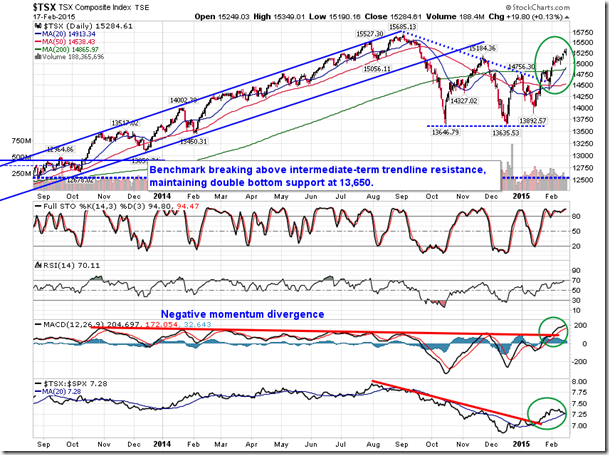
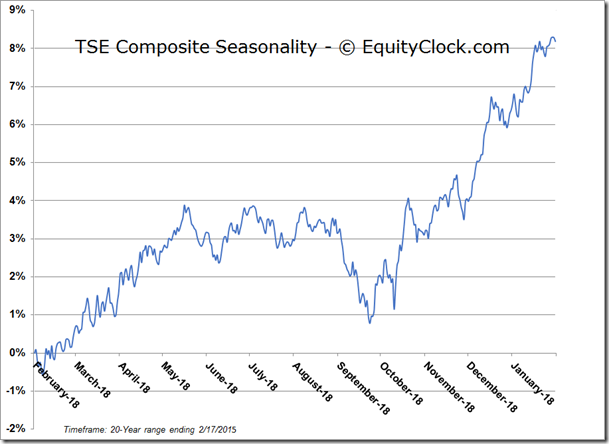
TSE Composite
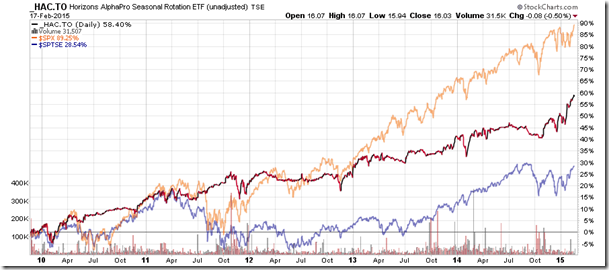
Horizons Seasonal Rotation (TO:HAC)
- Closing Market Value: $16.03 (down 0.50%)
- Closing NAV/Unit: $16.02 (down 0.40%)
Performance*
| 2015 Year-to-Date | Since Inception (Nov 19, 2009) | |
| HAC.TO | 5.88% | 60.2% |
* performance calculated on Closing NAV/Unit as provided by custodian
Disclaimer: stocks highlighted are for information purposes only and should not be considered as advice to purchase or to sell mentioned securities. As always, the use of technical and fundamental analysis is encouraged in order to fine tune entry and exit points to average seasonal trends.
