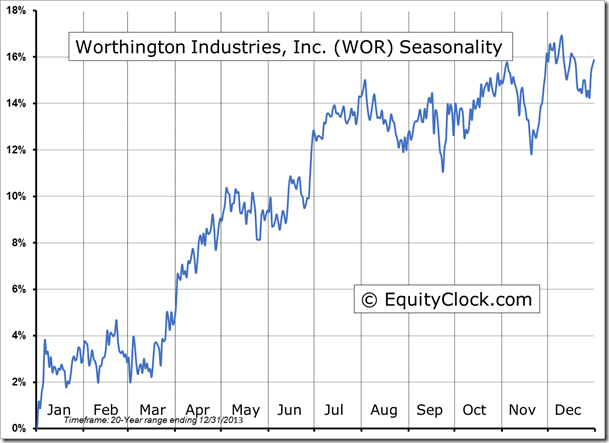
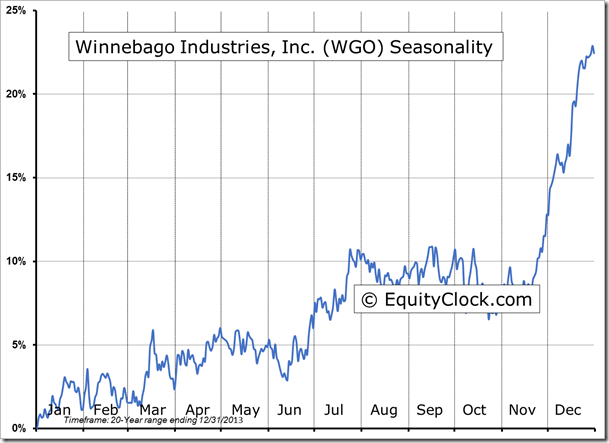
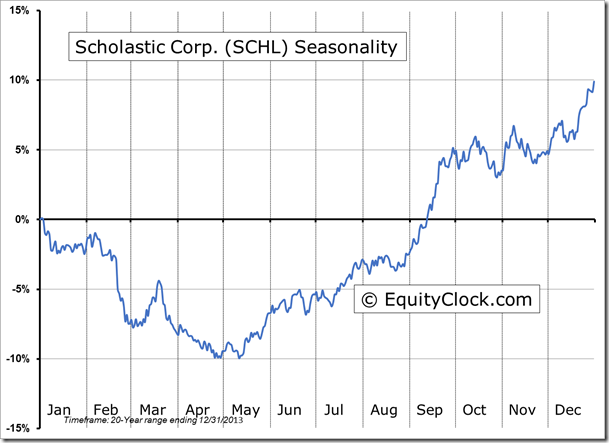
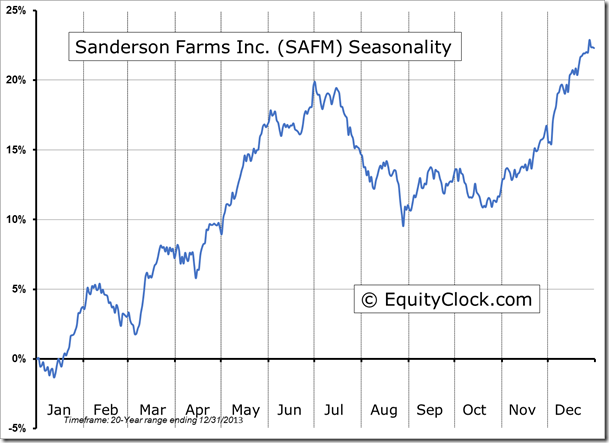
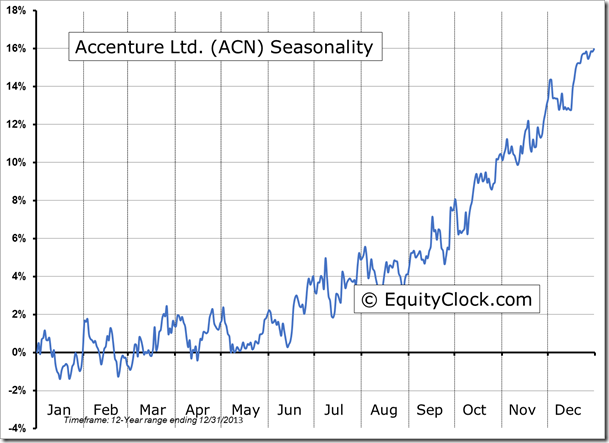
**NEW** As part of the ongoing process to offer new and up-to-date information regarding seasonal and technical investing, we are adding a section to the daily reports that details the stocks that are entering their period of seasonal strength, based on average historical start dates. Stocks highlighted are for information purposes only and should not be considered as advice to purchase or to sell mentioned securities. As always, the use of technical and fundamental analysis is encouraged in order to fine tune entry and exit points to average seasonal trends.
Stocks Entering Period of Seasonal Strength Today:
Papa John’s Int’l, Inc. (NASDAQ:PZZA) Seasonal Chart
CVS Caremark Corporation (NYSE:CVS) Seasonal Chart
The Markets
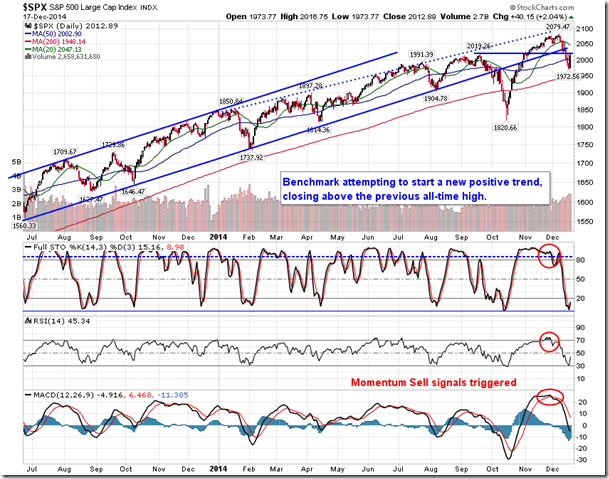
Stocks surged on Wednesday as investors welcomed the ongoing commitment from the Fed to keep rates low for a considerable period of time, despite continued improvement in economic data in the US. The S&P 500 Index recorded the strongest gain of the year, returning 2.04% by the closing bell, instantly erasing the losses for the week. The greater than two percent return was the strongest since October of 2013, emphasizing the lack of volatility realized in the US equity market over the past year. Over the past 20 years, the average number of sessions in a given year that saw a gain of 2% or more was around 10, dominated by years both leading up to and immediately following significant market peaks. The below average number of 2% plus days is suggestive of a maturing bull market as investors bid prices higher in a gradual manner. The lack of upside volatility may offer a smoother return profile, however, the opportunities to obtain ideal entry points on significant dips is also limited.
| Number of sessions that realized a gain of 2% or more in a given year | |
| Year | Count |
| 2014 | 1 |
| 2013 | 2 |
| 2012 | 3 |
| 2011 | 14 |
| 2010 | 12 |
| 2009 | 27 |
| 2008 | 31 |
| 2007 | 6 |
| 2006 | 2 |
| 2005 | 0 |
| 2004 | 0 |
| 2003 | 10 |
| 2002 | 23 |
| 2001 | 12 |
| 2000 | 18 |
| 1999 | 14 |
| 1998 | 11 |
| 1997 | 9 |
| 1996 | 0 |
| 1995 | 0 |
| 1994 | 1 |
| Average | 9.75 |
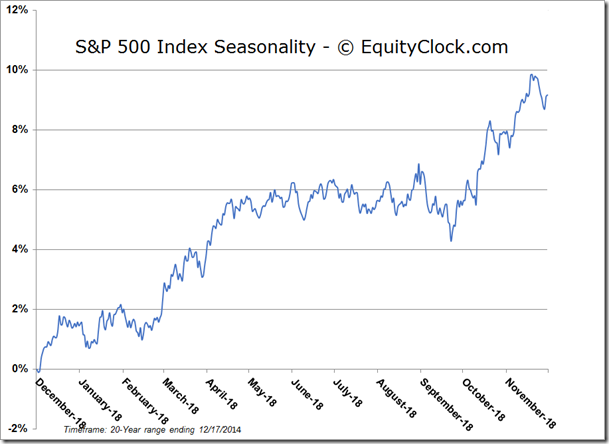
Of course, with the surge in equity prices on Wednesday, investors are widely taking about this being the start of the Santa Claus rally. As of Monday, the period of short-term weakness that is typically attributed to tax-loss selling came to an end; the period of strength that provides December with its strong average return is now underway. Analysts have different interpretations as to what timeframe the Santa Claus rally period spans; some maintain that it encompasses the trading days between Christmas through the the first couple of sessions of the new year, while others contend that the Santa Claus rally period spans the entire month of December, the strongest month of the year for equity markets, on average. In general, the period following December 15th tends to be strong for stocks as investors begin to take holidays and cover negative bets ahead of the end of the year (and ahead of the upcoming earnings season). The S&P 500 Index has gained in 16 of the past 20 periods between December 15th and January 3rd for an average gain of 2.31%. Conversely,the period between Christmas (December 25th) and January 3rd has recorded gains in 13 of the past 20 periods, averaging a return of 1.04%. Clearly, the dominant returns and the better probability of success directly follows the tax-loss selling period as investors buy the dip, accumulating equity positions into the end of the year. Arguably, this was the reason for the surge in equity prices during Wednesday’s session. Headline risks to the broad equity market have certainly been elevated over recent weeks, but, as long as shock events between now and the end of the year remain subdued, Santa is expected to deliver his annual Christmas bonus to investors.
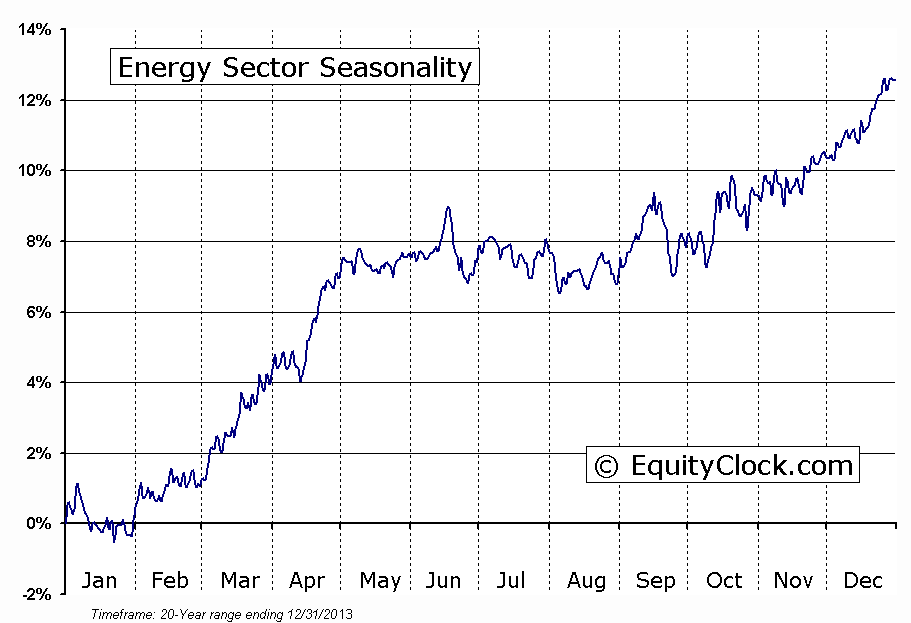
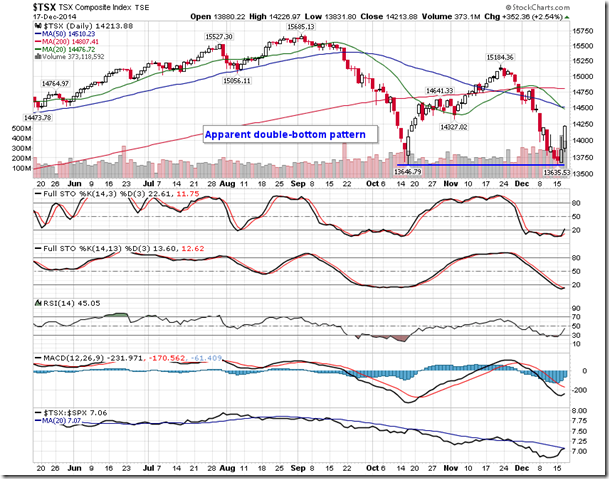
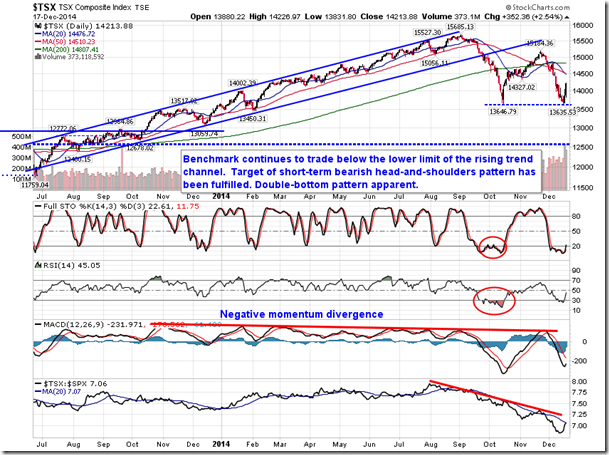
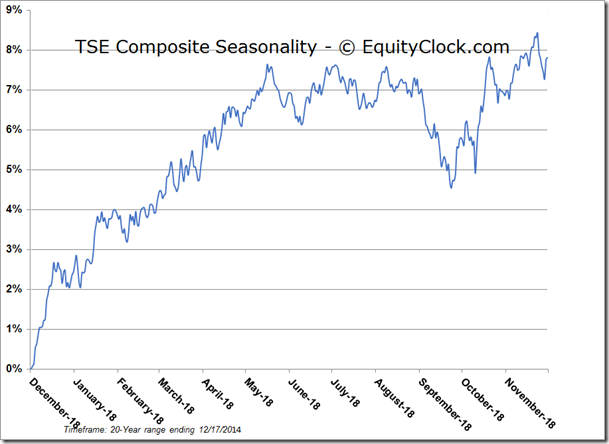
The Toronto Stock Exchange Composite is showing a particularly appealing setup leading into this seasonally strong period. The Canadian benchmark appears to be carving out a double bottom pattern around 13,650. The benchmark has rallied strongly over two sessions from this low, originally charted in mid-October, emphasizing the significance of the level of support below this market. Momentum indicators are showing signs of curling higher, hinting of renewed buy signals ahead of the period of seasonal strength ahead. Strength over the last couple of sessions has been attributed to substantial gains in the energy sector as buying pressures finally materialize amongst the beaten down names. Investors are not going to want to take holidays or close the books on the year with negative bets on equity positions, therefore, further short covering should be expected. The end of year seasonal strength in the energy sector typically leads into a basing pattern that can stretch through to late February, at which time the period of seasonal strength for the sector begins.
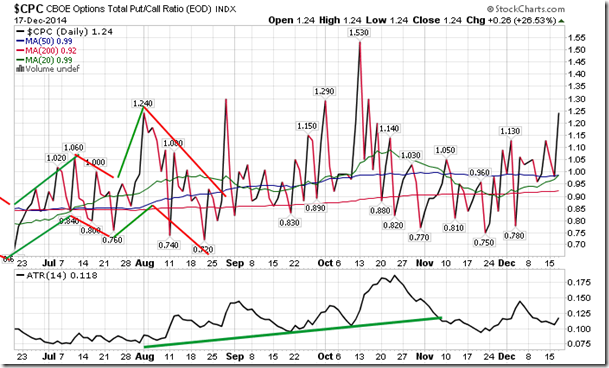
Sentiment on Wednesday, as gauged by the put-call ratio, ended bearish at 1.24. Despite the powerful rally in stocks on Wednesday, more put options traded than calls, typically an indication of caution as investors seek to protect portfolio positions. Fortunately, as investors protect themselves from downside risks, they are less willing to sell should the favourable market trend quickly reverse. This implies that the upside reward is greater than the downside risks, a scenario that was apparent in mid-October, the last time the put-call ratio traded to this high. Of course, stocks realized an unprecedented rally following the low set on October 15th, giving merit to the contrarian view of the bearish sentiment indicator.
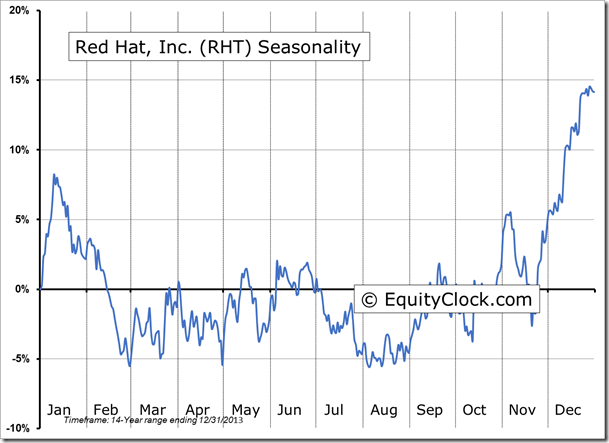
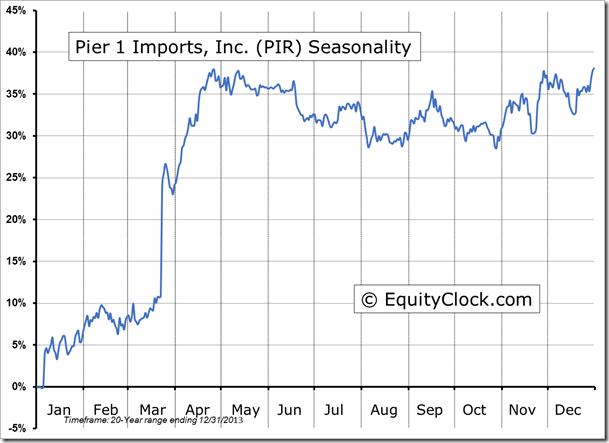
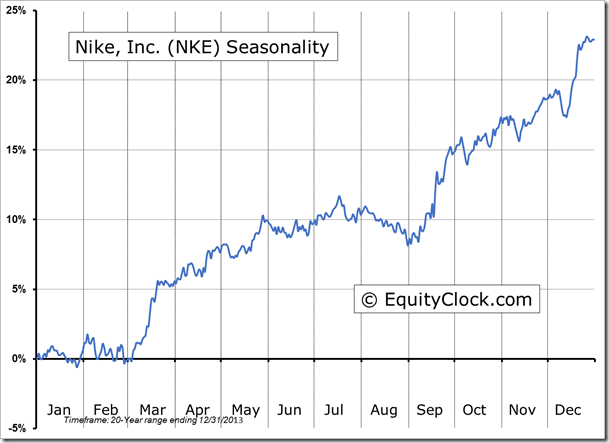
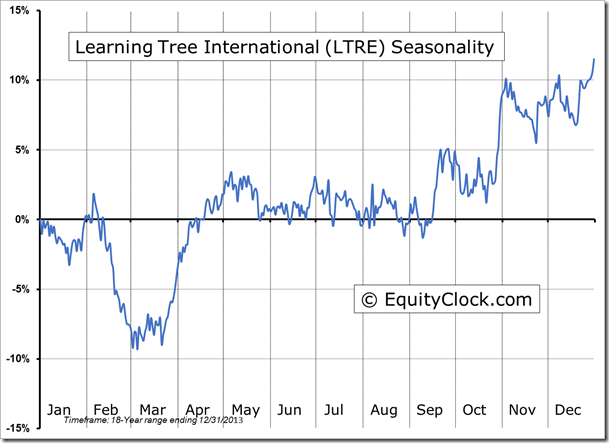
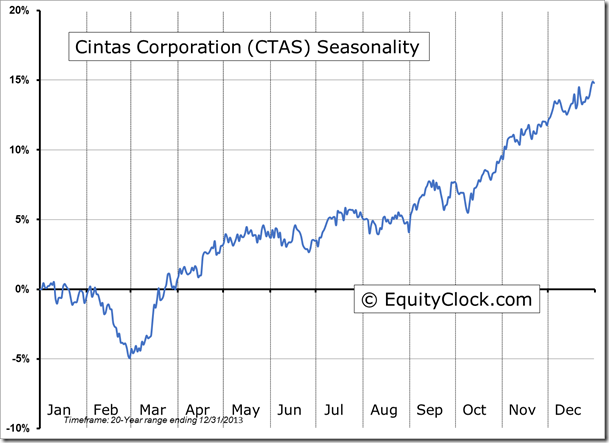
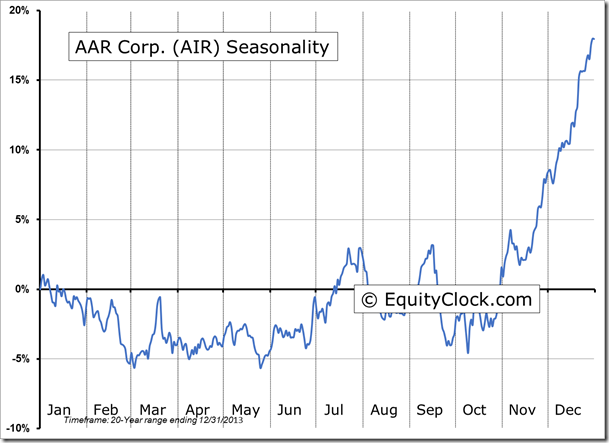
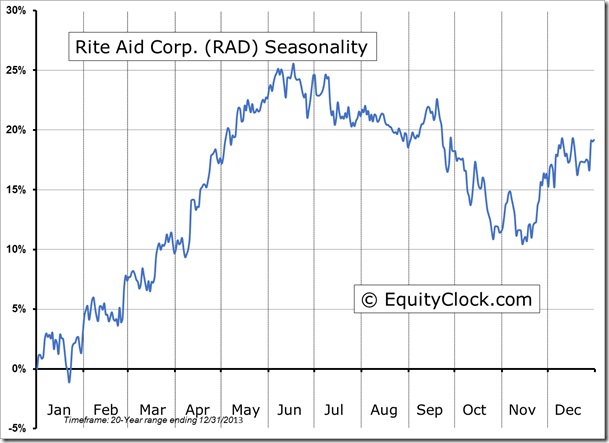
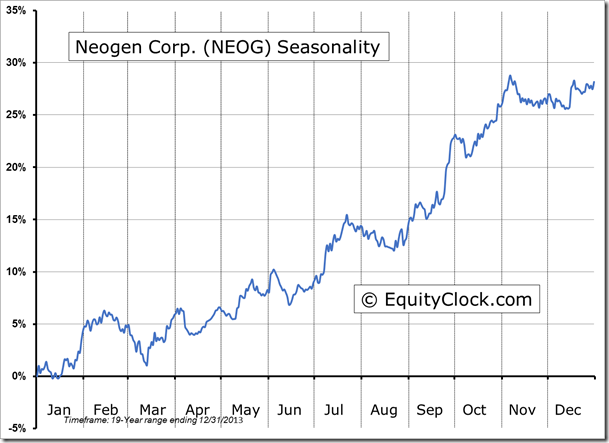
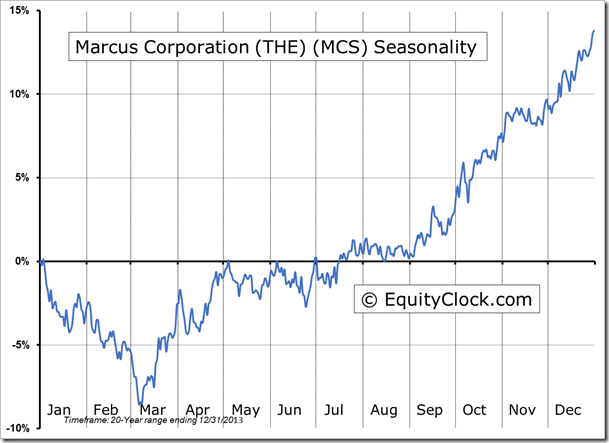
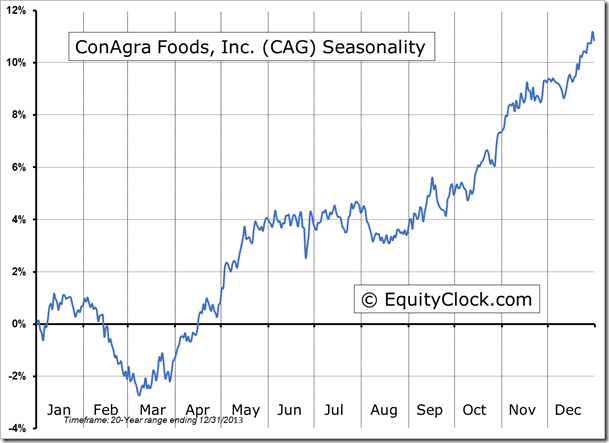
Seasonal charts of companies reporting earnings today:
S&P 500 Index
TSE Composite
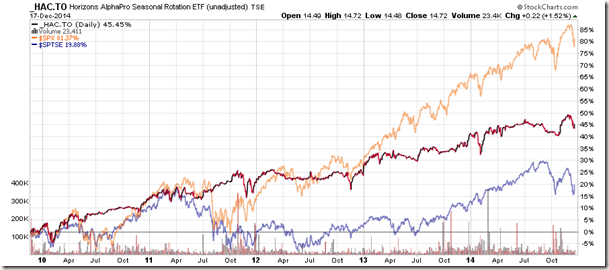
Horizons Seasonal Rotation ETF (TO:HAC)
- Closing Market Value: $14.72 (up 1.52%)
- Closing NAV/Unit: $14.71 (up 2.04%)
Performance*
| 2014 Year-to-Date | Since Inception (Nov 19, 2009) | |
| HAC.TO | 2.87% | 47.1% |
* performance calculated on Closing NAV/Unit as provided by custodian
