As you know, a picture is worth 1000 words, so consider this detailed post as my take on the current state of the stock market and economic cycle.
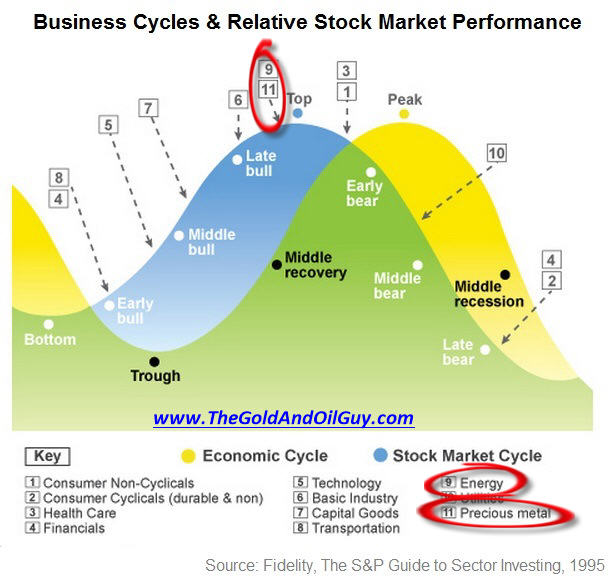
The charts below will help you see where the US stock market and economic cycles appear to be.
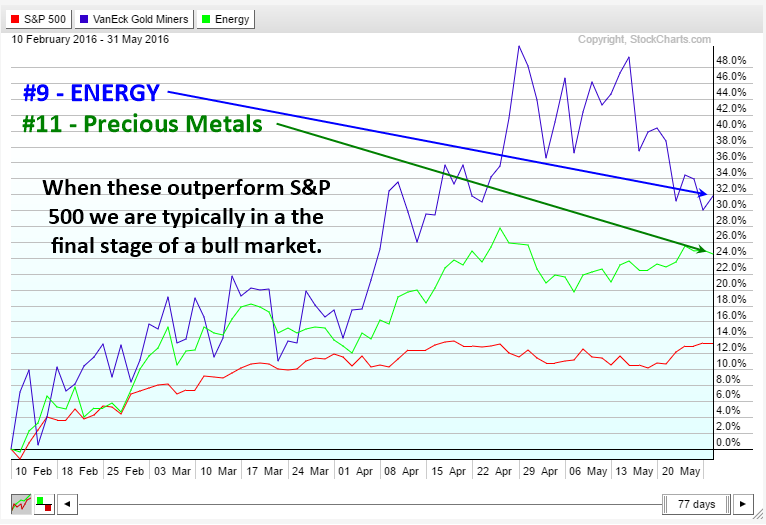
The first image shows two cycles: the blue one is the stock-market cycle itself along with the sectors that typically outperform during specific times within the cycle. Note that during the late stages of a bull market, safe-haven plays -- Energy and Precious Metals -- become the preferred choice for investors.
Typically, the stock market tops before the economic (business) cycle does. Why? Because investors can see that sales are starting to slow as they realize that earnings will soon weaken while share prices fall. So traders start selling before the masses see and hear about a weakening economy. The stock market usually moves 3-9 months ahead of the average retail investor.

Stock Market Topping According to Sector Analysis

Elliott Wave Count – My Educated Guess
Elliott wave theory is a tough strategy to follow. Which means that if you give the same chart to 5 different people, you're likely to see 3-to-5 very different wave counts.
Recently I've seen a flurry of EW charts for the S&P 500's wave count, which appear to be off base. When I do Elliott Wave counts I like to use more than just price. I like to look deeper using market internals, volume flows and overall market sentiment at specific times. They must all scream extreme market FEAR in order for me to acknowledge a wave low.
Fear is much easier to read than greed. So based on waves of fear, I can plot the rest of the waves. By doing this, I feel it gives a truer reading of significant highs and lows.
See my analysis below for a visual:

Stock Market And Economic Cycle Conclusion
In short, the current market analysis is still very bearish, which means that this could be the last opportunity to get short the market near the highs before we dive into a full-blown bear market in the next 3-5 months.
I will admit, the market is trying VERY hard to convince us it wants to go higher as it flirts with recent highs for the second time in the past 8 months. I know it is doing its job because so many traders and investors are changing their tune from bearish to SUPER BULLISH.
I don’t see it that way JUST yet. But it could happen as the market will do whatever it wants. But my analysis points to substantially lower prices over the next year.
