Investing.com’s stocks of the week
Let us check out US stock market breadth. Before we start, I would like to state that the charts below are as of last Friday’s close. As always, let's work with three different tools and indicators:
a) Advance Decline data;
b) Percentage Above Moving Averages data; and
c) 52 Week New Highs and Lows data.

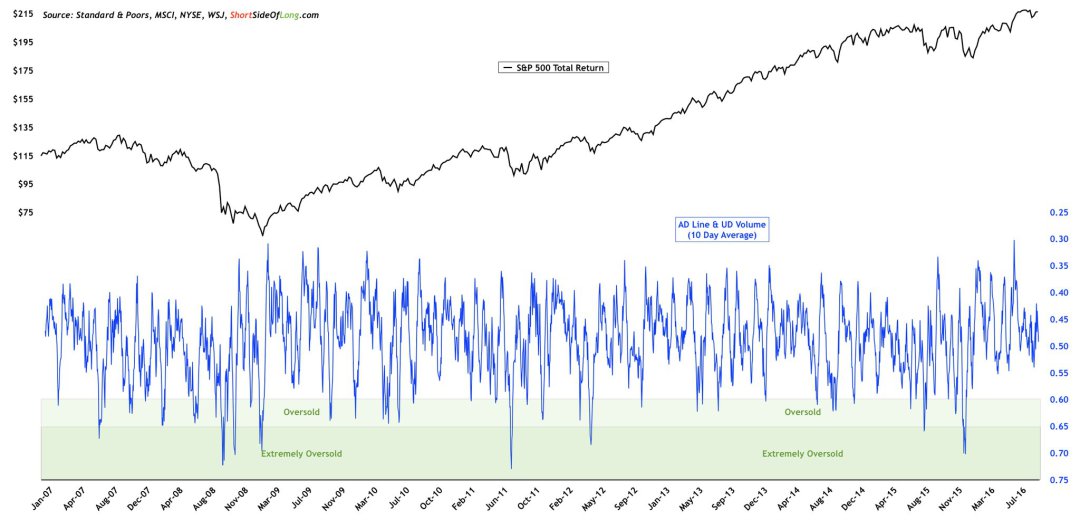
The NYSE 10 day Advance/Decline line has not been even slightly oversold since February of 2016, when the market experienced a sharp sell off due to Chinese economy worries (seems like a distant memory these days). However, our investment discipline has us adding at least some equity positions into our Hong Kong fund whenever breadth becomes “extremely oversold”.
Regular readers of this site should remember that buying and selling pressure tends to ebb and flow… so do not fall into a trap thinking the market will never be oversold again. We are not chasing prices right now, that is for sure!

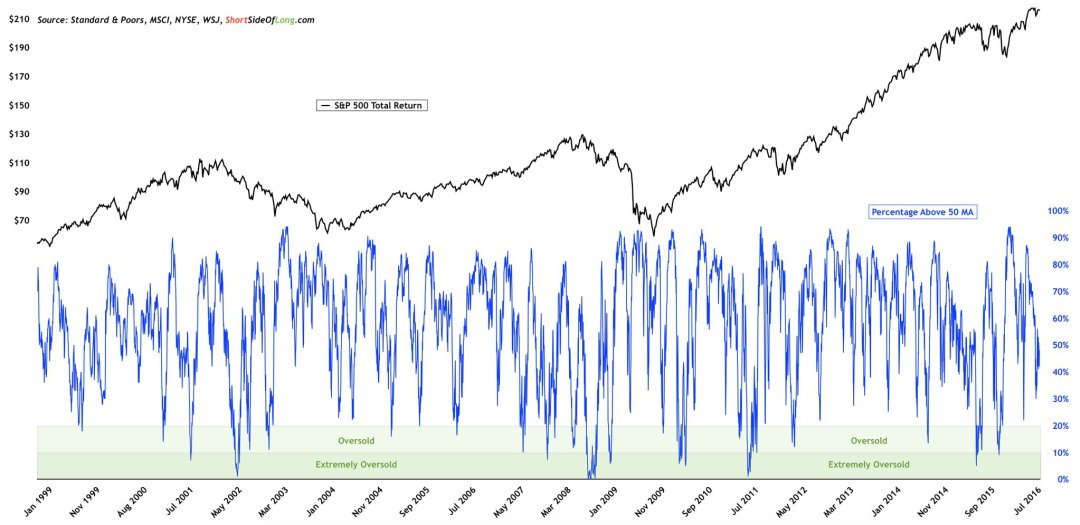
The S&P 500 is probably the most widely followed benchmark in the world and the most renowned and distinguished asset class in the world. Therefore, it makes a lot of sense following the companies within this index. Currently 48% of S&P components are trading above their respective 50 day moving average. We are neither overbought nor oversold over the short term perspective, so there is no real edge.
Investors need to bear in mind that the level below 20% is considered oversold, while 10% and below usually marks some kind of an important bottom worth buying (something we did in our Hong Kong fund during August 2015 and February 2016).

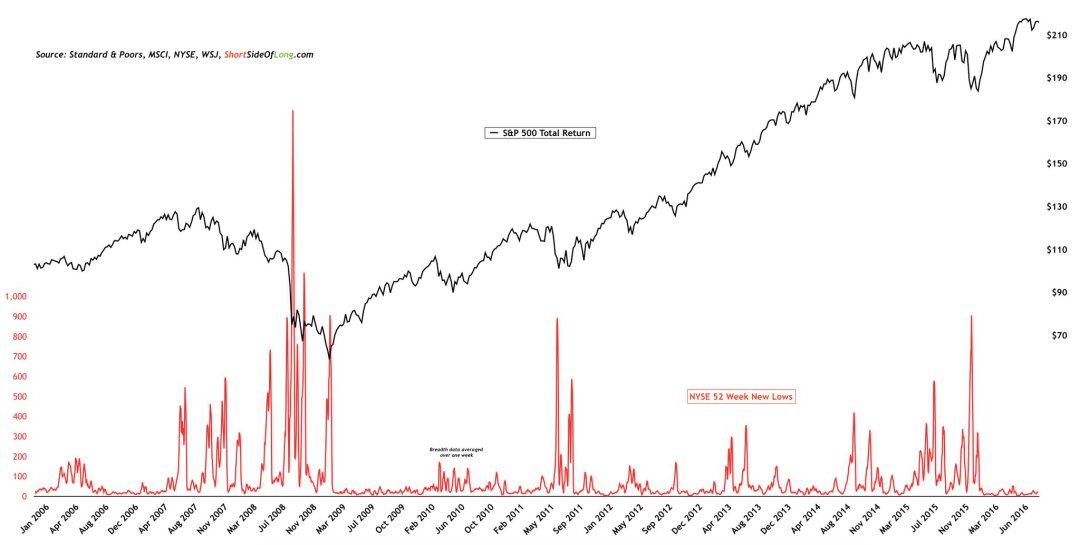
Finally, we look at the number of stocks making 52 Week New Highs or Lows. Historically when there is a spike in the number of companies making 1 Year New Lows, the overall stock market tends to put in at least a short term bottom.
The one during February 2016 was the biggest spike since the Eurozone Debt Crisis in 2011. Did you act on this signal yourself? We did because our strategy remains one of buying low and selling high. Observing the chart above, one can see that there is no selling pressure as of late though… and we are NOT interested in chasing prices higher.
