Context plays a vital role in the development of reliable market forecasts. Short-term price behavior only has meaning when analyzed in the proper context afforded by the long-term view, so all investing and trading strategies should begin with a thorough understanding of the big picture.
The cyclical bull market in stocks that began in early 2009 has developed into one of the largest and most speculative bubbles of the past 100 years. Further, at a current duration of nearly eight years, the latest cyclical top is long overdue and could form at any time.
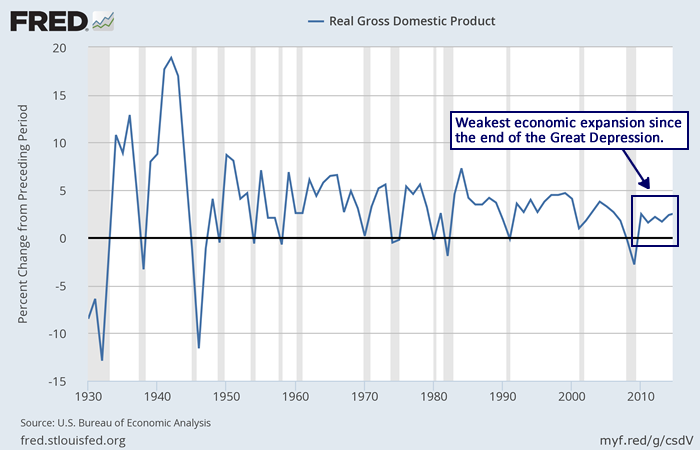
In terms of real GDP growth, the current economic expansion has been the weakest since the end of the Great Depression.
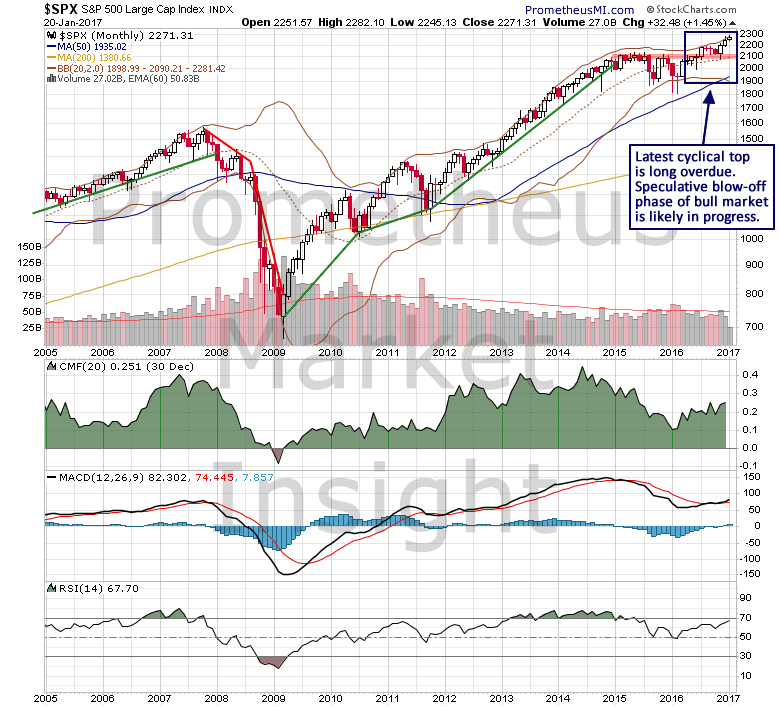
If economic growth has been so poor during the past eight years, why has the stock market experienced such a strong advance during that time? Why is the S&P 500 index up a staggering 240% from the low in March 2009?
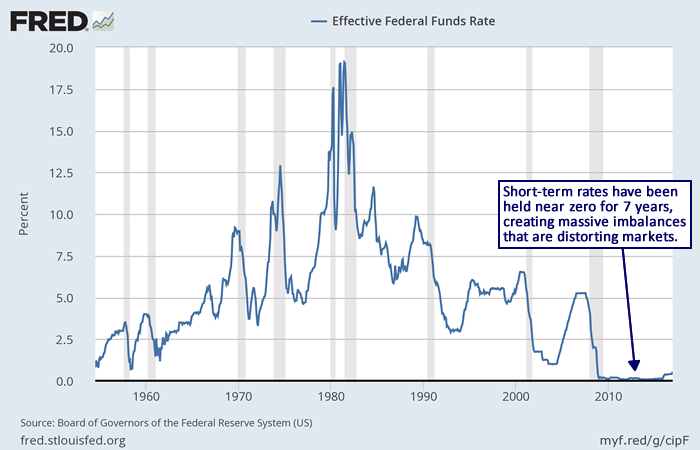
Those gains have been fueled primarily by the Federal Reserve and its reckless stimulus policies that have targeted risk assets such as stocks. By holding short-term interest rates near zero for seven years, the Federal Reserve has encouraged malinvestment and speculation while punishing saving, in the process creating massive market distortions and imbalances.
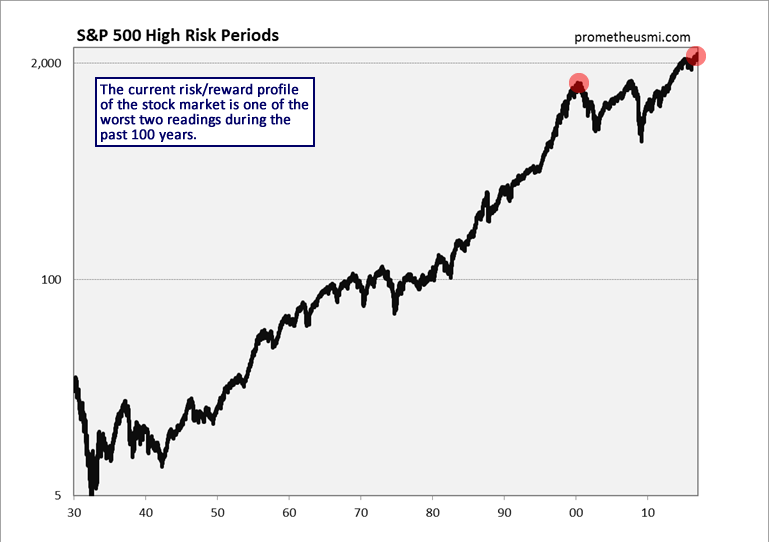
As a result, the current risk/reward profile of the stock market from an investment perspective is at one of the two highest levels of the past 100 years. Only the peak in 2000 during the dotcom bubble created a more overvalued market than the current one.
The current P/E ratio of the S&P 500 index is now over 25 and it is priced to deliver slightly negative annual returns during the coming decade. Think about that. The stock market will likely be at or below current levels ten years from now. That is because there is always a cost for manipulating markets to this degree, and, in this case, the cost will ultimately prove to be severe. In essence, the Federal Reserve has pulled future gains into the present, setting the stage for many years of extremely poor performance.
Of course, because bubbles are highly irrational by nature, predicting the timing of their demise with any useful degree of statistical confidence is difficult. However, careful analysis of market data can indicate when a bubble is on the verge of collapse.
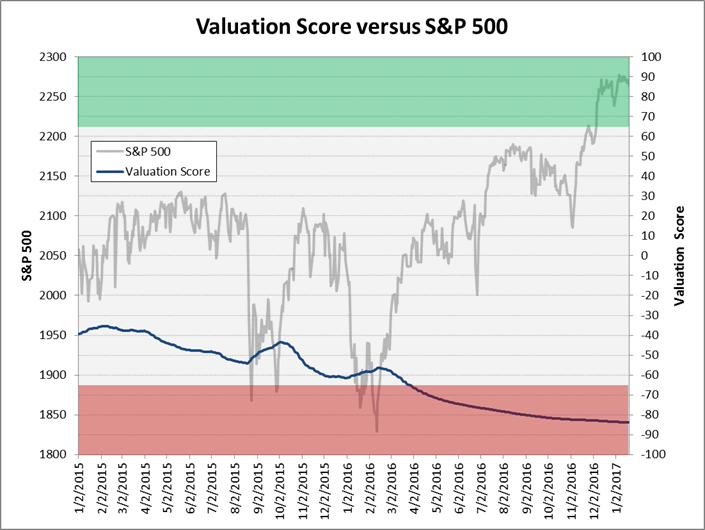
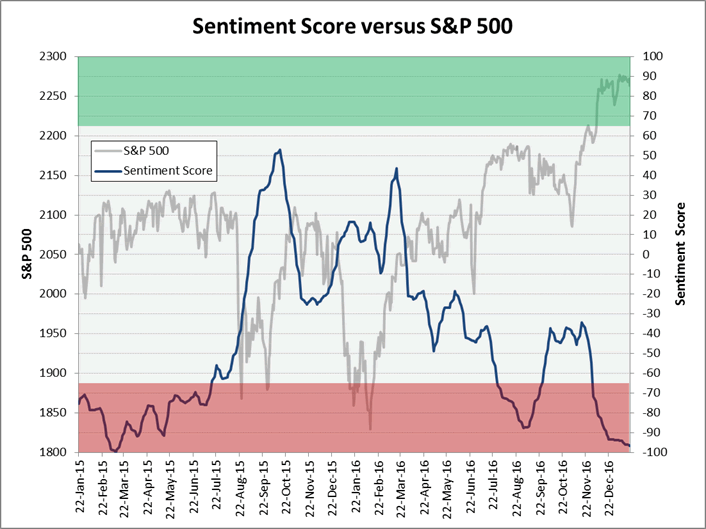
Our computer models monitor a large basket of data that have, historically, provided reliable signals with respect to long-term direction, and right now several indicators suggest that the current bubble is vulnerable. For example, our cyclical valuation and sentiment scores, which vary from an extremely bullish value of 100 to an extremely bearish value of -100, are both near bearish extremes.

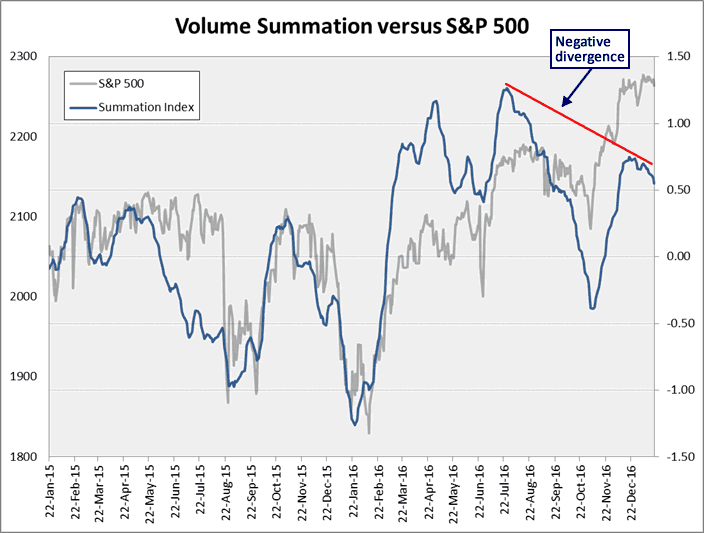
Additionally, although market internal data such as breadth and volume have yet to exhibit similar weakness, both currently display the early signs of a negative divergence. Volume summation has started trending lower after forming a top in December that was much lower than the previous peak in July.
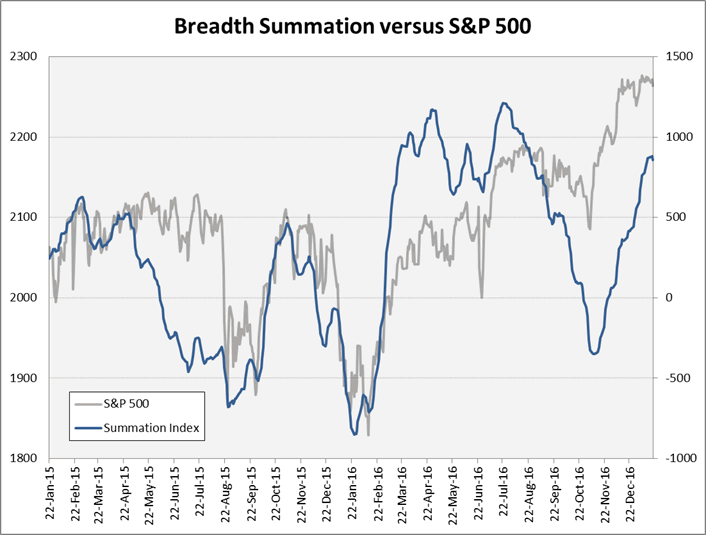
Breadth summation has not started trending lower yet, but it has struggled to move higher in January, suggesting that a top may be forming right now.
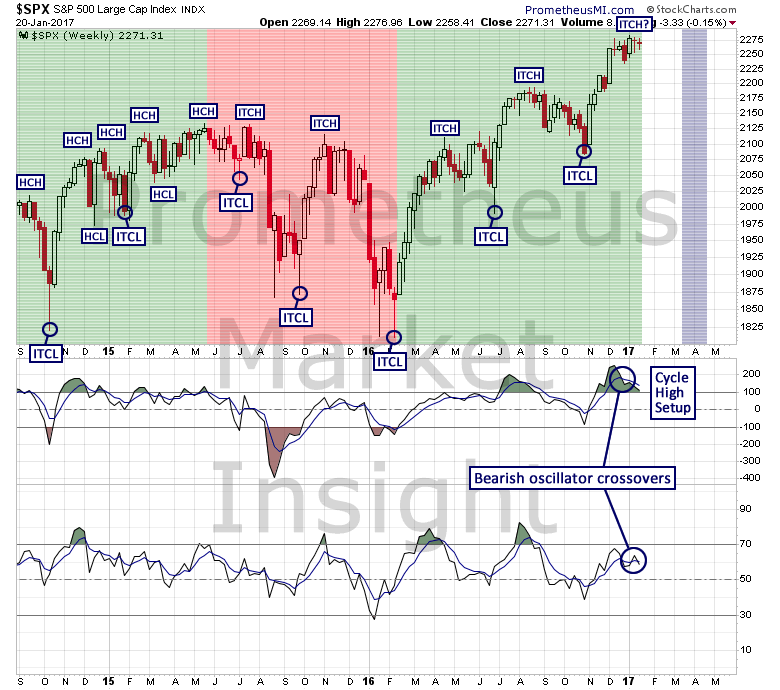
From an intermediate-term perspective, the stock market may also be in the process of reversing. In early November, our computer models correctly predicted the formation of the latest intermediate-term low, but after five weeks of strength, the S&P 500 index has struggled to move higher during the past six weeks.
A cycle high setup occurred this week, suggesting that an intermediate-term cycle high (ITCH) may have formed in early January. A cycle high signal could occur as soon as next week, so market behavior should be monitored carefully during the next several sessions.
As always, it is important to remember that a long-term top is a process, not an event. Anything can happen over short-term time periods, but the key to having consistent success over the long run as an investor and a trader is to stay aligned with the most likely scenarios and protect yourself from the unlikely ones.
There will come a time when the risk/reward profile of stocks is once again favorable and the judicious study of market data will signal when that next long opportunity develops, just as it did in March 2009. However, now is a time for extreme caution and we remain fully defensive from an investment perspective.
